Version 4.21 is out and includes a variety of performance improvements, control over feature drawing order, an enhanced snapping experience, WGS84 support in local scenes, and more. Here is an overview of some of the release highlights.
Performance improvements
Version 4.21 introduces performance improvements that will decrease the draw time of your layers. These improvements are focused on polygon features and maps with multiple layers.
Complex polygons draw faster. Draw time has significantly improved for layers with polygons with a large number of vertices. Behind the scenes, we added a new simplification algorithm to preprocess the geometries and optimize memory management. We also use web assembly for triangulating complex polygons. As you can see in the example below, this Arctic sea ice layer loads over 5x faster than the same layer in 4.20. The improvement varies depending on the characteristics of the layer, but for most polygons with a large number of vertices, we’re seeing at least a 2-3x improvement.

Layers with many polygons benefit. Because of the optimizations mentioned above and the switch to web assembly, you should also see performance improvements for layers with a large number of polygon features. The following example shows a layer with over 73,000 polygons. On average, we are seeing a 20% improvement in draw time.

Maps with many layers are smoother and faster. We’ve also added some optimizations for the way we handle maps with a large number of feature collections. These optimizations have resulted in an improved start time and an improved frame rate for smoother map panning.
Enterprise point feature layers load faster. At version 4.19, we improved the performance of point FeatureLayers hosted on ArcGIS Online. Version 4.21 brings these changes to ArcGIS Enterprise point services.
Control the drawing order of features
You can configure the order features are drawn in the view by setting the orderBy property of a feature layer, CSV layer, GeoJSON layer, and OGC feature layer. This property allows you to sort features using any field or Arcade expression that returns a number or a date.
layer.orderBy = [{
 order: "descending", // or "ascending"
 field: "AADT"
}];
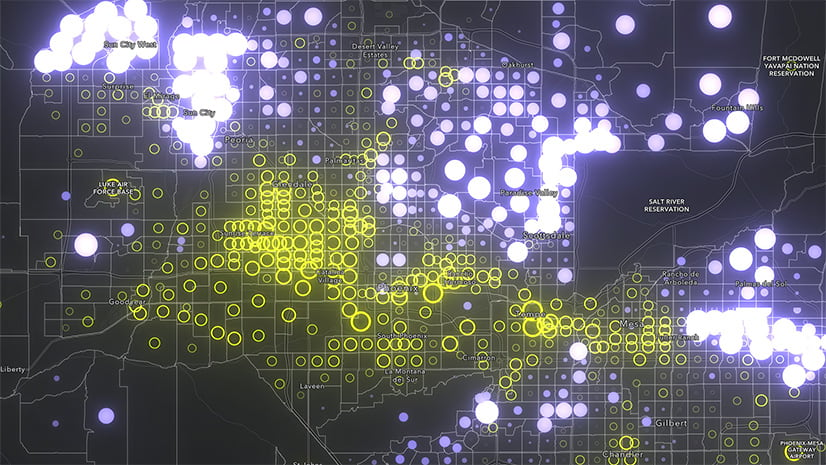
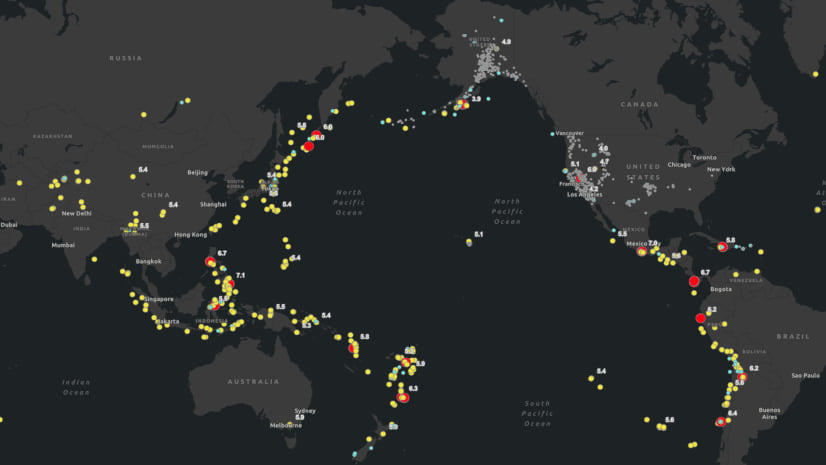
In layers with date fields that have many overlapping features, this property allows you to ensure the most recent features are drawn on top of older ones. It is also important in proportional symbol maps where smaller features are typically rendered on top of large ones to maximize the visibility of overlapping features in the view.

Check out the Configure feature sort order sample for more information. You can also read about how this capability is accessed in the ArcGIS Online Map Viewer in this recent blog.
Layer effects light up webmaps
Effects like drop shadow, tinting, and glow effects give you a powerful degree of artistic control over the look of your maps. While you could apply these cartographic game-changers programmatically using the JavaScript API since 4.18, the ability to use them in ArcGIS Online is brand new. With yesterday’s ArcGIS Online update, you have the ability to interactively apply and adjust effects on your layers in the map viewer and then save them to your webmap. When your webmap is loaded in your web app, you will see the beautiful effects in your map. You can also add or adjust the effects programmatically and save them to a webmap.

Feature table supports more layer types
Introduced at 4.15, the FeatureTable widget allows you to interact with a tabular view of your data.
More feature layer types. The feature table has new support for the following layer types: CSV, GeoJSON and WFS (prior to 4.21, it was limited to feature layers and scene layers).
Imagery layers. Display raster catalog info associated with an imagery layer that has a mosaic dataset using the feature table widget. For example, you can examine resolution and cloud cover information associated with each image in the service.
User interface to configure snapping
The SnappingControls widget was added to provide a simple user interface to handle all snapping functionality. This widget provides the ability to control whether snapping is enabled, which layers to snap to, and other snapping settings. This UI is included in the Sketch widget by default, but can be programmatically integrated into your workflows using SketchViewModel, Editor, and EditorViewModel. In the future, we plan to add this as part of the default Editor widget experience, and also make it available for the Measurement widget.

Improved experience while drawing
The Sketch widget allows your end users to update or draw new features in a graphics layer. You can chose to override the default symbology of the new features by setting the Sketch widget’s SketchViewModel pointSymbol, polygonSymbol, or polylineSymbolproperties. Prior to this release, you wouldn’t see the defined symbology until the drawing had completed. With this update, your symbology will be shown while in an active drawing state.

Additionally, a point symbol was added to the mouse cursor when drawing using the SketchViewModel or Sketch widget. You can override the default symbol by setting the SketchViewModel’s pointSymbol property.

An improved Editor widget is coming
The editing capabilities in the API have been evolving over many releases to provide an increasingly better and more powerful user experience. In version 4.22, we will introduce a significant update to the look and feel of the Editor’s UI and workflow. In addition to the UI/UX improvements, there will be support for batch editing workflows and options for snapping and selections.
We do not anticipate any loss of functionality or breaking changes, but the user experience will deviate slightly from the current implementation. Version 4.22 will be the first release with these Editor updates. As it matures, additional capabilities will be implemented.
If you would like an early look at these changes, check out the /next repo where we will post early development updates.

TimeSlider actions
The TimeSlider widget has been updated to support custom actions, which allows you to execute custom code such as such as setting the timeExtent to a specific date or copying the timeExtent to the browser’s clipboard. The trigger-action event fires whenever an action in the menu is clicked.

Local scene support for WGS84
SceneView now allows you to fully leverage your WGS84 scene layers by combining them with Web Mercator layers in local scenes. In addition, local scenes now support geographic coordinate systems, giving you more flexibility in displaying data. Constrain the view by defining a clipping area for example.

WebGL2 support
SceneView now uses WebGL2, if available in the browser, as the underlying rendering engine. This change is the basis for future visualization capabilities and performance enhancements. WebGL1 context can still be explicitly requested for apps using externalRenderer.
Design lines and polygon CIM symbols
The CIM Symbol Builder helper app has been updated to allow you to create line and polygon symbols (in addition to point symbols). The new CIMSymbol in-progress updates as you combine different symbol layers and update symbol layer properties. When you’re happy with the symbol that you have designed, you can get the symbol JSON and use it to create CIMSymbols in your own applications. Learn more about it in this blog article.

3.x changes
Now in “Extended Support”
4.x is the focus of all new innovation and is the recommended JavaScript API for building compelling web apps with interactive user experiences and data-driven 2D and 3D visualizations. While we will continue to release very minor updates to the 3.x API to address a handful of bug fixes, it will now be released directly into the Extended Support lifecycle phase, as opposed to General Availability. See the Product Life Cycle document for more information.
Web Optimizer discontinued
The Web Optimizer is no longer available for creating 3.x-based custom builds of the ArcGIS API for JavaScript. If your app references a custom build that was previously created, it will continue to work for the time being, however all custom builds will be removed from our hosting environment in July 2022. Our recommendation is to start using version 4.x of the API, as it offers a lot more flexibility and simplicity when creating custom builds. See Introduction to Tooling for more details. If you would like to continue to use 3.x, we recommend using the CDN version or download a local build.
Learn more
This was only an overview of the API updates included in 4.21. To get a full overview of the contents of this release, check out the release notes and take the new capabilities for a test drive using the new samples.


Thanks, Julie. What about editing related features in the Editor widget. I thought it was supposed to be on the roadmap for this year. It is seriously needed to build robust editing apps. Is there any update?
Hello! Editing related records is certainly an important capability and is currently in design phase for Editor (and other places like the popup). I don’t have a firm timeframe yet, but it is a high priority requirement. Sorry to not have more concrete information for you. If you’d like, you can tag me in a post on Esri Community and I can provide an update once I have one.