ArcGIS Online lets you understand the world around you by using interactive maps to connect people, locations, and data. You get smart, data-driven styles and intuitive analysis tools that deliver location intelligence. ArcGIS Online gives you the ability to make maps and apps to share your insights with your organization or the world. You can use it as a complete, cloud-based solution or to extend and complement the capabilities of ArcGIS Pro and ArcGIS Enterprise.
Don’t have an ArcGIS account? See Create an ArcGIS Account.
The September 2021 update includes new functionality in Map Viewer and other enhancements and new functionality throughout the ArcGIS Online website. Highlights are provided below.
Quick links
Use the links below to jump to sections of interest.
- Map Viewer
- Scene Viewer
- ArcGIS Instant Apps
- ArcGIS Dashboards
- ArcGIS Experience Builder
- ArcGIS Web AppBuilder
- Featured group content
- Collaborations
- Administration

Map Viewer
With the April 2021 update the new Map Viewer came out of beta, introducing many new features and capabilities. Administrators and members are encouraged to configure the new Map Viewer as their primary map viewer to take advantage of these. Note that both viewers are available, and some workflows (such as analysis) require Map Viewer Classic. For help in deciding which to use, see Which map viewer should I use?
Both Map Viewer and Map Viewer Classic can be opened via the app launcher regardless of the primary viewer specified. The primary map viewer is configured by the administrator in the Map section of the organization settings. Individual members can set their their own viewer preference.
With this update, Map Viewer has been enhanced with new capabilities and features, including the following:
Effects
Using effects, you can enhance your maps using creative visualizations. For example, you can apply a bloom effect to point features to highlight them or make the labels on a map stand out by applying a drop shadow effect. Effects can be applied to basemaps and operational layers.
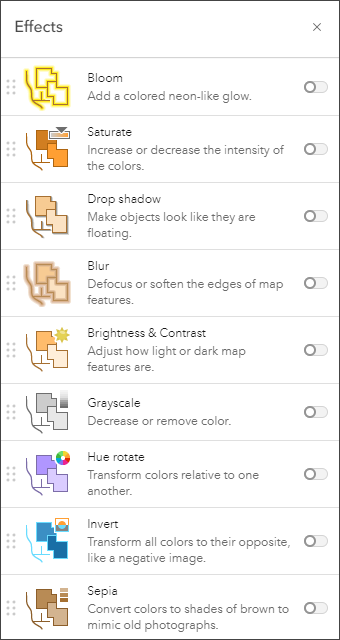
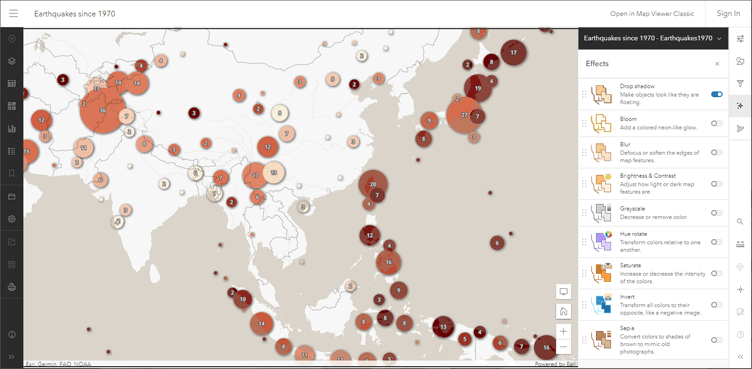
Effects are easy to apply. Click the effects button on the Settings (light) toolbar and turn on the desired effect, then adjust the effect settings. The map shown below applies a single drop shadow effect to a layer styled using Counts and Amounts (Color).
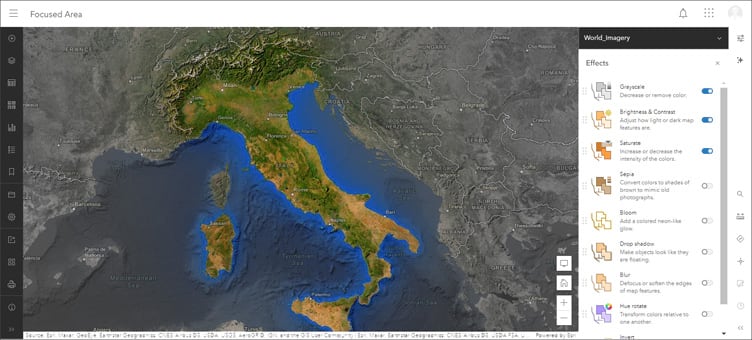
When using multiple effects, you can experiment with reordering them to change how effects are cumulatively applied. You can also combine effects with blend modes and different styling options to fine-tune the appearance of the map.
The map shown below applies effects to both the basemap and operational layers and combines layer filters and blending options.
For more information, see Use effects, Layer effects in Map Viewer and Enhancing imagery basemaps with layer effects.
Charts
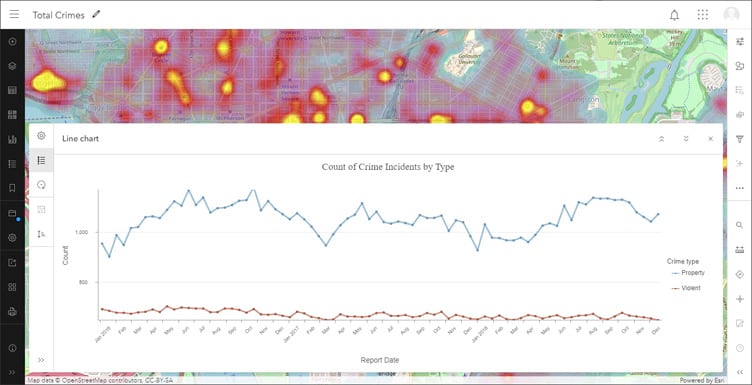
Charts are now out of beta. Add bar charts, histograms, scatter plots, and line charts to your map to help discover patterns, trends, and relationships in data. Line charts are newly added and allow you to visualize change over a continuous range, such as time or distance.
For more information, see Visualize change with line charts in Map Viewer and Configure charts.
Feature display order
You can configure the order features are drawn in a layer by setting the feature display order, found in the layer properties in the Settings (light) toolbar. Use any numeric or date field to set the order.
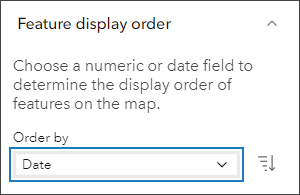
For example, layers can be sorted by date to ensure the most recent features are drawn on top of older ones. Or sort proportional symbol maps where smaller features are typically rendered on top of large ones to maximize the visibility of overlapping features in the view.
Order can also be sorted in ascending or descending order. The animated maps shown below display earthquakes by magnitude in ascending and descending order based on the earthquake event time.

Other new capabilities include the following:
- Set image display properties for imagery layers.
- View tables for imagery layers published from mosaic datasets or image collections.
- Configure floor-aware maps.
- Add and configure OGC WFS, WMS, and WMTS layers.
For more information, see What’s new in Map Viewer (September 2021).

Scene Viewer
Use Scene Viewer in ArcGIS Online for creating, viewing, and exploring 3D scenes. With this release, the following new capabilities and features have been added.
You can now use WGS 1984 layers to local scenes which provides more flexibility when displaying data. Adding WGS 1984 Layers to Local Scenes enables users to pair scene layers with Web Mercator basemaps and elevations. Users can also clip these scenes to an extent for better performance and subsurface navigation.
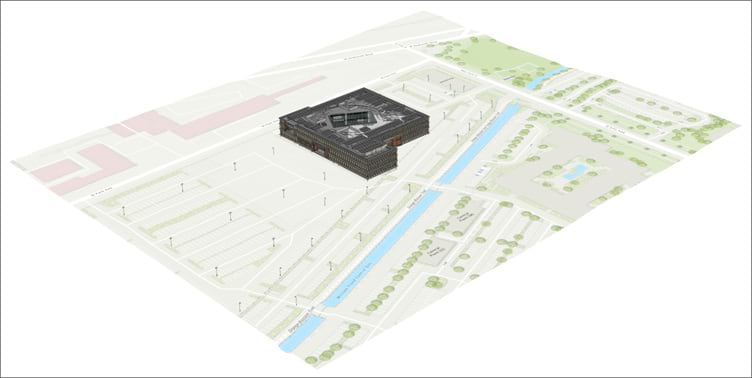
Scene Viewer has expanded its support of layer types by allowing you to add WFS layers to your scenes.
By default, scenes now use WebGL2 to render 3D graphics, which lays the groundwork for future performance and visualization enhancements.

ArcGIS Instant Apps
ArcGIS Instant Apps are the next generation of configurable apps, featuring a streamlined experience that lets you build apps quickly and easily using express setup mode, or you can switch to full setup mode to select additional tools and settings.
All Instant Apps are available via a gallery, which can be opened in several ways:
- From the Overview tab for a map item, click Create Web App and choose Instant Apps.
- From Content, click Create app then choose Instant Apps.
- Using Map Viewer, click Create app in the Content (dark) toolbar, then choose Instant Apps.
New in this update:
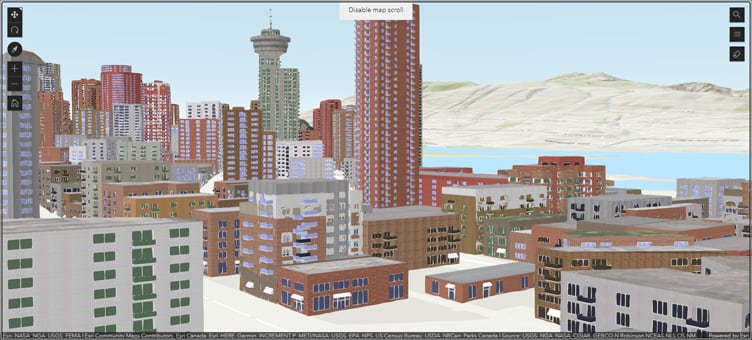
Basic is a new Instant App template that includes the standard tools (such as navigation, legend, bookmarks, and more) for showcasing your maps and scenes.
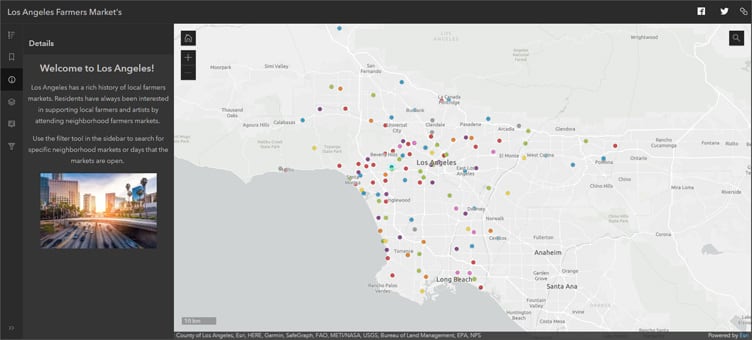
Sidebar is a new Instant App template that includes tools to allow viewers to interact with and update data. Editing tools enable viewers to update and add features, while filters enable exploration focus on specific data.
New in Beta this update
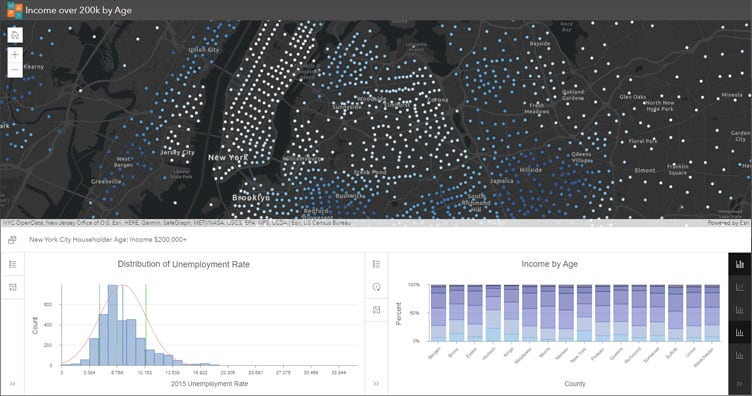
Chart Viewer (beta) allows app viewers to explore your map beside bar charts, histograms, line charts, and scatter plots related to your data. App authors can display multiple data-based graphics configured in Map Viewer to complement information in the map. Up to ten charts can be included in the app and each can be viewed alongside your map or side by side with other charts for comparison.
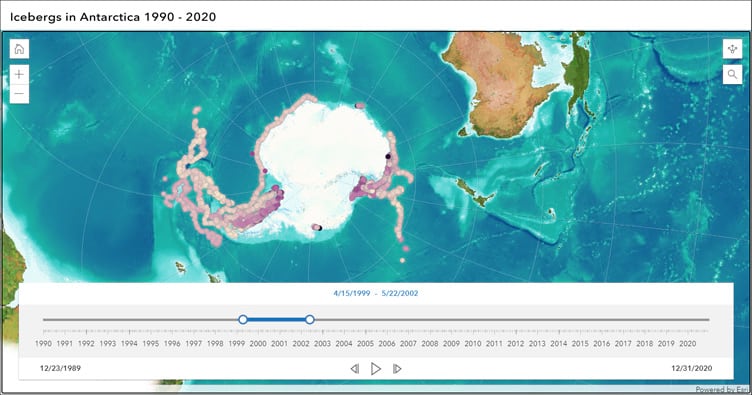
Slider (beta) allows you to animate your data based on numeric values or changes over time. Configure this app to display historical, live, or future data over any interval of time, including hourly, daily, monthly, annually, and intermittent. Viewers can move the time slider to interact with and understand how the data evolves through time or filter by value.
Updated Instant Apps
Zone Lookup has been updated with filters, additional theme options, interactive zone drawing, and support for related tables. Nearby and Attachment Viewer have been updated with support for related tables.
For more information, see What’s new in Instant Apps.

ArcGIS Dashboards
ArcGIS Dashboards enables users to convey information by presenting location-based analytics using intuitive and interactive data visualizations. Dashboards are used to help make decisions, visualize trends, monitor status in real time, and inform their communities.
ArcGIS Dashboards users can now enable data download for data-driven elements that are powered by ArcGIS Online hosted feature layers. Feature layers must first have Export Data enabled on the layer Settings tab.

Enabling data download allows dashboard viewers to download a CSV file of an element’s source data or summarized data which can be used for additional analysis and custom reports, or used in other applications. Data download can be enabled in the General section in each element.

For more information, see What’s new in ArcGIS Dashboards (September 2021) or Download data.

ArcGIS Experience Builder
Use ArcGIS Experience Builder to transform your data into compelling web apps without writing a single line of code. Build mapcentric or nonmapcentric mobile adaptive experiences for your audiences. Choose the tools you need from a rich set of widgets, design your own templates, and interact with your 2D and 3D content—all within one app.
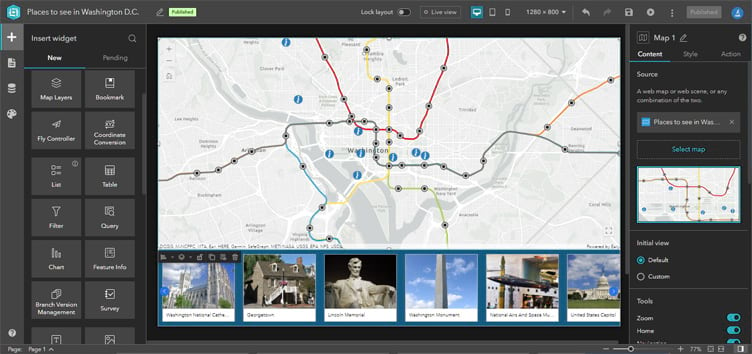
ArcGIS Experience Builder has been updated with the following:
Two new widgets are now available in ArcGIS Experience Builder: Search and Oriented Imagery. Search allows users to find locations based on specific layers and locators. Oriented Imagery allows users to interact with and visualize imagery that’s taken from any angle. Additionally, two new default templates now use Fly Controller widgets in a full screen and scrolling page. Other enhancements include support for line and area charts, new filtering capabilities, and more.
For more information, see What’s new in Experience Builder. To learn how to work with Experience Builder, see Try ArcGIS Experience Builder.

ArcGIS Web AppBuilder
ArcGIS Web AppBuilder delivers a way for you to easily create web apps that run on any device, using a gallery of ready-to-use-widgets. You can customize the look of your apps with configurable themes and can host your apps online or on your own server.
Three widgets have been updated in ArcGIS Web AppBuilder. The Visibility widget now allows you to define default values for line of sight settings. Situational Awareness now allows users to specify a time value for reports. Screening now allows users to sort the results of reports. With Smart Editor, you can now set a default reference system when you enable moving point features to a new coordinate location. For more information, see What’s new in ArcGIS Web AppBuilder.

Featured group content
You can now highlight important content in your group by curating a featured content gallery On the Overview tab of the group page, click Curate featured content.

Once added, featured content can be reordered by grabbing the item card, then dragging and dropping it into a new position.
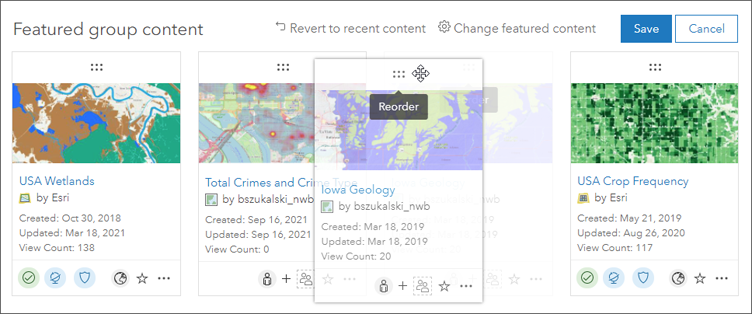
Only the featured content will display on the Overview tab, all content can be viewed by clicking View all group content at the bottom of the page, or by opening the Content tab.

Collaborations
Using collaborations, you can broaden access to your GIS content by sharing maps, apps, layers, and more with other trusted organizations. Depending upon your needs and workflows, two types of collaborations can be established: partnered collaborations and distributed collaborations. For more information, see Understand collaborations.
With this release, organizations in a partnered collaboration can now choose to suspend their collaboration. Suspending a collaboration restricts new members from being added to collaboration groups while allowing existing members and items to remain. Administrators from either organization can resume a suspended collaboration at any time.

Accounts and administration
Reports
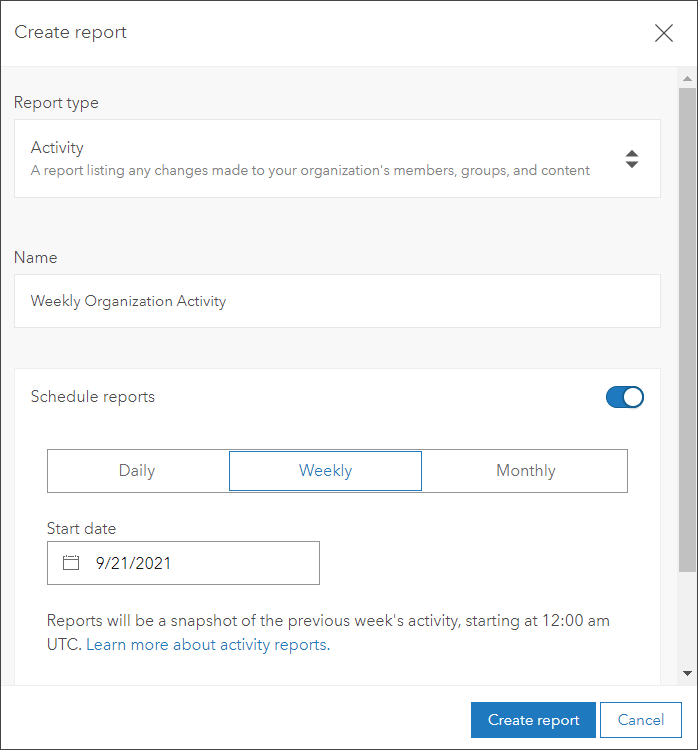
Reports are an effective administrative tool that helps you keep tabs on what’s happening within your organization. You can generate activity, credit, member, and item reports, which can be saved and also exported to CSV. For more information, see Create and access reports.
New in this release, administrators can schedule administrative reports to run automatically, ensuring that reports are regularly created and available. Depending on the type of report, reports can be scheduled to run daily, weekly, or monthly.
Organization basemap gallery
It is recommended that administrators update their organization basemap gallery to remove raster basemaps (not including imagery, elevation, and polar maps) that have entered mature support. Administrators will see reminder to update if the older default basemaps are in use.

Click Update basemap gallery to switch to the default Esri vector basemaps. If you have a custom basemap gallery, you should review all your basemaps and eliminate those in mature support. Maps and apps using basemaps in mature support will continue to work with the older basemaps, however you should update those still in use when possible.
Vector basemaps are available in over twenty map styles, more than thirty languages, and are updated every few weeks. Because vector basemaps are much smaller in size than their raster counterparts, they are more performant and efficient to download for offline use.
For more information, see Basemap gallery and Update basemap gallery.
Home page
Because the new ArcGIS Online home page is feature complete, legacy home pages will automatically be upgraded to the new home page early next year unless you request an extension.
If you started using ArcGIS Online before June of 2020, you’ll need to switch from the legacy home page to the new home page. All ArcGIS Online organizations created after June 30, 2020 only have the new home page, so there is no need to transition.
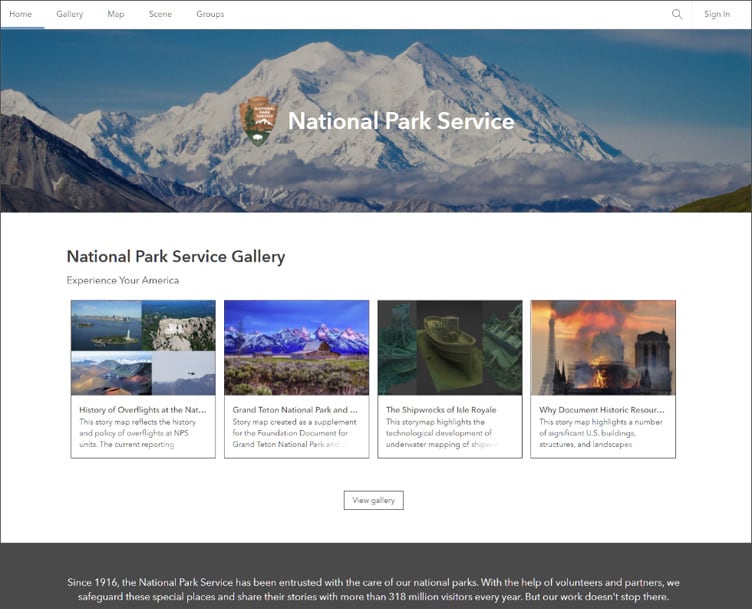
For more information, and to provide feedback, see Let’s transition to the new ArcGIS Online home page.

More information
For more information and additional details about this release, see the What’s new help topic or view all posts related to this release.
For other information, see the ArcGIS Online blog articles and ArcGIS Online at the Esri Community.
For news, updates, and information about other products, see the ArcGIS Blog and product resources at the Esri Community.

Commenting is not enabled for this article.