In the Designing Effective Dashboards technical session from the 2021 User Conference, we had yet another round of tremendous participation and support from dashboard users all over the world. If you did not get a chance to attend, the recorded session is available for streaming here.
With some of the latest upgrades in our product this year, including the release of data expressions using Arcade, and enhancements to selectors, we were able to demonstrate ways both novice and seasoned users alike can stretch their limits using our product.
-
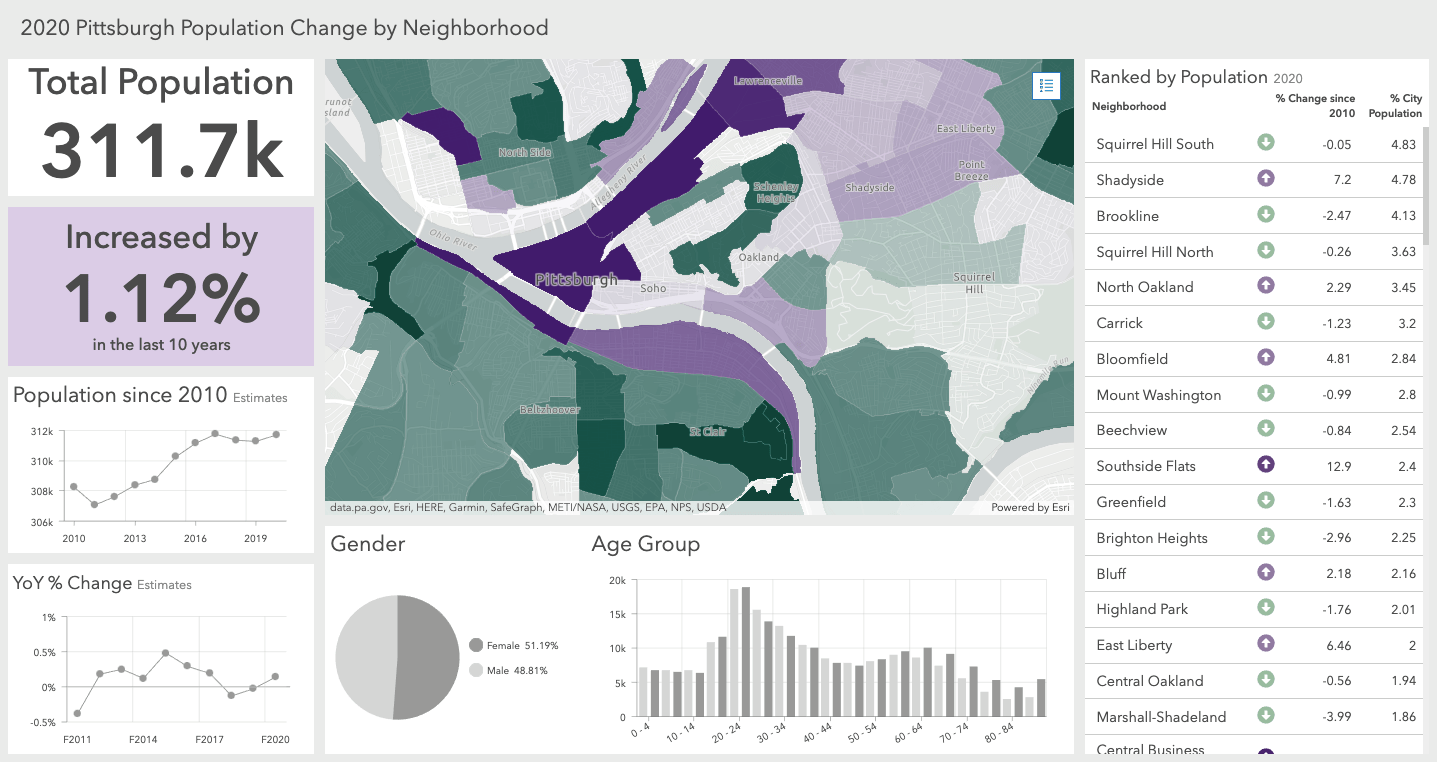
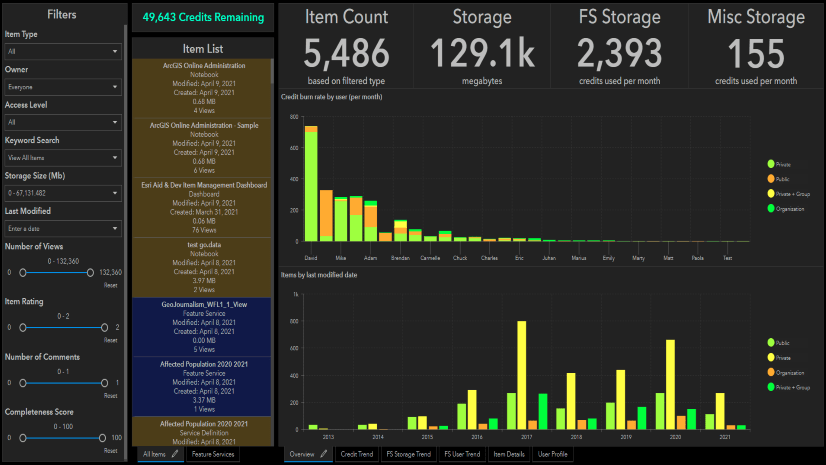
Snapshot Dashboard

As always, we get interest from users not only around UC but throughout the year requesting examples and resources they can draw inspiration from. Regardless of whether you are starting from scratch or looking to take your dashboard to the next level, you are in the right place. Here is a list of frequently requested information and up-to-date resources, all in one place.
Introduction
Q: I’m new to ArcGIS Dashboards. Where do I start?
A: Learn what a dashboard is and all the essentials in this doc.
Q: Are there any tutorials or lessons that cover dashboard concepts and best practices?
A: Here is an introductory video (25 min) covering the basic tips and tricks for designing and configuring a dashboard. Additionally, there are two Dashboards learning paths available:
1. Visualize data with Arcade in dashboards
Arcade in Dashboards
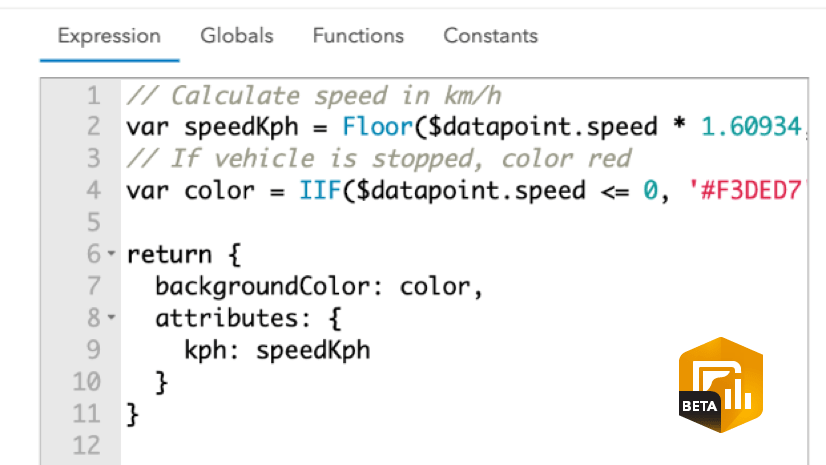
Q: What expression language do I need to write advanced formatting and data expressions?
A: Advanced formatting and data expressions are both written using the Arcade expression language. Get started with Arcade in ArcGIS Dashboards for advanced formatting in this blog. Learn how to stretch Arcade functions even further through dashboard’s data expressions in this blog. Additionally, check out these short clips for advanced formatting (6 min) and data expressions (7 min) for a quick overview. Optionally, follow along in this 1-hour workshop recording with example use-case from the 2021 Developer Summit.
Q: What are some best practices for creating data expressions?
A: Understand best practices for writing effective data expressions in this doc.
Q: Do you have other dashboard or data expressions examples using advanced formatting or data expressions?
A: Get started by taking a look at a few sample data expressions here. Additionally, create a copy of a few of our latest dashboard samples from the 2021 User Conference: Designing Effective Dashboards, and the 2021 Developer Summit to see how else you can leverage data expressions.
How-Tos
Q: Visualizing how much time has elapsed in a real-time operations dashboard
A: Learn how you can calculate and display time spans using Arcade formatting expressions in this blog.
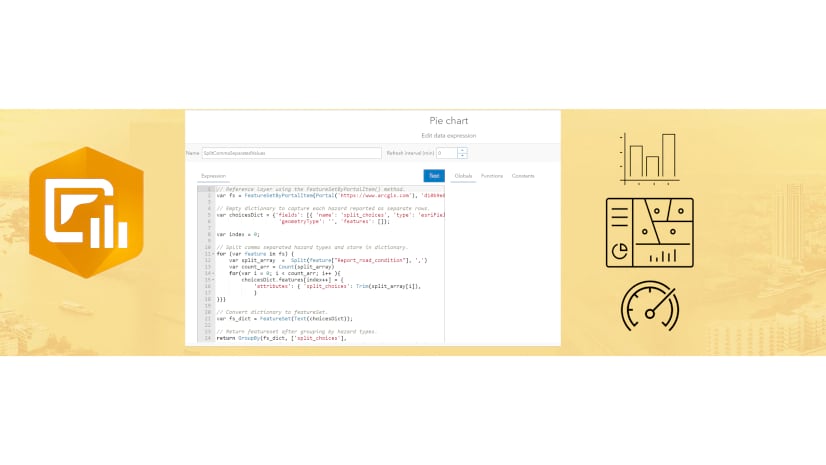
Q: Using Survey123 data that contain multiple selection fields
A: This blog demonstrates how you can leverage data expressions to optimize Survey123 results for your pie and serial chart elements. Optionally, you can reference the sample expression on Github.
Q: Combining data from multiple layers for my dashboard element
A: Learn how to power a dashboard element using multiple layers in this blog. Here is a sample expression for reference.
Q: Aggregating rows based on a category for a list
A: Learn how you can restructure your data to optimize it for configuring a list element in this blog.
Q: Adding a progress bar or indicator to my list item
A: View how you can add visual indicators, backed by data, in this dashboard sample.
Mobile & Scalable Dashboards
Q: Can I view dashboards on mobile devices such as a tablet or phone?
A: You can view dashboards on any device; however you cannot author dashboards from mobile devices. Learn how to design dashboards for mobile devices in this doc.
Q: How can I design scalable dashboards?
A: Follow best practices for designing high-traffic and viral dashboards in this doc.
For a comprehensive and up-to-date list of all dashboards, check out and bookmark this Esri community post.
Thanks again for attending this year’s User Conference and participating in the ArcGIS Dashboards session. I hope that these resources can help you navigate the world of dashboards regardless of your experience level and background.
As always, we love to see and hear about your dashboards and their impacts! Please share your dashboards with us on Twitter or LinkedIn using #ArcGISDashboards!


Article Discussion: