Updated January 17h, 2023: A new comment was added to ‘Feature Service Tracking’ portion of the sample notebook with a known limitation, where credit consumption does not accurately account for FS attachments, resulting in higher than expected credit consumption estimates.
Updated December 8th, 2022: The sample notebook has been updated to work with November 2022 Update of ArcGIS Online. Thank you Esri Canada for recommending the fix!
Updated August 11th, 2021: The notebook code was updated to work with large ArcGIS Online organizations with tens of thousands of items.
ArcGIS Online is a simple yet powerful system to connect people, locations, and data using interactive maps. There are literally millions of items stored in ArcGIS Online with tens of thousands of new items created each day. All of this activity, however, comes with its share of challenges. How can organizations manage all this content effectively? How can you reduce storage costs and identify data and apps that are no longer needed?
ArcGIS Online provides a number of tools for administrators to help you manage your organization, such as credit budgeting, the credit utilization chart, and reports. Using the ArcGIS API for Python, we can get even more information about the items in our organization. In this blog, we’ll explore how you can use ArcGIS Dashboards and scheduled ArcGIS Notebooks to create an interactive tool to help manage content in ArcGIS Online, and we’ll provide templates and instructions for deploying them in your own organization.
Anatomy of the dashboard
Let’s start by looking at the end product – the Item Management Dashboard (Live Version). The dashboard consists of three main sections: Filters, List, and Details.
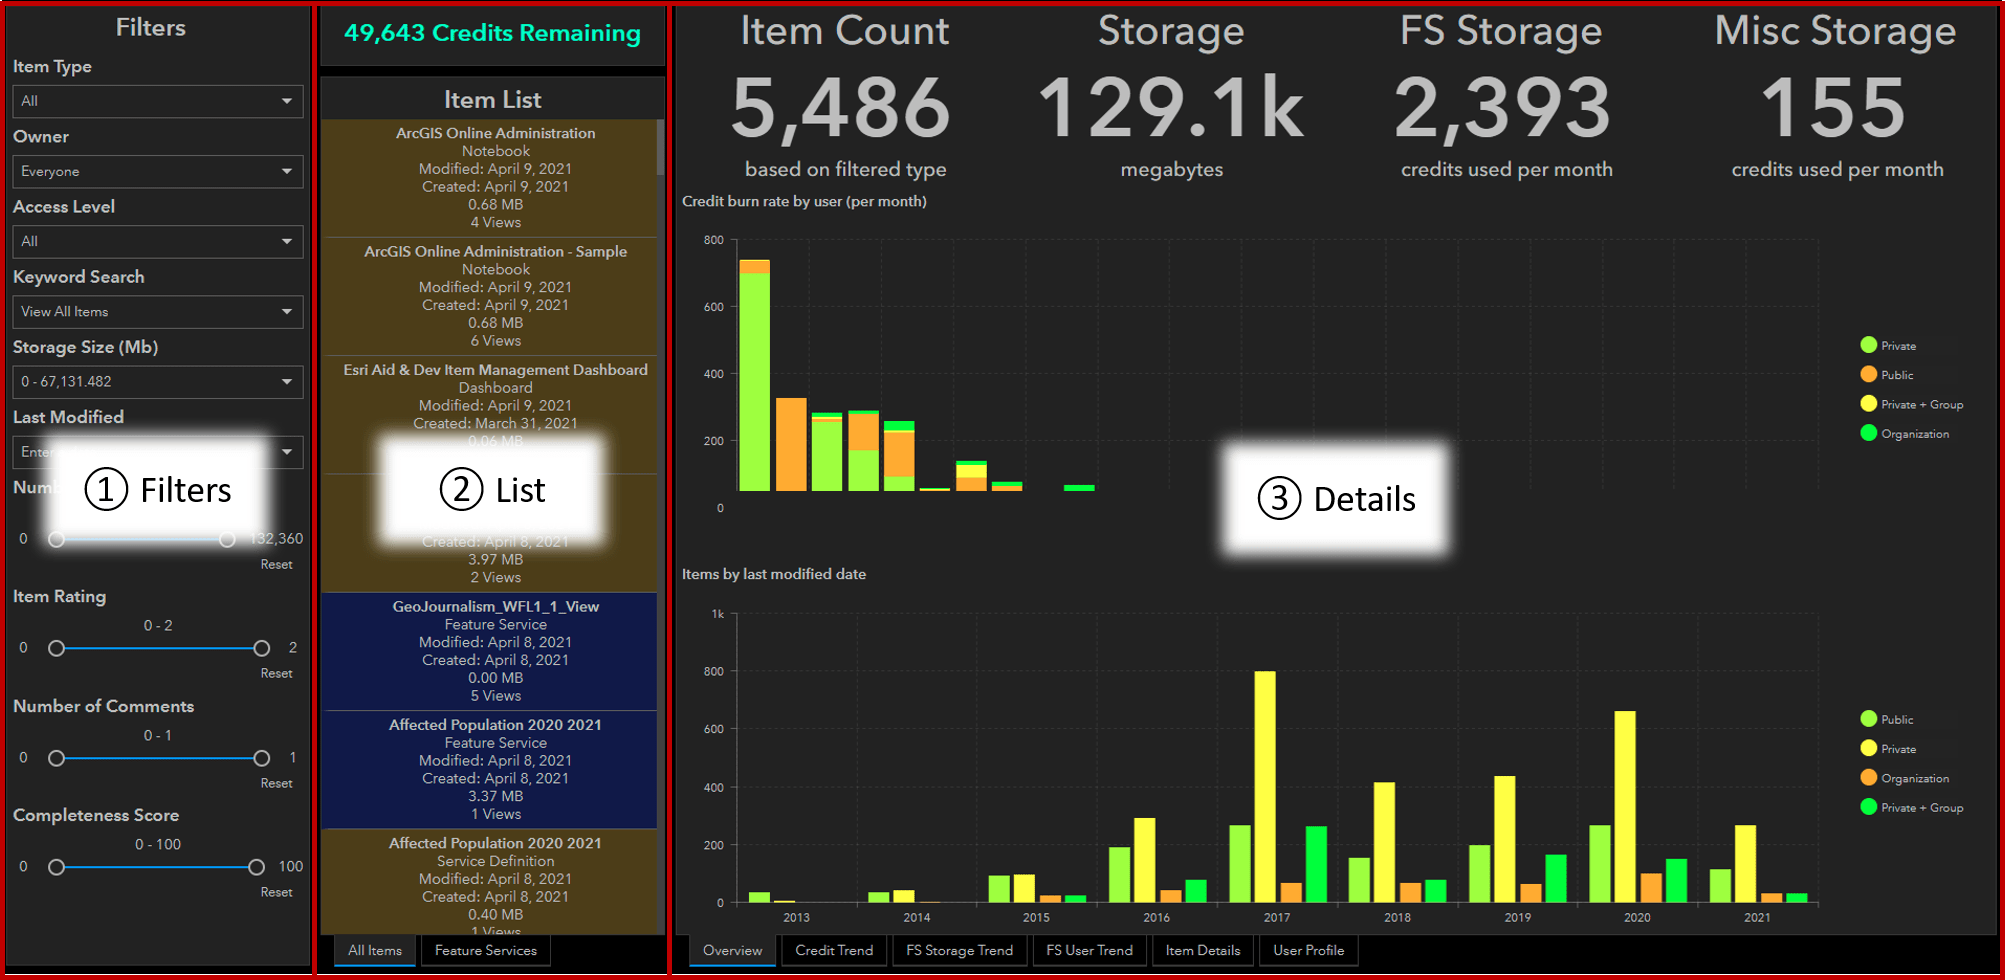
1. The Filters section gives you access to a rich set of variables for filtering content. The available filters are as follows:
- Item Type: There are dozens of item types supported in ArcGIS. Examples include web maps, feature services (FS), and various apps. You can see the full list of supported item types available in ArcGIS Items and item types topic in the ArcGIS REST API help.
- Owner: This filter will be populated with the names of users in your organization who own at least one item.
- Access Level: Item can be shared at various levels in ArcGIS Online. This filter has five options based on different sharing levels:
– All: All content regardless of sharing setting
– Private: Items that are not shared and private to the user
– Shared: Private items that are shared to a group
– Organization: Items shared to the organization
– Public: Item shared to the public for anonymous access
- Keyword Search: Many users often put words like ”test” or ”sample” in the item title or tag as a reminder that the item eventually needs to be deleted. Unfortunately, this does not always happen, and an organization can end up with lots of these items. You can define keywords to search in the title and the tag, and the filter allows you to view items with or without the presence of the keywords. You can filter by the following:
– View All Items: Items with or without the presence of user-defined words
– With Keywords: Items with the user-defined words in the title or the tag
– Without Keywords: Items without the user-defined words in the title or the tag
- Storage Size: I have seen Pareto’s 80/20 rule plays out in ArcGIS Online organizations – 80 percent of storage use results from 20 percent of items. This filter will find items that are using the most storage.
- Last Modified: Content that has been recently modified is a good proxy for content that is relevant and current. This filter allows you to find items that may be outdated and candidates for deletion.
- Number of Views, Item Rating, Number of Comments: Views, rating, and comments serve as indicators of an item’s popularity. This set of filters combined with other filters like Last Modified can be a powerful way to prioritize content for deprecation.
- Completeness Score: An item’s completeness score is based on how much of the item’s metadata, like snippet, thumbnail, description, title, and tags, is populated. This filter makes the job of enforcing a metadata standard in an organization easier by helping the admin quickly identify items with low a completeness score.
2. The List section shows the list of items in an organization based on the filters. This list is sorted by the last modified date in descending order.
3. The Details section provides additional contextual and trend information for the items, credit consumption, and users. The section is divided into the following:
- Overview provides a high-level summary including the item count, storage used, credits consumed by feature services, and credits consumed by other storage. There is also a chart of credit usage rate by user per month split by the item’s access level and another chart on items based on the last modified date.

- Credit Trend shows the historical trend of remaining available credits in the organization. There is a guideline to indicate the level at which the organization might need to procure additional credits.

- FS Storage Trend shows the amount of storage used by feature services in megabytes (MB). The threshold line represents the point at which it would be more cost-effective to purchase the ArcGIS Premium Feature Data Store, which provides a fixed cost for feature storage and performance boost.

- FS User Trend shows the amount of credits consumed per month per user from feature services. This chart is helpful in identifying sudden spikes or drops in credit consumption. The chart is configured to show active users who have signed in to the system in the last 30 days. If configured this way, please be mindful that there is a potential to overlook high-consuming users who happen to be inactive.

- Item Details allows you to view and interact with the item details page in ArcGIS Online. This allows the user to perform administration activities without leaving the dashboard environment.
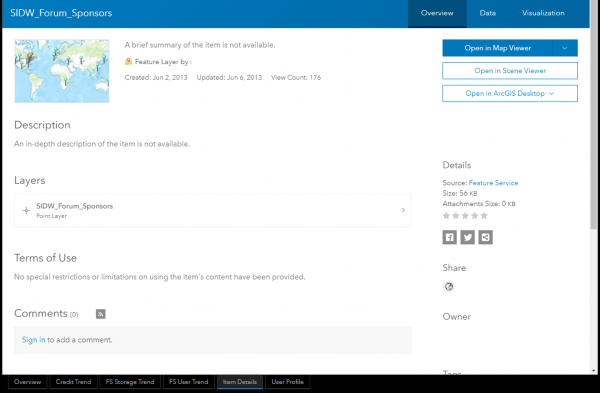
- User Profile allows you to view the item owner’s profile in ArcGIS Online. Again, the idea is to make the dashboard a one-stop location for your content management needs.

Potential use cases
After exploring and getting familiar with the dashboard (Live Version), you might think of different applications for your own administrative workflows. Based on feedback and conversations with a number of organizations, here is a summary of the needs that can be addressed by the dashboard:
- Interactively explore items within an ArcGIS Online organization through filters.
- Identify users with the highest credit use based on feature service storage.
- Identify users with a sudden spike in feature service storage.
- Enforce a metadata standard for ArcGIS Online items.
- Identify items that have not been modified recently.
- Keep track of remaining credits in the organization.
- Edit or delete items within the dashboard.
How does this work?
While the dashboard is great for exploring the data, the engine driving this dashboard comes from a scheduled ArcGIS Notebook hosted in ArcGIS Online. This notebook, which is scheduled to run once a day, automates the process of extracting relevant information about each item using the ArcGIS API for Python to update hosted tables that feed the dashboard. These hosted tables will store data about the items (table_items), feature services (table_fs), and users (table_user )in the organization like title, last modified date, size, and more.

Want this for your organization? The next section discusses how you can deploy this dashboard.
Deploying
The deployment process is simple, but make sure to dedicate at least 30 to 60 minutes for it. The steps below assume that you are an administrator of your organization.
1. Publish three hosted tables.
Navigate to Content > Create > Feature Layer > From URL to create the hosted tables with the following URLs: table_item, table_fs, table_user. Once published, take a note of the item ID. You will need this for step 3.
Note: if you are unable to publish the tables from the service, please follow the instructions to manually publish with CSVs.
2. Add the notebook file to ArcGIS Online.
Download and upload the notebook file to ArcGIS Online. This will create a hosted notebook that will update the hosted tables created from the previous step. Navigate to the notebook settings and set Notebook Runtime to ‘ArcGIS Notebook Python 3 Standard – 4.0’ or above. Do not run the file until you define user inputs (next step).

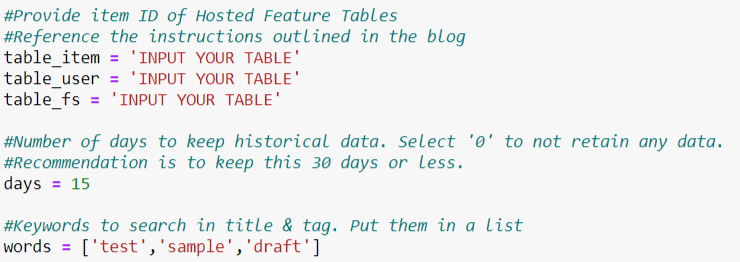
3. Define user inputs.
The most important part is to correctly define the item ID of each hosted table. You can optionally adjust the variable days, which defines the length of historical data you will keep for trend charts like storage, remaining credits, and credit use per user. You can also define the words to search in the title and the tag.
4. Schedule and run the notebook.
Use the new scheduling capability released in the Spring 2021 update to automate the notebook processing. You can follow instructions in Scheduled Mode for ArcGIS Notebooks in ArcGIS Online blog.
5. Configure the dashboard.
You can view the dashboard or create a copy to see how they are configured. Make sure to sign into your ArcGIS Online account to save a copy to your account. It will be helpful to create two copies—one for reference and another for configuration.
There are two options to configure the copied dashboard with your hosted tables. You can take the traditional route and manually configure each element in the dashboard. This will give you a better sense of how the dashboard is configured but will be slow. The other option is to edit the Dashboard’s JSON configuration using ArcGIS Assistant as outlined in this post. This will be much quicker but be advised that mistakes during the edit can permanently break your dashboard.
If you choose to edit the Dashboard’s JSON configuration, you will need to replace the item IDs of the sample tables with item IDs of hosted tables published to your organization. Search and replace the item IDs of the sample tables as shown below.
- item_details_sample: 6f88e47d29f142f1a2948e85a002e26d
- fl_details_sample: 9719cfac02a245eebf6125a3ae5b6e44
6. Manage your organization.
You are now ready to manage your organization.
Closing thoughts
This is just the beginning of using ArcGIS Notebooks, the ArcGIS API for Python, and ArcGIS Dashboards to create a tailored experience of managing your organization. If you are new to managing an organization, we recommend starting with the robust set of tools already available in ArcGIS Online. But if you are managing a large, complex organizations ArcGIS API for Python and ArcGIS Notebooks can be helpful tools to facilitate your administrative tasks.


Great stuff! We built a very similar dashboard and process for my company. We even made a StoryMap about it (Link below) . Dashboards are such a powerful tool that it can be used for non-spatial solutions as well.
Make an Item Report Dashboard (Public StoryMap): https://storymaps.arcgis.com/stories/136db4d3aaa84151be594b496f423a52
I am trying to implement this for my Org. I have followed along up until the configuration of the dashboard – step 5. How do I change the dashboard over to my own set of tables? Is it best to edit the json of the dashboard and replace the sample item id’s with my set?
Also – to get the notebook to work – I had to comment out availble credits and assigned credits from the User Admin section of the notebook. Is this configured assuming we have turned on credit budgeting for the users – and if we haven’t is this why the notebook errors out?
Ideally, I don’t want to have to edit each element of the dashboard. I have in the past edited JSON to change out item id for a map – and had the dashboard mostly work – Is that what is intended for step 5 here?
5. Configure the dashboard.
You can view the dashboard or create a copy to see how they are configured. Make sure to sign into your ArcGIS Online account to save a copy to your account. It will be helpful to create two copies—one for reference and another for configuration.
This is really useful – thank you.
Having set it up it up for our organisation’s account I’ve noticed a possible issue with the ‘FS Storage’ counter (and maybe some of the total credit measures used in other bits of the dashboard). The total number credits per month given in the FS Storage counter is much higher (almost 2x) than our total monthly credits usage as given by the ‘Overview’ tab in the ‘Organisation’ section of ArcGIS Online (which I’d consider to be the correct/definitive figure).
Having had a bit of a search around, I’m wondering if it’s because the calculation used to generate the feature service credit use is based on multiplying the total size of the feature service by the feature credit rate (i.e. 2.4 credits per 10MB stored per month). That’s opposed to multiplying the size of the feature data by that rate and any storage of attachments in the service by the appropriate rate for those (which I think from the ‘Understanding credits’ page is the much lower 1.2 credits per GB stored per month?). A lot of our services have a large number of attachments and this seems to be pushing the total credit usage to a much higher number than I think they really are.
I don’t know if others have found this and if my suggestion of a possible cause sounds plausible? If so, is there a way these two could be split out and calculated correctly?
Hi Colin, thank you for the note.
You are correct on the limitation. Attachments on fs storage is calculated differently, but the script currently does not account for that. When this script was originally developed, I didn’t take into account for your scenario. Having said that, this will be a useful note to share with the community so we understand the limitation. I will make sure to put this in.
There should be a way to do this in the script (AGOL does it after all :)) If you (or anyone in the community) develop an enhancement for this – please share and I’d be happy to incorporate it into the sample notebook!
The notebook populates three tables:
But the instructions for updating the dashboard only requires changing the IDs for two of the tables. The user table does not appear to be used by the Dashboard. Is that correct?
Bonnie and Calvin: this is an excellent article! I am working on applying it for my organization. There is no longer an option to choose ArcGIS Notebook Python 3 Standard – 4.0. Instead, I can choose between 7.0 and 10.0. What would be causing that? @Calvin Kwon
I’m trying to implement this for my organisation and when running the notebook for the first (and subsequent) times, I get the following error :
I run this on ArcGIS Notebook Python 3 Standard – 11.0.
I have this same error. Any insight on resolving?
Hey folks, I would recommend creating your own hosted table. When linking to the hosted table there seems to be some permission issues. Once I create an empty hosted table in my environment the script worked.
Excellent article! Exactly the item management solution we were looking for for our open data portal.
Another issue I noticed is the following:
# The below statement throws an error message: object of type ‘generator’ has no len()
#Count the number of items owned by each user
#item_count = len(user.items(max_items = 1000)) #Max_item is defaulted to 100
# Nov 24th, 2025
# Fix for object of type ‘generator’ has no len()
generator_object = user.items(max_items = 1000)
list_of_items = list(generator_object)
item_count = len(list_of_items)
Not sure if anyone else experienced this.
FYI, the bytes to MB conversion step using the wrong conversion factor.
#Then convert size in bytes to megabytes, format to six decimal places & update
size_mb = int(row[‘size’])/1000000
1000000 should be replaced with (1024 * 1024) for a correct conversion to MB. You’ll see a difference in at item’s size in the dashboard vs the AGOL interface, otherwise.
Can this conversion rate be confirmed please?
I have tried both and definitely converting using value/(1024*1024) produces values that are a lot closer to the values output using the AGOL Reporting tools but it would be great if it could be confirmed, thanks.