Dashboards are often used to monitor situations or events and use the real-time information provided to make decisions. The time component of an event can sometimes be a defining factor of what decisions are made. A timestamp is useful for showing when something occurred – but when it comes to showing elapsed time, it’s not the easiest or quickest solution. If you have a line item in a list displaying the time an incident came in, you’re getting only one half of the information you need. Showing elapsed time is useful for communicating things like:
- How long ago an event occurred.
- How long it took to complete a task.
- Which events are new.
- Which requests have been open for more than 3 days.
Using an Arcade expression, we can answer these questions by calculating time spans and display them on a list element or indicator element. Let’s look at an example dashboard with this technique being used.

This dashboard is being used to monitor emergency calls as they come in and their status (active and cleared). The list on the left shows open incidents and the time that has elapsed since they were opened while the list on the right shows cleared incidents and how long each one took to clear (the response time).
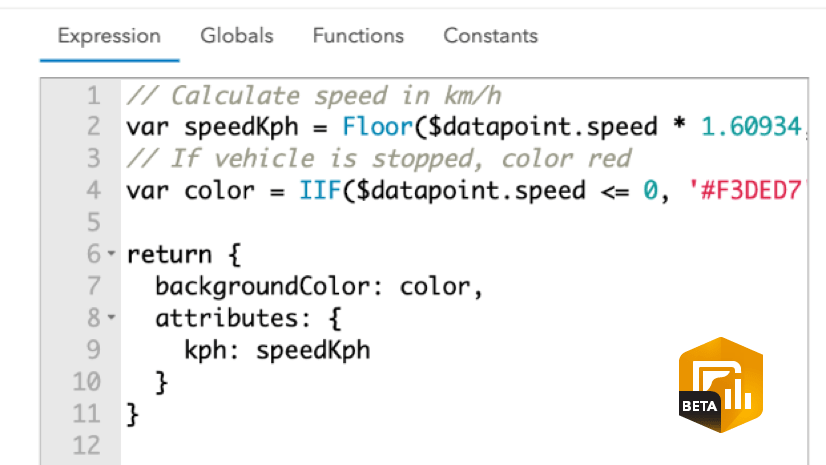
This elapsed time information is not a field in the dataset but rather a calculation in an Arcade expression with a little bit of formatting. Here’s how it was done.
Calculating time spans
There are two time span calculations, one in each list. The first calculates how long it has been since an incident has been opened while the other calculates how long it took between being opened to being marked as cleared.
The following expression calculates how many seconds the incident has been opened.
var dateOpened = $datapoint["Incident_Date"];

var currentTime = Now();

var secondsOpen = DateDiff(currentTime, dateOpened, 'seconds');
In the expression, we’re taking the field that has the date and time the incident was opened (dateOpened) and doing a date difference calculation between when it was opened and the current time (Now()) to get the difference in seconds.
Tip: Since this expression for elapsed time takes in the current time (Now()), it’s a good idea to enable a script refresh to update the expression at the set interval, independent of the layer’s refresh interval.
The next expression calculates how many seconds passed between when the incident was opened to when it was cleared.
var dateOpened = $datapoint["Incident_Date"];

var dateCleared = $datapoint["Call_Cleared_Date"];

var secondsToRespond = DateDiff(dateCleared, dateOpened, 'seconds');
This time, instead of taking the difference between when the incident was opened (dateOpened) and the current time, we’re taking the difference between when the incident was opened and when it was cleared (dateCleared).
Format your time span
Now that we have the time spans calculated we want to format them to be easier to read – 32688 seconds is not really a useful measure. We can format the seconds to read either using common short hands (1d, 1h, 1m, 1s), in a clock format (hh:mm:ss), or any other way you can think of.
The following function can be added to the Arcade expressions above to format your time span (remember to put your function before the rest of your expression).
In the function, we’re declaring a few things. The first, if no type is specified, default to type 1 (short-hand). Second, we’re saying that if numSeconds is a negative number, turn it positive. Lastly, we are specifying the two formats (type 1 and type 2), so that we can choose the format when we call the function.
After you’ve added the function, you can call it using the elapsed time we calculated before (secondsOpen or secondsToRespond) along with the formatting type and assign the result to a new variable.
var timeFormatted = formatElapsedTime(secondsOpen, 1) or
var timeFormatted = formatElapsedTime(secondsToRespond, 2)
Your final expression will look like the following:
We can now take this attribute and reference it in the Line Item Template below for each list using the syntax {expression/timeFormatted}.
Summary
Using Arcade expressions, we were able to calculate two different time spans, how long ago an incident occurred and how long it took to respond. We were also able to format these time spans to make the information easier to understand. Seeing the elapsed time of events at a glance can help make more informed decisions – especially for events that are time sensitive. In emergency management, conveying information efficiently is crucial because every second counts.
Open this dashboard to see this technique in use or make a copy to see the Arcade expressions and configurations used. As always, we love to see how you leverage Arcade expressions in your own dashboards. If you can, share your innovative dashboards with #ArcGISDashboards


this time display/calculation is exactly what I need, but I need it in an internal ArcGIS Portal.
How can I make that happen?
Hi Eric,
Happy to hear that this is a workflow that you’re interested in using.
Arcade support is only available in ArcGIS Dashboards Beta which is only available in ArcGIS Online.
When the beta phase is over, this new feature of ArcGIS Dashboards will be made available in the subsequent version of ArcGIS Enterprise.
Is there a way to do this in the old version? I suppose I’ll have to do all my math in the SQL tables?
In this dashboard example, would there be a way to show the average time passed between when incidents were opened to when they were cleared without having/using a dedicated field (Response_Started_To_Arrival_Time) that holds that information?