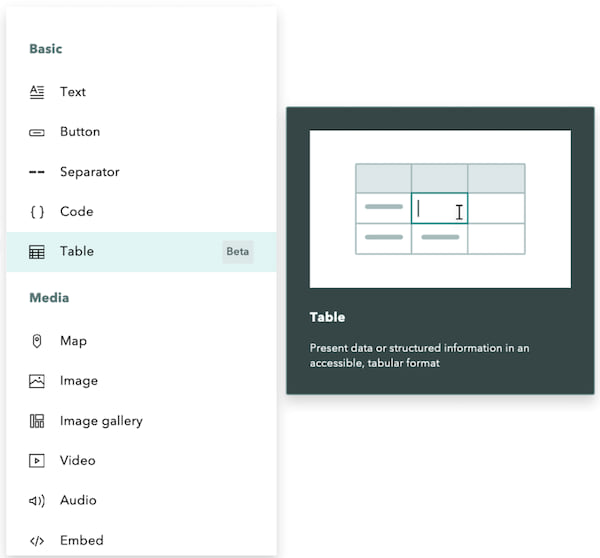
ArcGIS StoryMaps continues to empower creators by adding innovative tools and product features into the landscape of data visualization and spatial storytelling. Many of you asked for a block to add tables into your story, and you’re in luck! In August we introduced the table block feature. This block opens a new realm of possibilities for enhancing narratives and elevating data-driven insights. The table block in ArcGIS StoryMaps allows storytellers to integrate tabular data into their narratives seamlessly. Whether you’re an educator, journalist, researcher, or a passionate storyteller, this feature serves as a dynamic bridge between textual content and data visualization.
Adding a table to your story is helpful for several reasons. Tables add a structured format to present your data in an organized manner, enriching the reader’s understanding to showcase trends, patterns, and correlations within your data. They allow storytellers to present data in an organized way that is accessible to screen readers. And they are also great tools for presenting side-by-side comparisons.
Here are some best practices to consider when using the table block:
Purposeful data selection
Choose data that is relevant and supports the narrative of your story. Don’t overwhelm your audience with excessive data points; focus on the most essential information that enhances your story’s message.
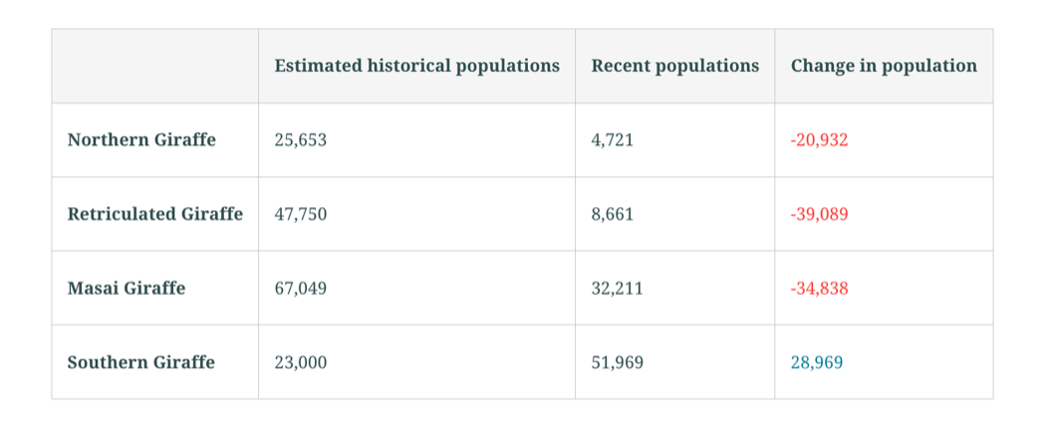
In the Surprising State of Africa’s Giraffes, the author added a table to display important and relevant data on population change of different Giraffe classifications. You are also able to change the color of the text to communicate insights from the data (in this case, decreased population). This formatting allows your audience to compare changes in data at a glance to support your narrative.
Sorting and aligning data
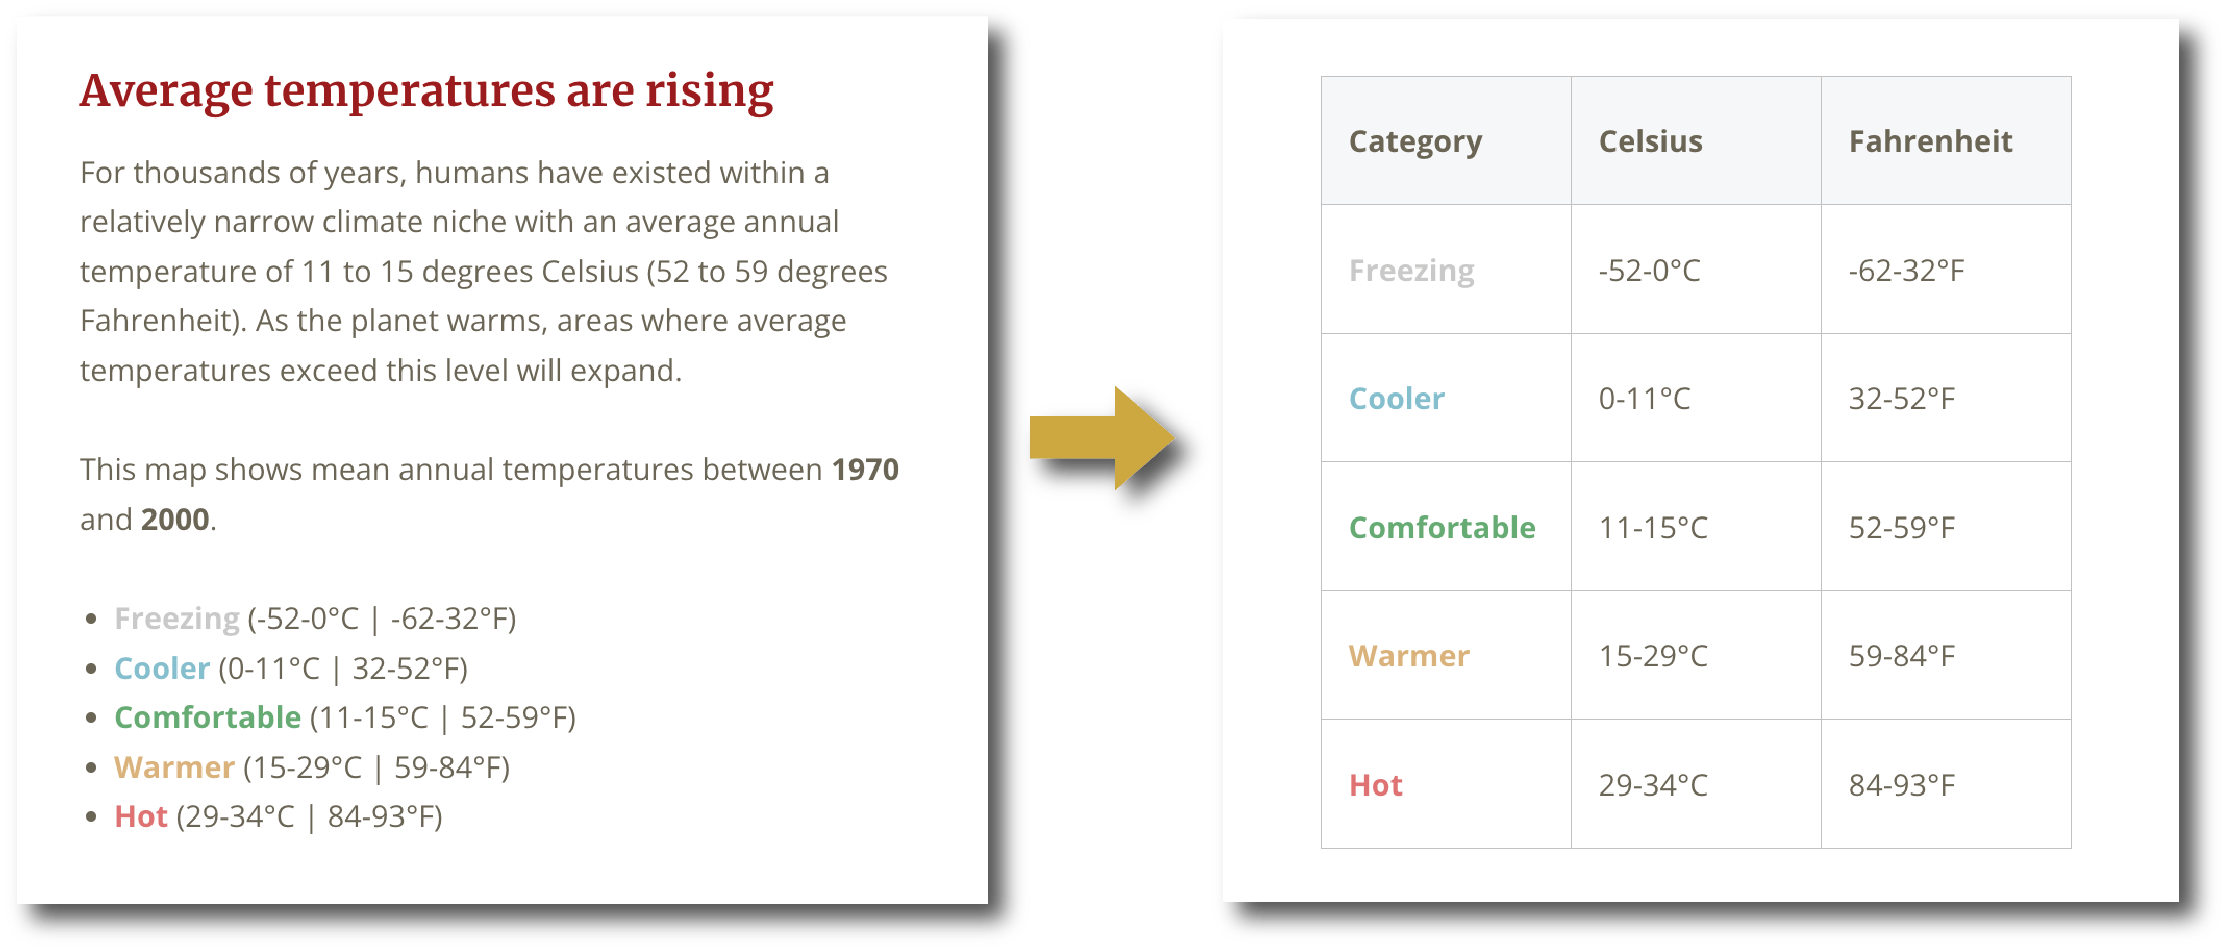
By sorting and aligning your data in a table, you allow readers to quickly find the information they’re interested in. Like in Climate Migrants: Extreme Heat, there’s historical annual temperature data shared in a list and using color codes assigned to a category. Here, we’ve taken the previous formatting of the traditional data and turned it into a table to align the data a bit more.
Formatting and styling support accessibility
Tables allow you to format data to make your story more visually appealing as well as more accessible. By adjusting fonts, colors, and text alignment, you can match the overall aesthetics of your story. Also, tables ensure you are including screen readers, many of which aren’t equipped to read text that’s contained within an image or infographic.
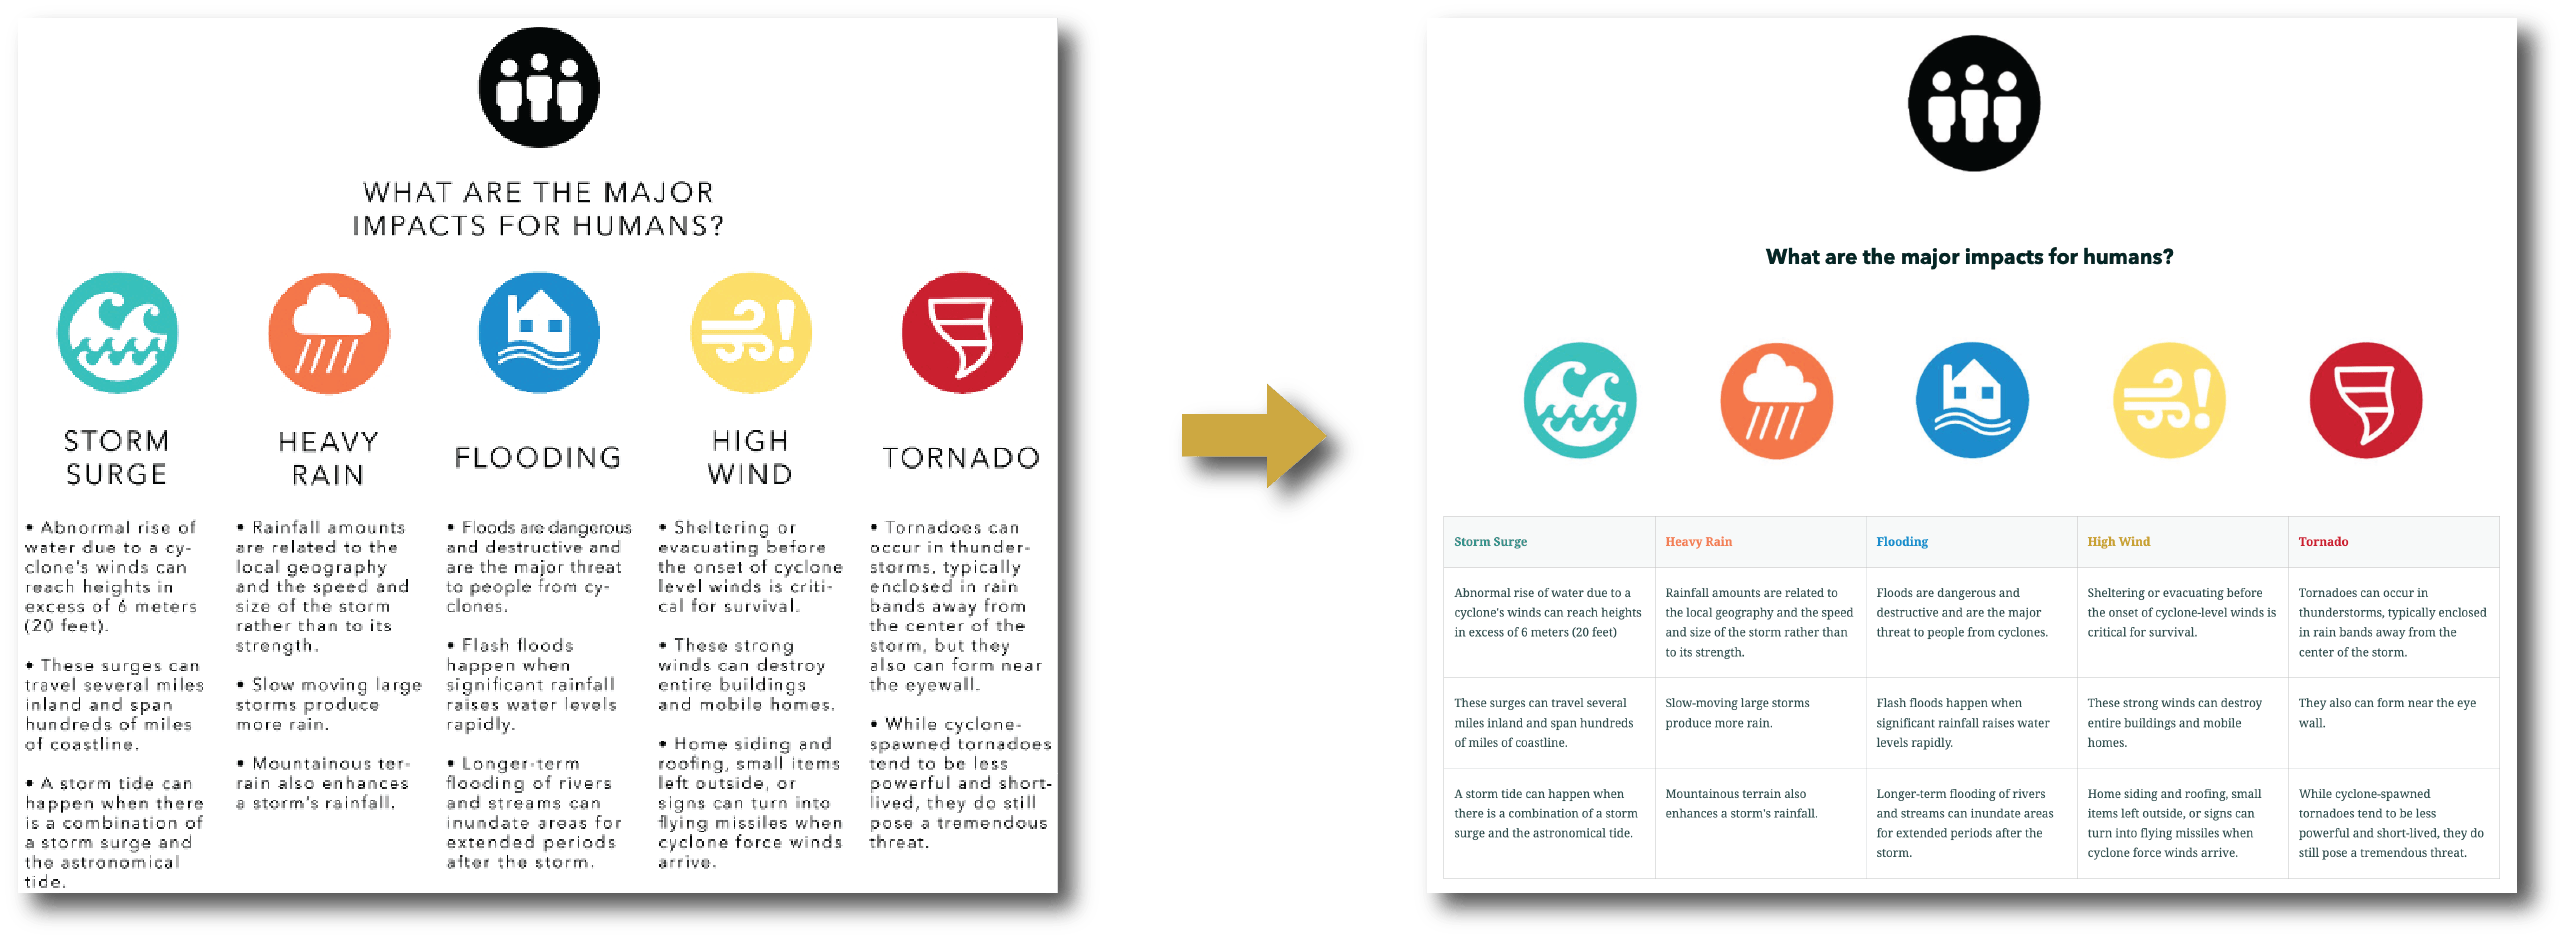
In the story Earth’s Biggest Storms: Tropical Cyclones, we profile the major impacts these storms have on humans. We used the table block to organize information in rows and columns about each impact, converting a graphic about significant impacts on humans formatted like a table into a StoryMaps table. The result is a clear breakdown of the most important information that remains legible across devices (mobile or desktop) and will be recognized by a screen reader.
The table block is another enhancement meant to bridge gaps when using data for storytelling. It lets creators seamlessly integrate tabular data, unveiling insights in a more structured and engaging way. From giraffe population shifts to extreme heat impacts, this feature empowers storytellers to craft dynamic narratives that captivate and inform and we’re excited to see what you’ll create.


Article Discussion: