ArcGIS StoryMaps is the professional storytelling tool that enables you to transform your geographic work into interactive content to inform and inspire others. It makes it easy to explain complex topics related to your knowledge and experience. ArcGIS StoryMaps is updated regularly with new features and capabilities, and here’s what’s been added recently:
Gallery updates
Have you visited the ArcGIS StoryMaps gallery? It’s a great place to go to see fantastic examples of storytelling at its finest. The gallery contains many great stories and collections created by our own StoryMaps editorial team and many others in the storytelling community.
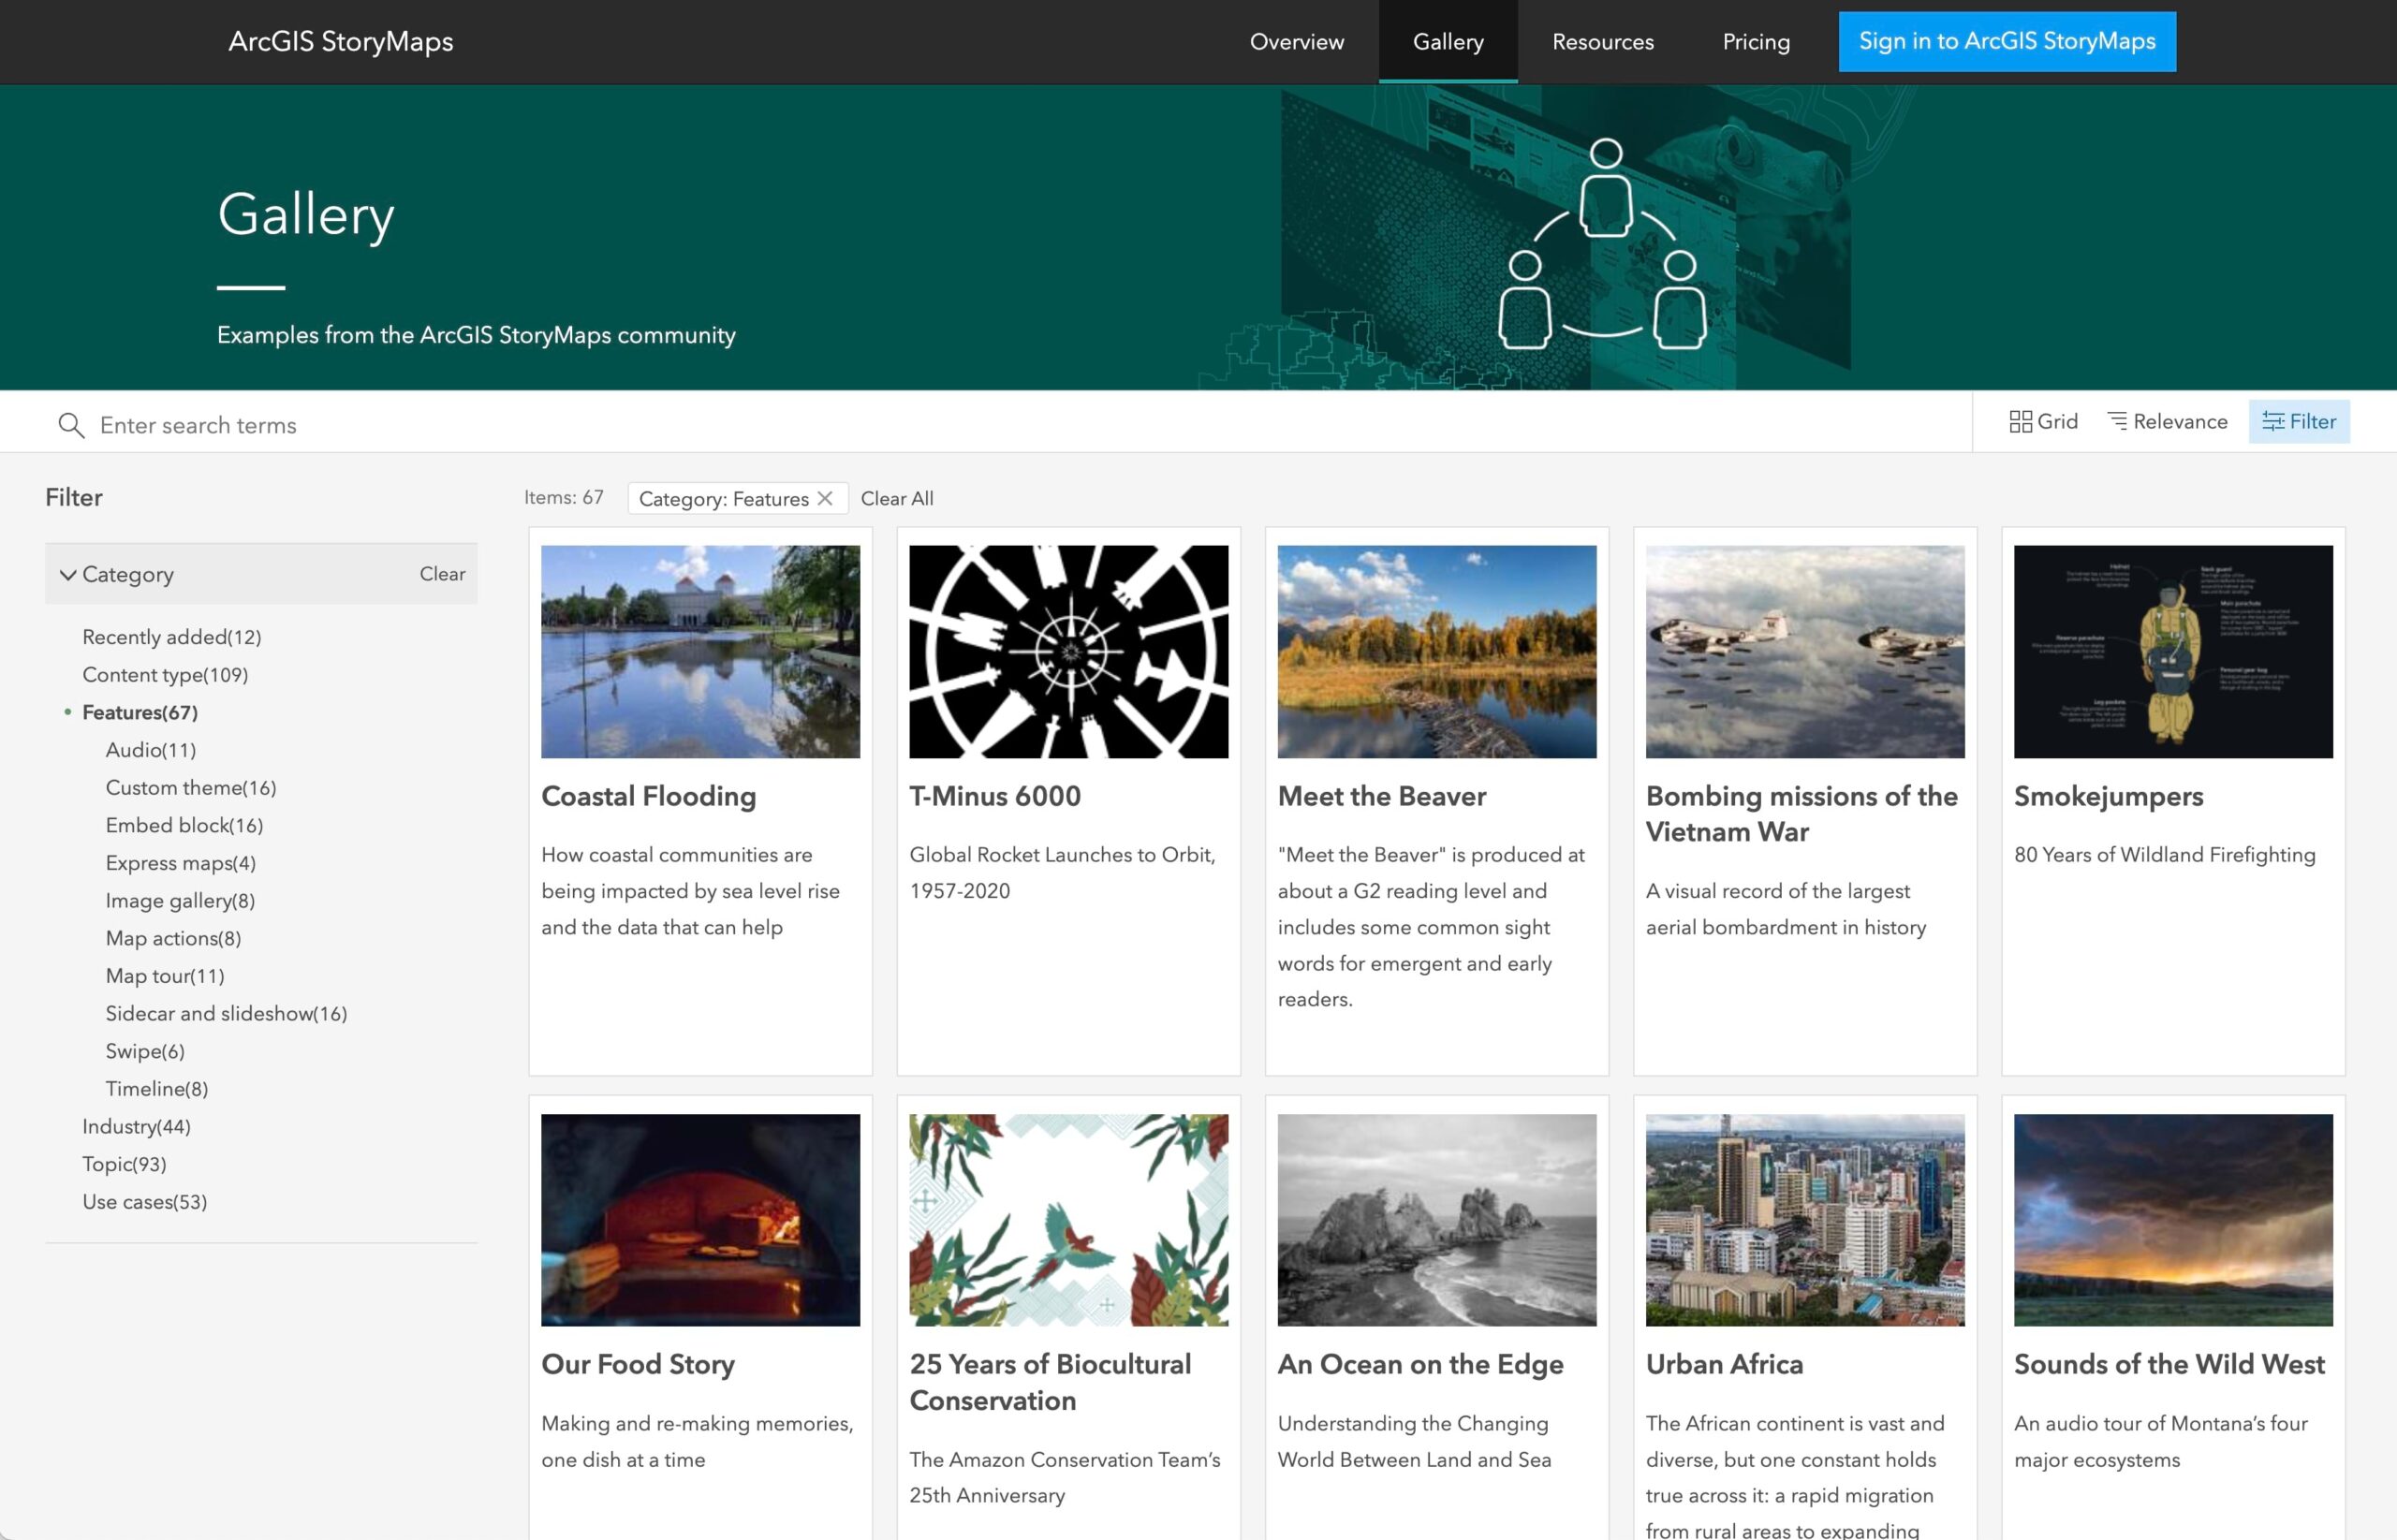
Now, when perusing the gallery you can easily find stories that use a particular feature like audio, a map tour, or the timeline block, to name a few. Or you can focus on specific use cases like 3D mapping, crowdsourcing, instructional storytelling, and many others. There’s also a new “recently added” filter so you can quickly find the latest examples added to the gallery.
To access these, just go to the gallery, click Filters at the top right, and then expand Categories in the left sidebar to reveal the available options.

Featured themes
Themes are a great way to make a statement with your stories and collections. ArcGIS StoryMaps offers several useful basic theme options, and of course you can design your own themes to match your story’s tone or your organization’s branding. Maybe you aren’t the creative type? That’s ok! Others in your organization can create and share themes for you to use.
Since themes are such an important part of storytelling, we’ve added another easy way for you to utilize them: featured themes!
ArcGIS StoryMaps now contains a gallery of professionally designed themes that you can use for your own stories. They are perfect when you want a little more punch than one of the basic options. If you see one you like be sure to favorite it.
We’ll periodically add new featured themes to the gallery based on upcoming holidays, seasons, or events. For example, there’s a large conference for GIS professionals that takes place in San Diego you might be aware of that might get a theme soon…
We hope seeing more examples of great themes will inspire you to create your own! To learn more, check out these Tips on Using the ArcGIS StoryMaps Theme Builder and this tutorial.
New text editing capabilities
Writing the narrative is an essential part of every story, so we know authors spend a lot of type typing and formatting text. There are now several new capabilities of the text editor that provide you with more options for how to arrange and format text.
There is now a third heading style available. This provides the opportunity to have one more level of hierarchy or organization for the content in your story. You can copy and use links to these headings just like the other heading levels. For instructions on how to do this, see Add Another Dimension to Your Stories with Heading Links.
Speaking of headings, you can now also manually adjust the alignment of headings throughout your story. This includes headings that appear in sidecar narrative panels and even the credits heading.
Lastly, if information in your story needs to be updated, but you want to preserve the original text, you can now use the new strikethrough formatting option. Strikethrough formatting has been implemented in an accessible way so assistive devices will communicate the stricken text to anyone using a screen reader.
And more…
One small, but often-requested, feature that is now available is the ability to remove some of the elements from a collection overview page. This includes the “Collection” heading and the “Get started” button. These elements can be helpful in some cases, but they are not always useful and authors have asked for a way to remove them. You can now easily do this in the collection settings.
If you’ve never made a collection we think These ArcGIS StoryMaps Collections Will Inspire You to do so and then you can review this tutorial for instructions on how to get started. If you have dabbled in creating collections already, we invite you to learn how to Enhance Your ArcGIS StoryMaps Collections.
We’ve also added the statistical computing programming language R as an option in the code block. R is a popular language used by many GIS professionals, students, and…pirates(?). Now you can share your lovely formatted R scripts using the code block in your stories. For an example of the code block in action, see Spike Maps and Code Snippets.
For a complete list of changes and fixes, see the Release notes.
Banner photo by Monstera


Article Discussion: