This article was originally published in February 2021, and was updated in August 2025 to reflect new features and capabilities available in ArcGIS StoryMaps.
“Cite your sources!” is a mantra you most likely learned when writing that high school argumentative essay. Citations are essential for establishing credibility and transparency, and in some cases, are required for compliance with copyright law. It is industry-standard in science publications, policy briefs, research pieces, news articles, and even blog posts to list sources and references. So, how can you cite your sources responsibly and effectively in the stories and briefings you create with ArcGIS StoryMaps?
Fortunately, ArcGIS StoryMaps provides several different tools and workflows for adding citations and references. The approach you choose will largely depend on the following considerations:
- Your story’s audience. What are your readers’ expectations? Are they casual readers, or subject-matter experts who will want to explore your references?
- The type (or types) of content you are citing. Are you referencing peer-reviewed papers, specific policies or legislation, pieces of visual media, data sources, news articles, or something else entirely?
- The type of content you’re creating. Stories provide the greatest formatting flexibility when it comes to citations, but many of the techniques covered in this article can be implemented in briefings and collections as well.
- How much you want to highlight these sources. Do you want your readers to simply see and acknowledge the citation, or do you want to encourage them to navigate to the content you’re referencing and explore it themselves?
Citations in ArcGIS StoryMaps can be grouped into three different categories: inline citations, media references, bibliographies, and (in the case of stories) the credits section. We’ll break these down below.
Inline citations
Inline citations are great for providing readers with immediate context; they can see your sources without having to hunt through a list of references later in your story. News articles, and broader web content are easy to cite with links inline, commonly using hyperlinked text to direct readers to the original source. For accessibility purposes, it’s best to hyperlink meaningful text (e.g., “read the full report”) as opposed to ambiguous instructions (e.g., “click here”).
Inline citations can also be used to reference scientific papers (such as “Fordham, et al., 2013” as in this grand-prize winning story from the 2024 Storytelling with Maps competition submitted by the City of Tucson, Arizona). Whether you format your inline citations according to APA, MLA, or Chicago guidelines is up to you – but it’s a good idea to choose a consistent style, even if simplified, to maintain professionalism throughout your story.
 explain it this way:\" followed by a quote block.")
Embed cards and buttons
For more prominent inline citations, you can add embed cards and buttons. In this Living Atlas-authored story about ocean plastics, for example, we focus on one scientific paper and its findings. We included the peer-reviewed paper as an embed card to give it prominence within this section:

As author, you have full control over the title, description, and thumbnail of the embed card. Feel free to edit what appears by clicking Card Properties -> Card Details to make it look great within your story.
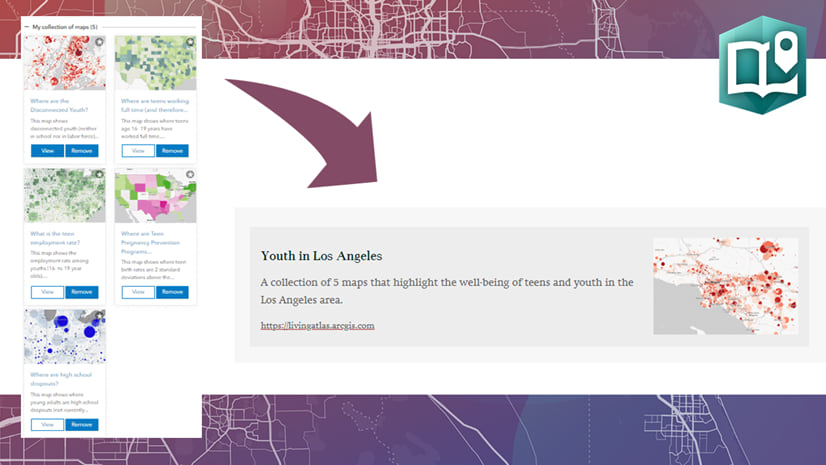
Occasionally, you may want to provide readers with additional material that is not covered or referenced in the story itself. If there are only a few additional resources, presenting them as embedded cards toward the end of your story is a nice touch. For example, this story on Women in National Politics closes with this:

Buttons provide a similarly high-visibility option for citing sources. Unlike embed cards, you can even add multiple buttons side-by-side to highlight multiple sources.

Numbered references
Inline citations are easy to create, but if your story contains a lot of references, they can distract from the narrative. This is where numbered references can help. Using text formatting, you can append numbered references to relevant text passages in your story, and then include a numbered list with all your references in a dedicated section at the end of your work.
It’s common practice in academic writing to use superscript text and brackets or parentheses to identify numbered citations. In the story builder, you can even add a hyperlink that will jump directly to a corresponding references or credits section.
![Researchers have found that PM 2.5 is harmful at any concentration, and that lowering thresholds even below 10 micrograms per cubic meter could save thousands of lives [9, 10]. The numbered references 9 and 10 are in superscript.](https://www.esri.com/arcgis-blog/app/uploads/2021/02/suberscript_example.png "Researchers have found that PM 2.5 is harmful at any concentration, and that lowering thresholds even below 10 micrograms per cubic meter could save thousands of lives [9, 10]. The numbered references 9 and 10 are in superscript.")
The credits section
The ArcGIS StoryMaps builder allows you to optionally display a dedicated, customizable credits section at the end of your story. This section allows you to add as many citations as you need, and is especially useful if your sources require specific citation formats (such as research papers).
By consolidating your citations and references in the credits section, you can streamline your narrative while also providing readers with a complete picture of all of the sources referenced throughout your story.
.")
The credits section is enabled in the Design panel of the story builder; once it’s visible, you can add your references one at a time, in your desired format. Links are a nice touch to aid those readers who do want to dig deeper into your sources. This story includes numbered citations inline, with a full list of sources in the credits section:
![[9] Di, Qian, et al. (2017). Association of short-term exposure to air pollution with mortality in older adults. Jama 318(24), 2446-2456. [10] Jbaily, Abdulrahman, et al. (2020). Inequalities in air pollution exposure are increasing in the United States. medRxiv, 2020.07.13.20152942.](https://www.esri.com/arcgis-blog/app/uploads/2021/02/scientific_example_credits_section.jpg "[9] Di, Qian, et al. (2017). Association of short-term exposure to air pollution with mortality in older adults. Jama 318(24), 2446-2456. [10] Jbaily, Abdulrahman, et al. (2020). Inequalities in air pollution exposure are increasing in the United States. medRxiv, 2020.07.13.20152942.")
With the Ocean Plastics story, we had lots of flexibility with respect to reference styles, and we wanted the titles of the works we were citing to be prominent, as well as the source. Using the credits section, we put the title with a link to the work on one side, and the source on the other:
![[2] Plastic Pollution Affects Sea Life Throughout the Ocean (with hyperlink), Pew. [3] Plastic waste inputs from land into the ocean (with hyperlink), Research Reports. [4] Production, use, and fate of all plastics ever made (with hyperlink), Science Advances.](https://www.esri.com/arcgis-blog/app/uploads/2020/09/scientific_papers_as_references_in_ocean_plastics_story.png "[2] Plastic Pollution Affects Sea Life Throughout the Ocean (with hyperlink), Pew. [3] Plastic waste inputs from land into the ocean (with hyperlink), Research Reports. [4] Production, use, and fate of all plastics ever made (with hyperlink), Science Advances.")
Custom references section
If you’d prefer to reserve the credits section for information about the story itself (rather than the sources it references), or if you’re authoring a briefing (which doesn’t currently support the credits block), you can create your own custom “Works cited” or “References” section or slide using the builder’s built-in formatting tools. This approach, demonstrated below by the award-winning story Braceros Across the United States – Mexico Border, can be especially useful if you’re using a citation style that has very specific formatting guidelines.

Citing media
Before including a piece of visual media in your story, it’s important to confirm that you have permission to use it. Many images, videos, illustrations, and other kinds of media require citations. Even when that’s not the case we suggest including media sources for transparency and accountability.
Image and video attributions
Most media blocks in ArcGIS StoryMaps include a dedicated attribution field, where authors can cite the media’s source. In the story builder, this attribution field is accessed via the media block options. Here, the attribution text can be formatted to include hyperlinks, italicized text, and more. Once a media attribution has been added, a dedicated information icon will appear in the upper-left corner of the media; readers can hover on this icon to view the full attribution.

Chart data sources
The chart block also includes a data source field, which can be configured just like the media attributions mentioned above.

Web map/scene data sources
The interactive maps and scenes you include in your story should also include attributions for any data layers they contain. Web maps and scenes will automatically display any credits included in their constituent layers’ item pages. You can learn more about automatic web map/scene citations in this article.
If you want to reference the data source for a static chart or map — or just want to provide a more prominent citation — then the block’s caption might be the best place to do this. If you describe the dataset in your narrative text, linking in-line or using the numeric style with more details in the credits section are both ways to handle this.
So many options!
ArcGIS StoryMaps is a great tool for creating interactive web content. By inviting your readers to click on a link, button, or embed card, or peruse your nicely formatted scientific citations, you are not only showing integrity as a researcher, you are also rewarding your readers by letting them dig deeper into your story’s topic!
If you have any ideas for improvement, we encourage you to share your thoughts in the ArcGIS Community — the StoryMaps team regularly reviews the feedback and ideas you share here.
A simple citation checklist
Before you publish your story, you can use the checklist below to ensure your citations and references are complete and adhere to best practices.
General
- Choose a consistent citation style to use throughout
- Verify all links work and are descriptive (avoid “click here”)
- Confirm you have permission or a license for any included media
Inline & Narrative
- Add inline citations for facts, quotes, and references
- Use hyperlinked text for easy reader access
- Use numbered references if the story contains many citations
Credits Section
- Enable the Credits section if you have multiple or formal citations
- Add full references with links where possible
- Match your credits to any inline numbering system
Media & Visuals
- Include attribution for all images, videos, and graphics (in the media block options)
- Cite data sources for charts and static maps
- Verify that web maps/scenes show correct auto-attributions and add any missing credits
Photos used: Thumbnail card for this blog post is from Erol Ahmed on Unsplash. Banner for this blog post is from Ryunosuke Kikuno on Unsplash.


Article Discussion: