How a small cross-disciplinary team transformed static fire reports into an interactive public experience.
Fire departments collect an extraordinary amount of information. They record calls for service, response and travel times, station activity, prevention work, training, lifeguard incidents, community programs, and many other services that occur long before or after an emergency. But collecting the data does not guarantee that the public, elected officials, or even internal stakeholders will understand what it means.
At the 2026 Esri Safety and Security Summit, Holly Angeles Gonzales, public information officer for the City of Carlsbad Fire Department, and David “Data Dave” van Gilluwe, chief data officer for the City of Carlsbad, shared how their team moved beyond publishing another report. They combined the department’s annual report, standards of cover, operational performance information, and accomplishments into a single interactive ArcGIS StoryMaps experience designed to help people see the impact behind the numbers. Their message was straightforward: Data informs, but stories connect.
The Problem Was Not the Data
Carlsbad Fire was not starting from an information deficit. The department already had an annual report and a 248-page standards of cover document. Those products contained performance metrics, strategic priorities, descriptions of the department, and information about its divisions. The challenge was out of reach. Once distributed, the annual report remained a static PDF, while printed copies sat in fire stations and headquarters. Both products required manual updates, and neither created the engagement the team wanted.
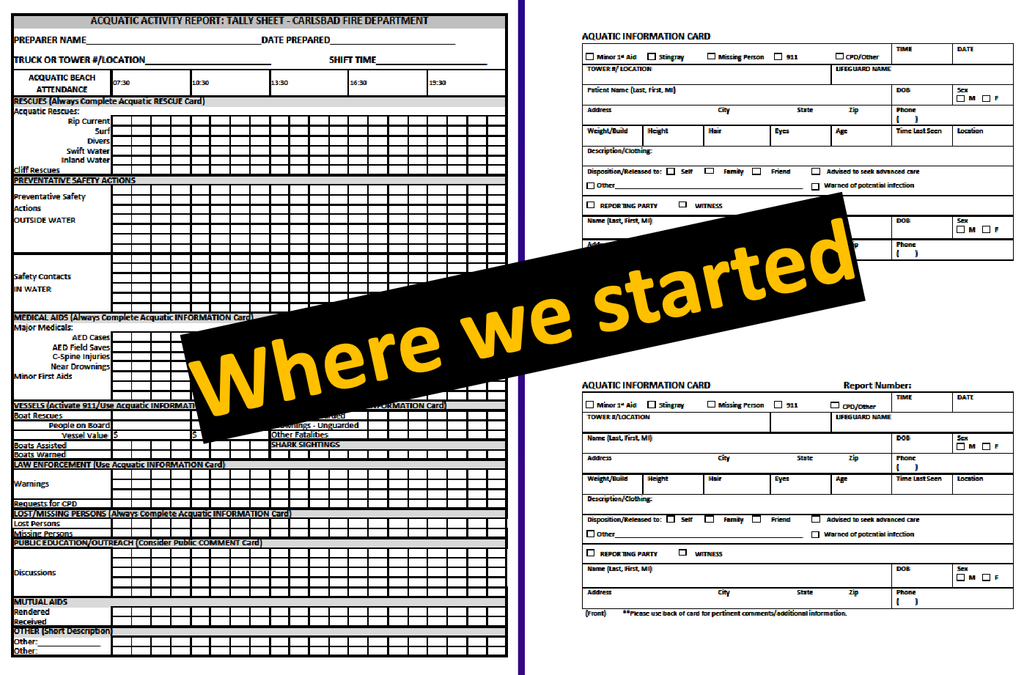
Some workflows were even more manual. Lifeguards recorded activity on paper after each shift, sent the forms through interoffice mail, and relied on administrative staff to enter the information into a spreadsheet. At the same time, other operational data was becoming more current. Information from the computer-aided dispatch system could support real-time or hourly views for long-range planning that a consultant had previously produced only periodically.
The team had valuable information and increasingly capable analytics. The missing piece was a public-facing experience that could translate technical measures into something understandable and relevant.
One Team Brought Two Disciplines Together
The project did not begin with a large budget, a design firm, or an outside consultant. Carlsbad had a relatively small GIS and IT team, one communications professional, and big expectations. The breakthrough came when the two disciplines stopped working separately.
The GIS and IT team brought the data, analysis, mapping, and visualization. Communications brought storytelling, plain language, audience perspective, and engagement. Together, the team could ask a better question. Instead of “How do we share our data?”, they asked, “How do we help people understand it?”
That distinction changed the product. A digital report could not simply recreate a PDF on a screen. It had to guide the audience, explain why the measures matter, and let people explore the information at a scale that was meaningful to them.
From Two Reports to One Interactive Experience
Carlsbad combined its standards of cover and annual report in ArcGIS StoryMaps. Maps, photographs, narrative, operational measures, and department accomplishments now work together in one experience. Community members can use a phone or tablet, zoom to a neighborhood, locate the closest fire station, view response areas, and understand average travel time. Filters allow audiences to explore the information rather than read a fixed sequence of pages.
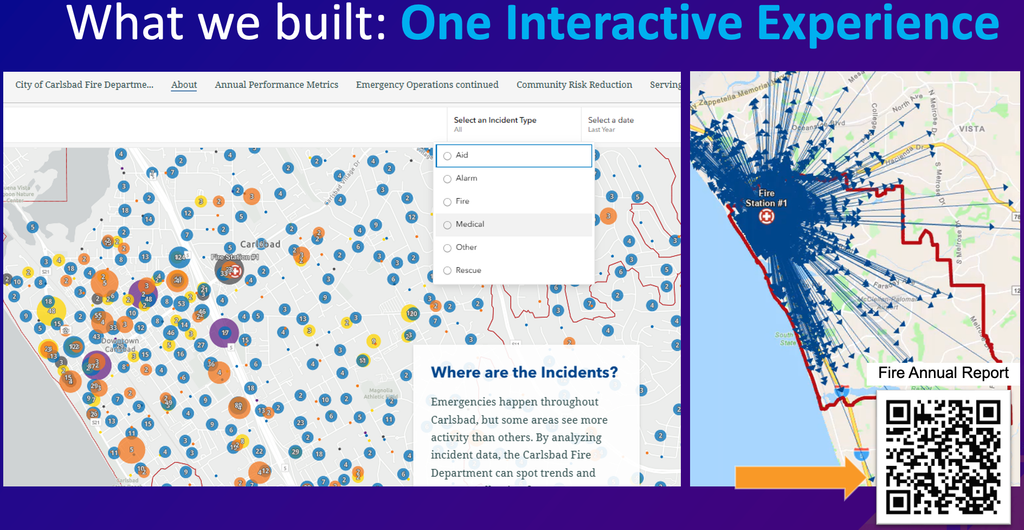
The interactive format also gives context to decisions. A station location is no longer just a dot on a map. It can be shown alongside the geography it serves, the apparatus assigned there, travel-time information, and the operational rationale for future planning. Technical information remains available, but the experience helps the audience understand what the information means.
This is where the project became more than a modernization effort. Carlsbad did not discard the standards of cover or the annual report. The team reimagined how those authoritative sources could be communicated.
The Report Became a Working Communication Tool
The most valuable results extended beyond public access. City council members could use the story as a briefing tool and explore information when questions arose, rather than request a new report from the fire chief. The team also found that many recurring community questions could be answered directly in the experience.
The story became another platform for recruitment. Prospective candidates could learn about the department, see the people and services behind emergency response, and understand the organization beyond fire engines and ambulances. The same product supported community engagement, transparency, performance communication, and executive decision-making.
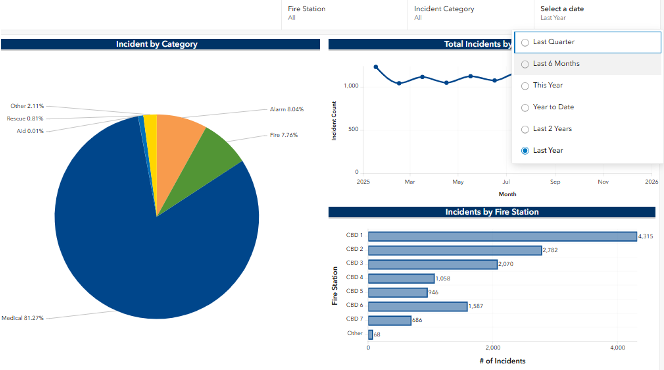
Those uses matter because they keep the information active. A report that supports several audiences is more likely to be visited, shared, updated, and understood than a document produced for one annual distribution.
Lead with Why It Matters
Carlsbad’s strongest lesson was also its simplest: Do not lead with the data. Response times, workload, training hours, and resource measures are important, but most audiences need help connecting those measures to outcomes.
Gonzales used the story of a former pediatric EMS (emergency medical services) patient to make that point. Years after Carlsbad firefighters responded to the incident, the former patient contacted the department and asked to visit the station and meet the crew. The story gave a human meaning to response time, training, and resources. Those measures are not abstract performance indicators. They represent a department’s readiness to be present when a community member needs help.
“People don’t necessarily connect with data, datasets, or charts. They connect with stories.”
Holly Angeles Gonzales, Public Information Officer, City of Carlsbad Fire Department
The team’s approach was not to remove the charts and maps. It was to let those elements support the message. A strong visual or a clear story opens the door. The data then provides evidence and allows the audience to explore further.
Three Lessons Other Fire Departments Can Use
Simplify agressively.
Technical language and long reports may be necessary for accreditation and planning, but the public-facing story should focus on the information the audience needs to understand the department’s impact.
Build across disciplines.
GIS professionals understand data and spatial relationships. Communicators understand the audience, language, message, and engagement. Combining those strengths produces a more useful result.
Lead with the why.
Start with the mission outcome or the community question. Use maps, metrics, and charts to support that story rather than making the audience interpret the meaning on its own.
Make the Data Visible, Understandable, and Useful
Carlsbad Fire’s experience demonstrates that a modern annual report is not defined by its format. The value comes from connecting authoritative information to the questions people actually ask: Which station serves my neighborhood? How long does it typically take to get here? What work happens beyond emergency response? Why is the department planning a new station or changing how resources are deployed?
ArcGIS StoryMaps gave the team a way to combine those answers with the maps, measures, photographs, and narratives already available across the organization. The result is not merely a better-looking report. It is a reusable communication asset that supports council briefings, community education, recruitment, transparency, and internal understanding.
Every fire department has data that tells a story. The leadership choice is whether to leave that story inside a report or shape it into an experience that the community can see, understand, and use.
The Takeaway
Do not start with the dashboard, chart, or map. Start with the question your audience needs answered, then use the data to make the answer visible, understandable, and meaningful.
For more information on how GIS can be used in the fire service, visit Esri’s Fire, Rescue, and Emergency Medical Services web page and reach out to the Esri public safety team with any questions.