What do a college town in central Pennsylvania, a city ravaged by fire in Oregon, and a city struggling to improve its economic development outlook in southern California have in common? More than you might think.
When it comes to planning, our tendency is to think that our community has a unique set of problems, to which no one can really relate…especially a community with a different socio-economic architecture than ours. In reality, the stories of the hurdles our communities are facing across the nation have a very familiar and similar tone. Yes, all three of these locations have different backgrounds, stories, and even goals, but all three also embrace a modern, data-driven approach to planning to meet the evolving needs of their residents.
State College, Pennsylvania has a modest population of 42,000, but the topography of the area constrains the city limits to less than five square miles. That means denser and mixed-used development is a must to accommodate the growth the city is seeing. “We’re seeing the biggest building boom since the 1970s, and we wanted to be in a better position to explain what’s happening,” said Ed LeClear, State College’s director of Planning and Community Development.
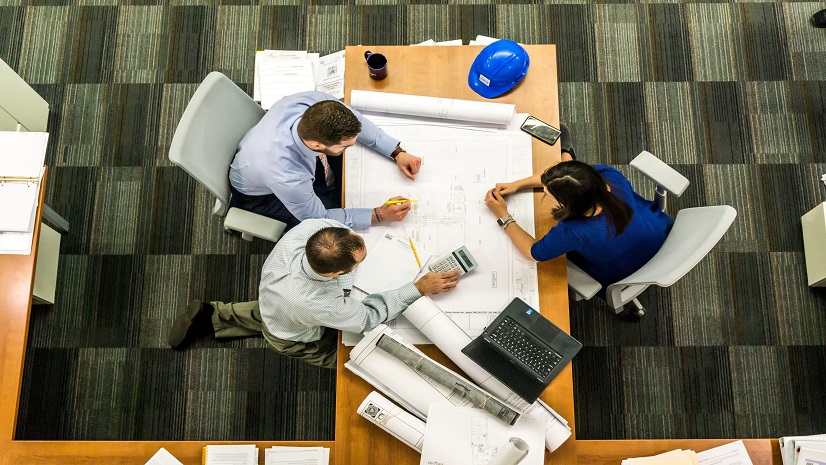
To track and share information about the rapid development, LeClear and his team are using ArcGIS to visualize changes and analyze impacts on residents and the local economy. LeClear teamed with colleagues Greg Garthe, a planner and zoning officer with a background in GIS, and Brian Fahringer, a GIS analyst who brings visualization skills from a prior job at an engineering firm. The team created a digital twin, a combination of a map and a 3D model of buildings and infrastructure, using ArcGIS Urban, a web-based 3D application that supports scenario planning and impact assessment.

The digital twin enables the team to share and compare features, such as heights, setbacks, and FAR and see how streetscapes are changing. For city planners, the look of downtown is important, but so is the economic mix that contributes to the city’s vitality. Long time residents of any city can be wary about significant changes in growth patterns, which means that transparency in these situations is more important than ever to not only create a dialogue, but a partnership between residents and their planning department. To address this, State College launched an immersive 3D website that lists all projects in the borough under review, approved, under construction, and completed.
As new council members, many of whom ran on a platform of creating affordable housing. take office, LeClear and his team plan to lean on their GIS maps and models to help developers and the city find that balance for residents. “This digital twin tool will be helpful to orient new local officials about the issues,” LeClear said.

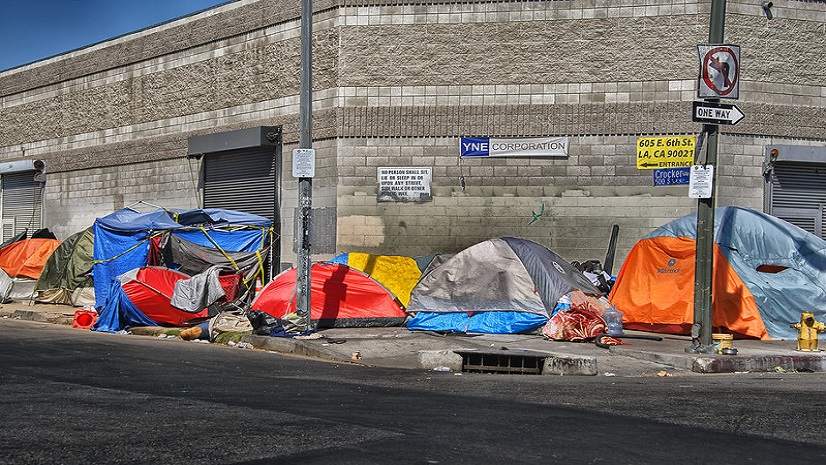
In 2020, the Alameda Drive Fire burned a path of destruction through southern Oregon. One of the towns that saw particularly harsh devastation was the City of Talent, Oregon. The devastation was particularly harsh on many low-income first-generation immigrants working in the area. City officials and community leaders wanted to map a path to keep families who had called Talent home.
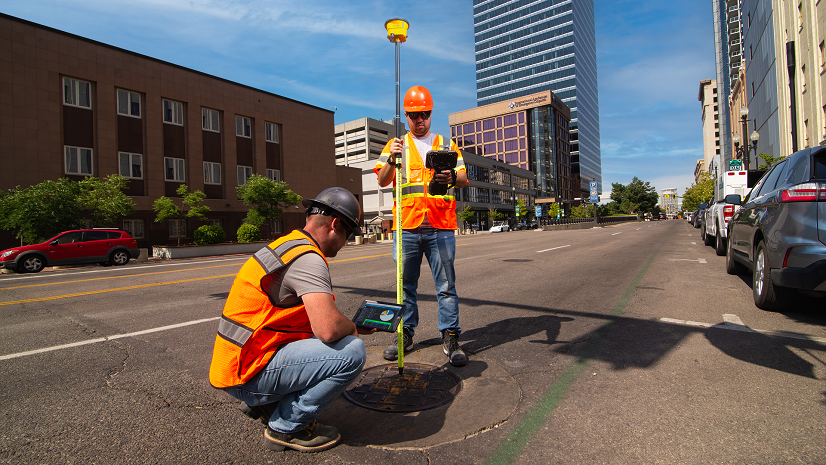
The Talent Urban Renewal Agency (TURA) purchased a four-acre plot of land between Route 99, the major thoroughfare for motorists passing through town, and Talent Avenue, the city’s central street. This was an area that was primarily vacant. The town had planned to develop it into the Gateway Redevelopment Project, a combination of residential development and local businesses, as a way to attract more traffic from the highway. To create the project, planners relied heavily on GIS. Nikki Hart-Brinkley, owner of Greentop PDR, helped the city use existing LiDAR data to build a 3D base map of the Gateway site with the purpose of meeting the housing needs of many displaced residents. That map provided a realistic interface for conducting scenario planning for the site. The planners could execute a proposal virtually, adding structures to the GIS and examining the results from all angles. This web-based 3D environment built in ArcGIS Urban allowed TURA to see how it would mesh with existing zoning and land use laws.
This work also provided insight into utility needs for the development. “You have to have water, sewer, and electricity for each and every unit,” Hart-Brinkley said. “That stuff doesn’t just happen to be there.”
Because civic inclusion is a key component of this project, the city has deployed an ArcGIS Hub site to inform the public and provide transparency about the process.
With ArcGIS as a guide, Gateway’s designers forged a four-phase development plan. Beginning with the 53 trailers of transitional housing, Gateway will undergo its own transition. Over the next few years, permanent affordable housing will replace some of the trailers. This mix will evolve into a site with 90 affordable apartments.

“We knew when we purchased the property and started working with the community to create a vision here that it was a very special place,” Darby Ayers-Flood, Talent’s mayor, said during the groundbreaking ceremony. “We had no way of knowing how special this place would become.”
The City of Colton, California is like many cities in that they lack the housing to fit the lifestyles of its changing and growing demographics. At a crossroads in their history, city leadership have decided to meet these needs and address economic development concerns with the creation of a downtown mixed-use marketplace called Hub City Centre. In 2014, the city had a 450-acre piece of land to work with. Instead of letting warehouses occupy the vacant space, Arthur Morgan, economic development manager for the City of Colton wanted to use this area to transform Colton into a more livable, appealing, and healthier city.
As with the previous two examples, the city leveraged a digital twin created in ArcGIS to both plan and market the development of the Hub City Centre. “We know what we want, we know what we’re going after, and we can use GIS to tell the story to get businesses and developers to be a part of it,” Morgan said.
When the city leaders asked the public what they wanted to see, it became clear that residents wanted to move away from traditional single-family residential lots to townhomes and other middle housing. Using ArcGIS Urban, the city has built a 3D model of planned and existing development. The 3D model made its debut at the International Council of Shopping Centers (ICSC) conference, where Morgan incorporated the immersive tool in his pitch to retailers. City leaders were able to present to developers using the 3D model to show them how they would blend into the community. Housing, restaurants, and hotels have been added to Hub City Centre over the past few years, with no signs of slowing down.

Many local economies experienced significant loss during the pandemic, but Colton saw a $2 million revenue increase from sales and property tax.
These three examples are a small sampling of a rapidly-evolving trend taking place across the country. The implementation of a digital twin gives communities the tools they need to effectively understand current assets and resources, while also creating multiple scenarios for future development that meet the needs of all their residents. From a planning standpoint, the digital twin and the tools used to model development provide a more efficient route to more sustainable and equitable developments. From an economic development standpoint, the digital twin gives communities a competitive edge, whether dealing with business recruitment or business retention and expansion (BRE).
As we’ve said many times here, 3D is no longer a luxury. It’s not something that someone else is able to do or afford. It’s attainable and affordable, and more importantly, it’s how planners, economic developers, and the public think.