August 11, 2020 |
Dr. Dawn Wright | GIS for Good
In Tennessee, Oregon, New York, and other areas, public health teams are sprinkling the internet with maps that highlight neighborhoods most susceptible to extreme heat.
The maps, created using geographic information system (GIS) technology, show who is affected as temperatures rise because of climate change. In all locales, the maps reveal that extreme heat has the greatest impact on communities that have already been ravaged by the effects of past discrimination in land-use policies.
Public health groups across the US are using GIS analysis to identify the most vulnerable neighborhoods and recommend interventions that could prevent the worst outcomes. Tree planting provides a first step, given the cooling properties of tree canopy and the stark lack of shade equity nationwide.
On average, about 658 people across the US perish in grim circumstances each year because of heat, the Centers for Disease Control and Prevention reported. Extreme heat during summer is now the deadliest weather-related threat in the US, even though most heat-related deaths are preventable.
As leaders and communities awaken to the dangers of extreme heat, attention is shifting to the prevention of heat-related deaths and illnesses at home and on the job. Education programs about the dangers of extreme heat and self-protective measures for staying cool have become a priority.
Protecting communities from extreme heat starts with making digital maps that help locate the hottest neighborhoods and streets.
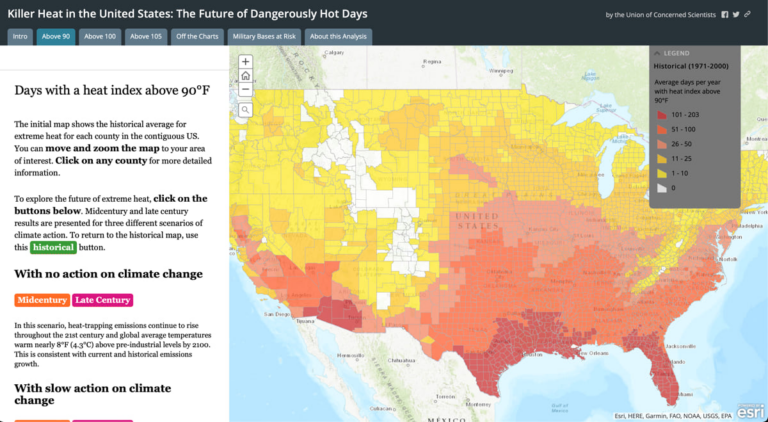
In the summer of 2022, the National Oceanic and Atmospheric Administration (NOAA) and local scientists used GIS to map and monitor temperatures and humidity in the hottest parts of 14 communities across the US that are recognized as urban heat islands. Temperatures in intraurban heat islands can be one to seven degrees higher than in outlying areas, according to the US Environmental Protection Agency.
NOAA’s Climate Program Office worked with the interagency National Integrated Heat Health Information System and CAPA Strategies to collect and analyze the data. Volunteers drove around the city in August 2022 to record temperature and humidity readings using sensors attached to their cars.
Nashville, the state capital that sits in Davidson County, is one of the 14 cities chosen for the program. A history of discriminatory housing practices and state highway construction have aided the decline of Black communities here and across the US. These neighborhoods became economically fragile, racially segregated, and often isolated as lenders denied mortgage applications for properties in Black neighborhoods. Other forms of private and public investment were also mostly absent.
Communities that are marginalized in these ways tend to have aging, less energy efficient housing. This makes those residences more dangerous as temperatures rise.
From 2010 to 2021, there were 3,009 documented heat-related hospitalizations and emergency department visits in Davidson County, according to the Tennessee Department of Health.
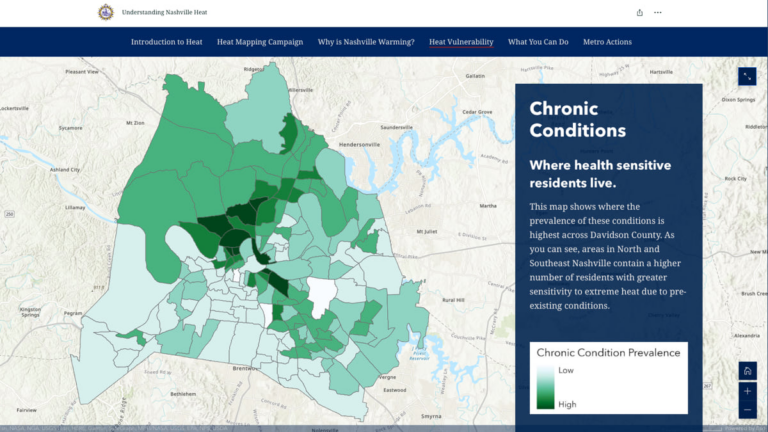
Sensor data allowed the researchers to develop temperature and heat index maps that highlight heat hazard zones. Targeting these areas for additional support and resources can save lives and help control the cost of caring for those who otherwise might become sick.
In Multnomah County, Oregon, which includes the city of Portland, the community has spent millions of dollars to create emergency cooling centers, provide air conditioners, and respond to heat-related illnesses. Billions more could be needed to prepare for more severe public health emergencies related to extreme heat in the future. Residents and government officials there are taking steps to save lives and reduce public health risks.
In July 2023, more than 100 volunteers used sensors to gather data along 41 routes in three counties. The temperature data will be used in a heat risk assessment tool built using GIS technology. This resource will also include data about the type and age of buildings, the likelihood that air conditioning is available inside, and details about the density or scarcity of the community’s tree canopy.
Location-based analysis will help pinpoint where interventions are most needed to protect people at greater risk.
Developing statistical models on the risks from extreme heat is also important for identifying the range of factors that can contribute to heat illness or death, Vivek Shandas told Oregon Live. A professor in the geography department at Portland State University, Shandas led the heat mapping effort with an eye onidentifying policies that might restrict residents from protecting themselves.
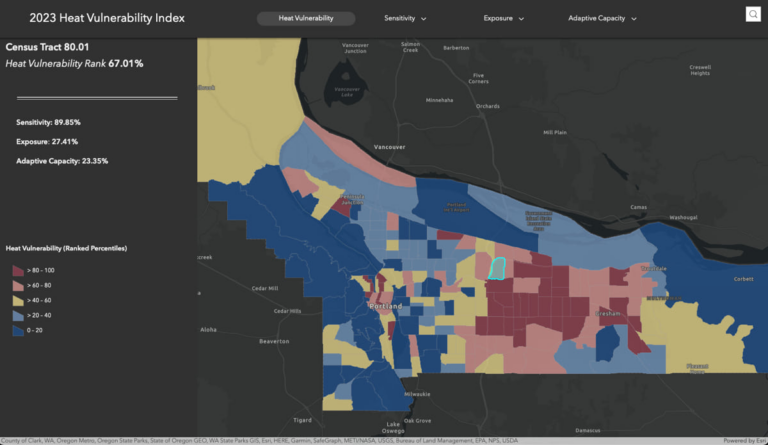
Data collected will be added to Multnomah County’s Heat Vulnerability Index. This interactive map illustrates variations in how populations throughout the area adapt to extreme heat based on heat vulnerability, sensitivity, and exposure. New data from the heat mapping campaign will be used to recalculate the exposure score of the heat index.
Ultimately, the Heat Vulnerability Index map will be useful in shaping policies in land-use planning, transportation, public housing, and tree planting.
About 370 people die prematurely in New York City every summer because of hot weather. The death rate is two times higher for Black residents compared to white residents. Disparities in economic opportunities, health care, housing, energy, and other areas double the risks for Black residents in some neighborhoods, according to the New York City Health Department.
Today, the city’s outreach efforts aim to prevent deaths in those communities that are most at risk. In its outreach efforts, the city relies on a Heat Vulnerability Index, or HVI. This resource includes an interactive digital map that identifies and ranks neighborhoods most at risk. The rankings consider surface temperatures, green space, access to home air conditioning, and other factors.
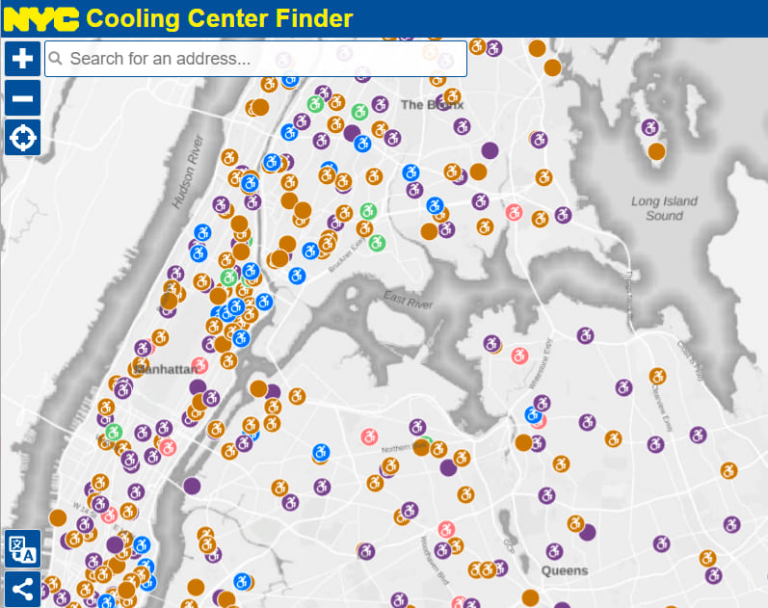
With this data available to locate neighborhoods where temperatures are most intense, the city has issued heat warnings and opened cooling centers. The city also helps with summer utility costs, works to ensure that windows operate properly inside homes, and prohibits the disconnection of electricity during the hottest months.
The Cool It! NYC map can help residents find drinking fountains, pools, and other places to hydrate, cool off, and stay in the shade.
As heat waves become more of a threat, city leaders are making maps to save lives. These maps have proven essential for locating communities in need of help, whether to protect against extreme heat or other weather-related threats. While every local government has a responsibility to identify and support those most at risk, climate-related events make that assignment much more urgent.
Learn how communities use GIS to craft climate action plans that contain detailed risk analysis.