July 15, 2025 |
Dr. Dawn Wright | Conservation
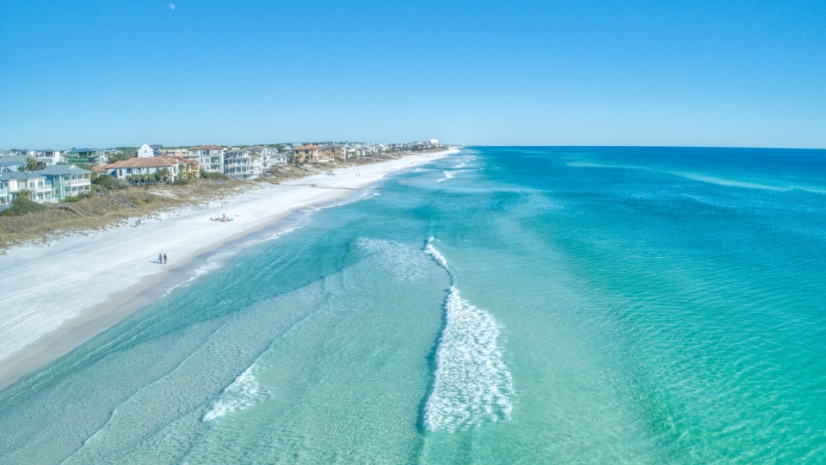
Florida is leading the way in seafloor mapping—by air and by sea—on all sides of the peninsula and panhandle. The Florida Department of Environmental Protection (DEP) has largely completed mapping the seafloor along the entire Florida coast, from nearshore to the continental shelf. Funded with $100 million in 2021, the project will also produce a statewide high-resolution digital elevation model, the first of its kind for any state, to guide coastal management, emergency response, navigation, environmental science, habitat restoration and resilience planning. The work will help protect marine and coastal biodiversity for resource management, unlock new insights for public safety against flooding, and support economic activity for commercial fisheries and tourism.
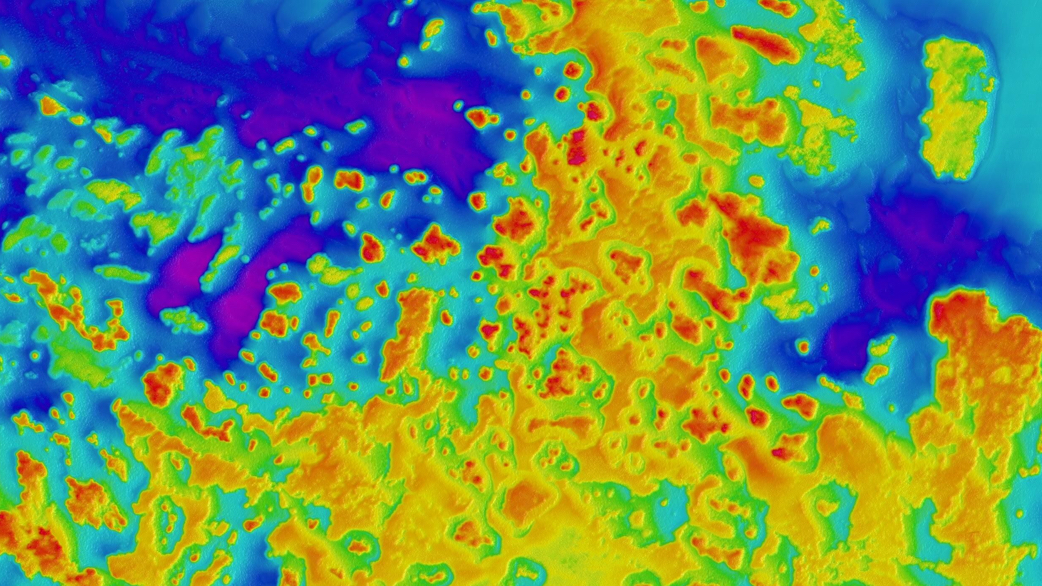
The state’s combined approach to data capture is the first of its kind at this scale. Using airborne lidar, sonar-equipped boats, and autonomous vessels to scan the seafloor, Florida centralizes the data in geographic information system (GIS) technology. The collection of data, when mapped and analyzed with GIS, will guide resilience measures statewide.
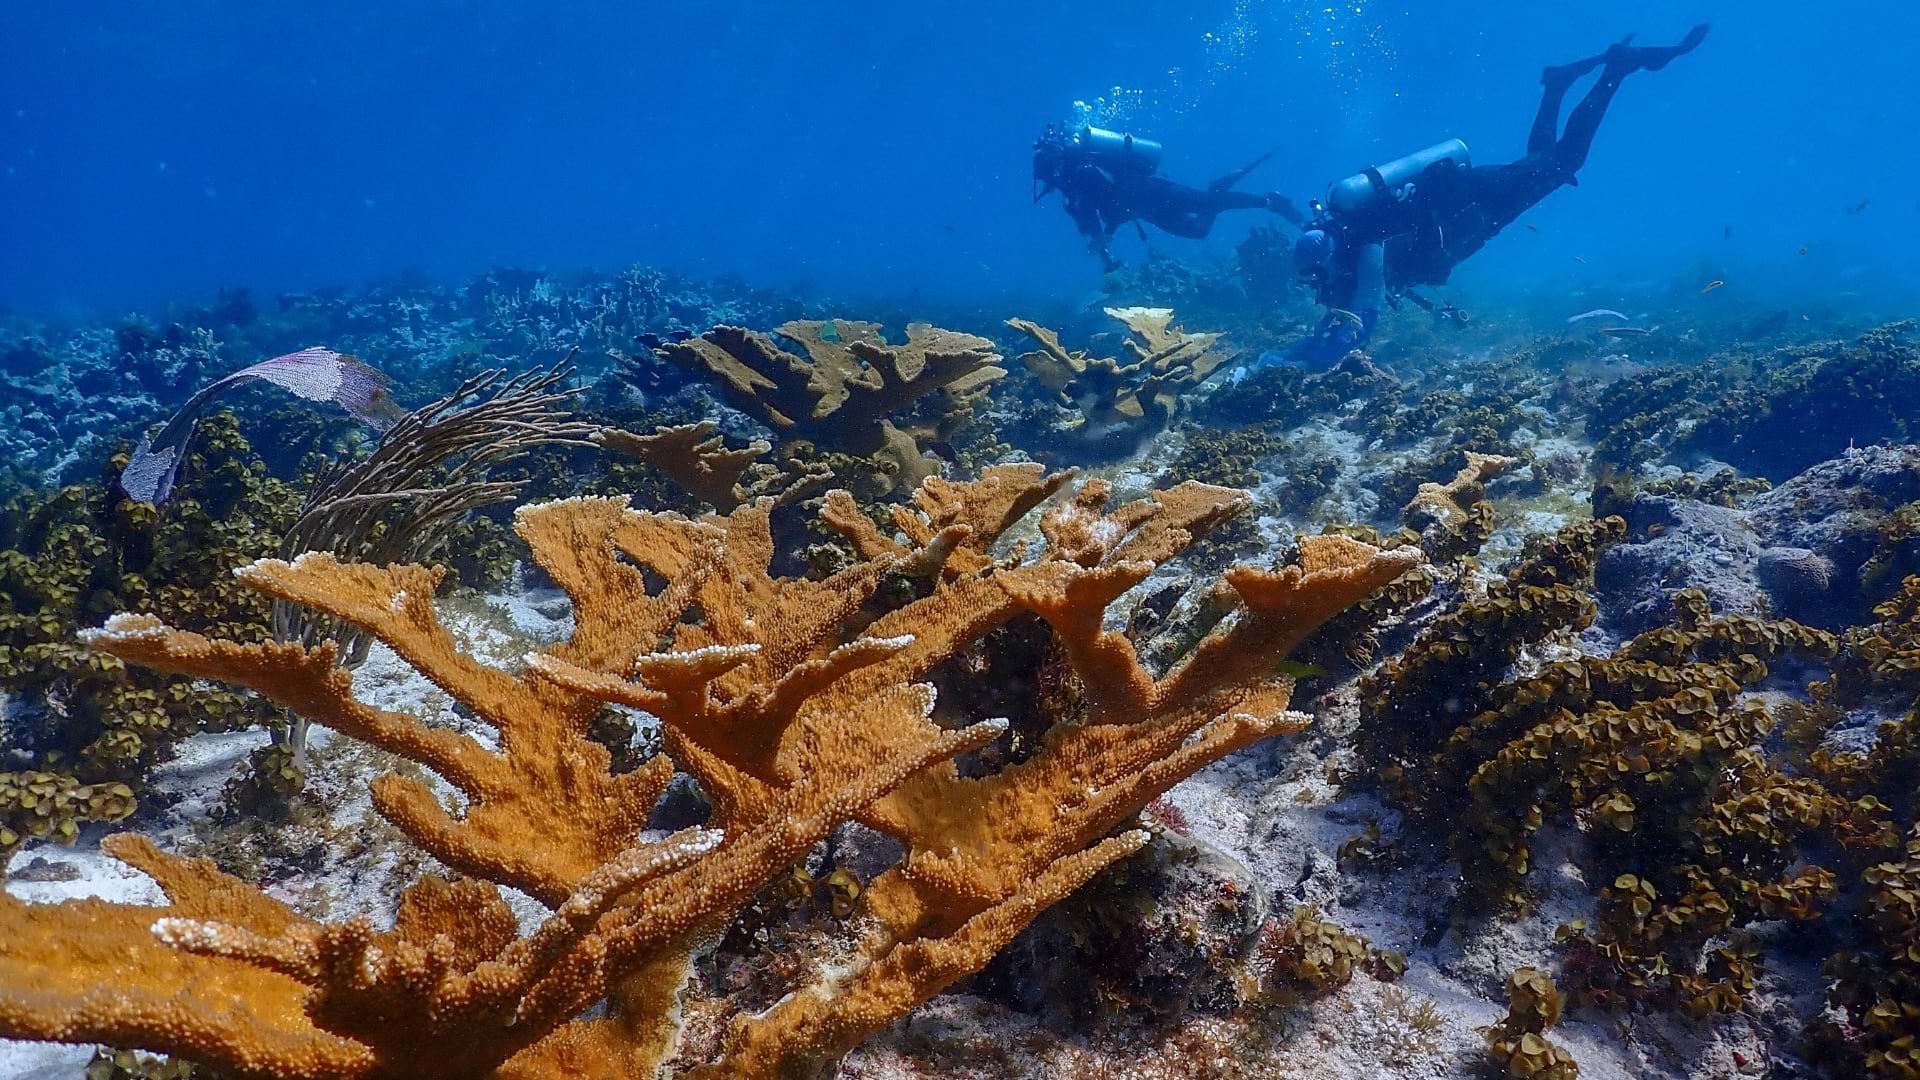
Home to the only barrier reef system in the continental United States, Florida’s coral reef stretches from the Dry Tortugas up the Atlantic coast to St. Lucie Inlet. Marine scientists in Florida are restoring damaged reefs through coral outplanting: a process that moves nursery-grown corals onto natural reefs. The work requires centimeter-level precision to place corals where they can thrive.
This is one area where the data-rich GIS maps have already proved helpful. “Having this high-resolution, detailed data is going to help us really pinpoint where we need to do the restoration work,” said Alex Reed, director of the Office of Resilience and Coastal Protection (ORCP) with the Florida Department of Environmental Protection (DEP).
Restoration efforts benefit the state on multiple fronts. Biodiversity sustains a thriving charter boat tourism industry that Florida works hard to protect. Through science-based catch limits, habitat restoration, and stock assessments, the state has successfully rebuilt species like snook and redfish. Signals in the data help the state get ahead of environmental impacts. The seafloor scans detect changes in benthic habitats—an important indicator of habitat health.
Beyond habitat protection, the work strengthens coastal resilience. For instance, the state uses geospatial data to identify sand deposits for restoring beaches. The same data assists modeling efforts to simulate tidal flooding patterns, helping officials anticipate where water will move during storms or high tides. These insights inform emergency management plans, guiding evacuation routes, resource staging, and infrastructure protection to reduce risk for coastal communities.
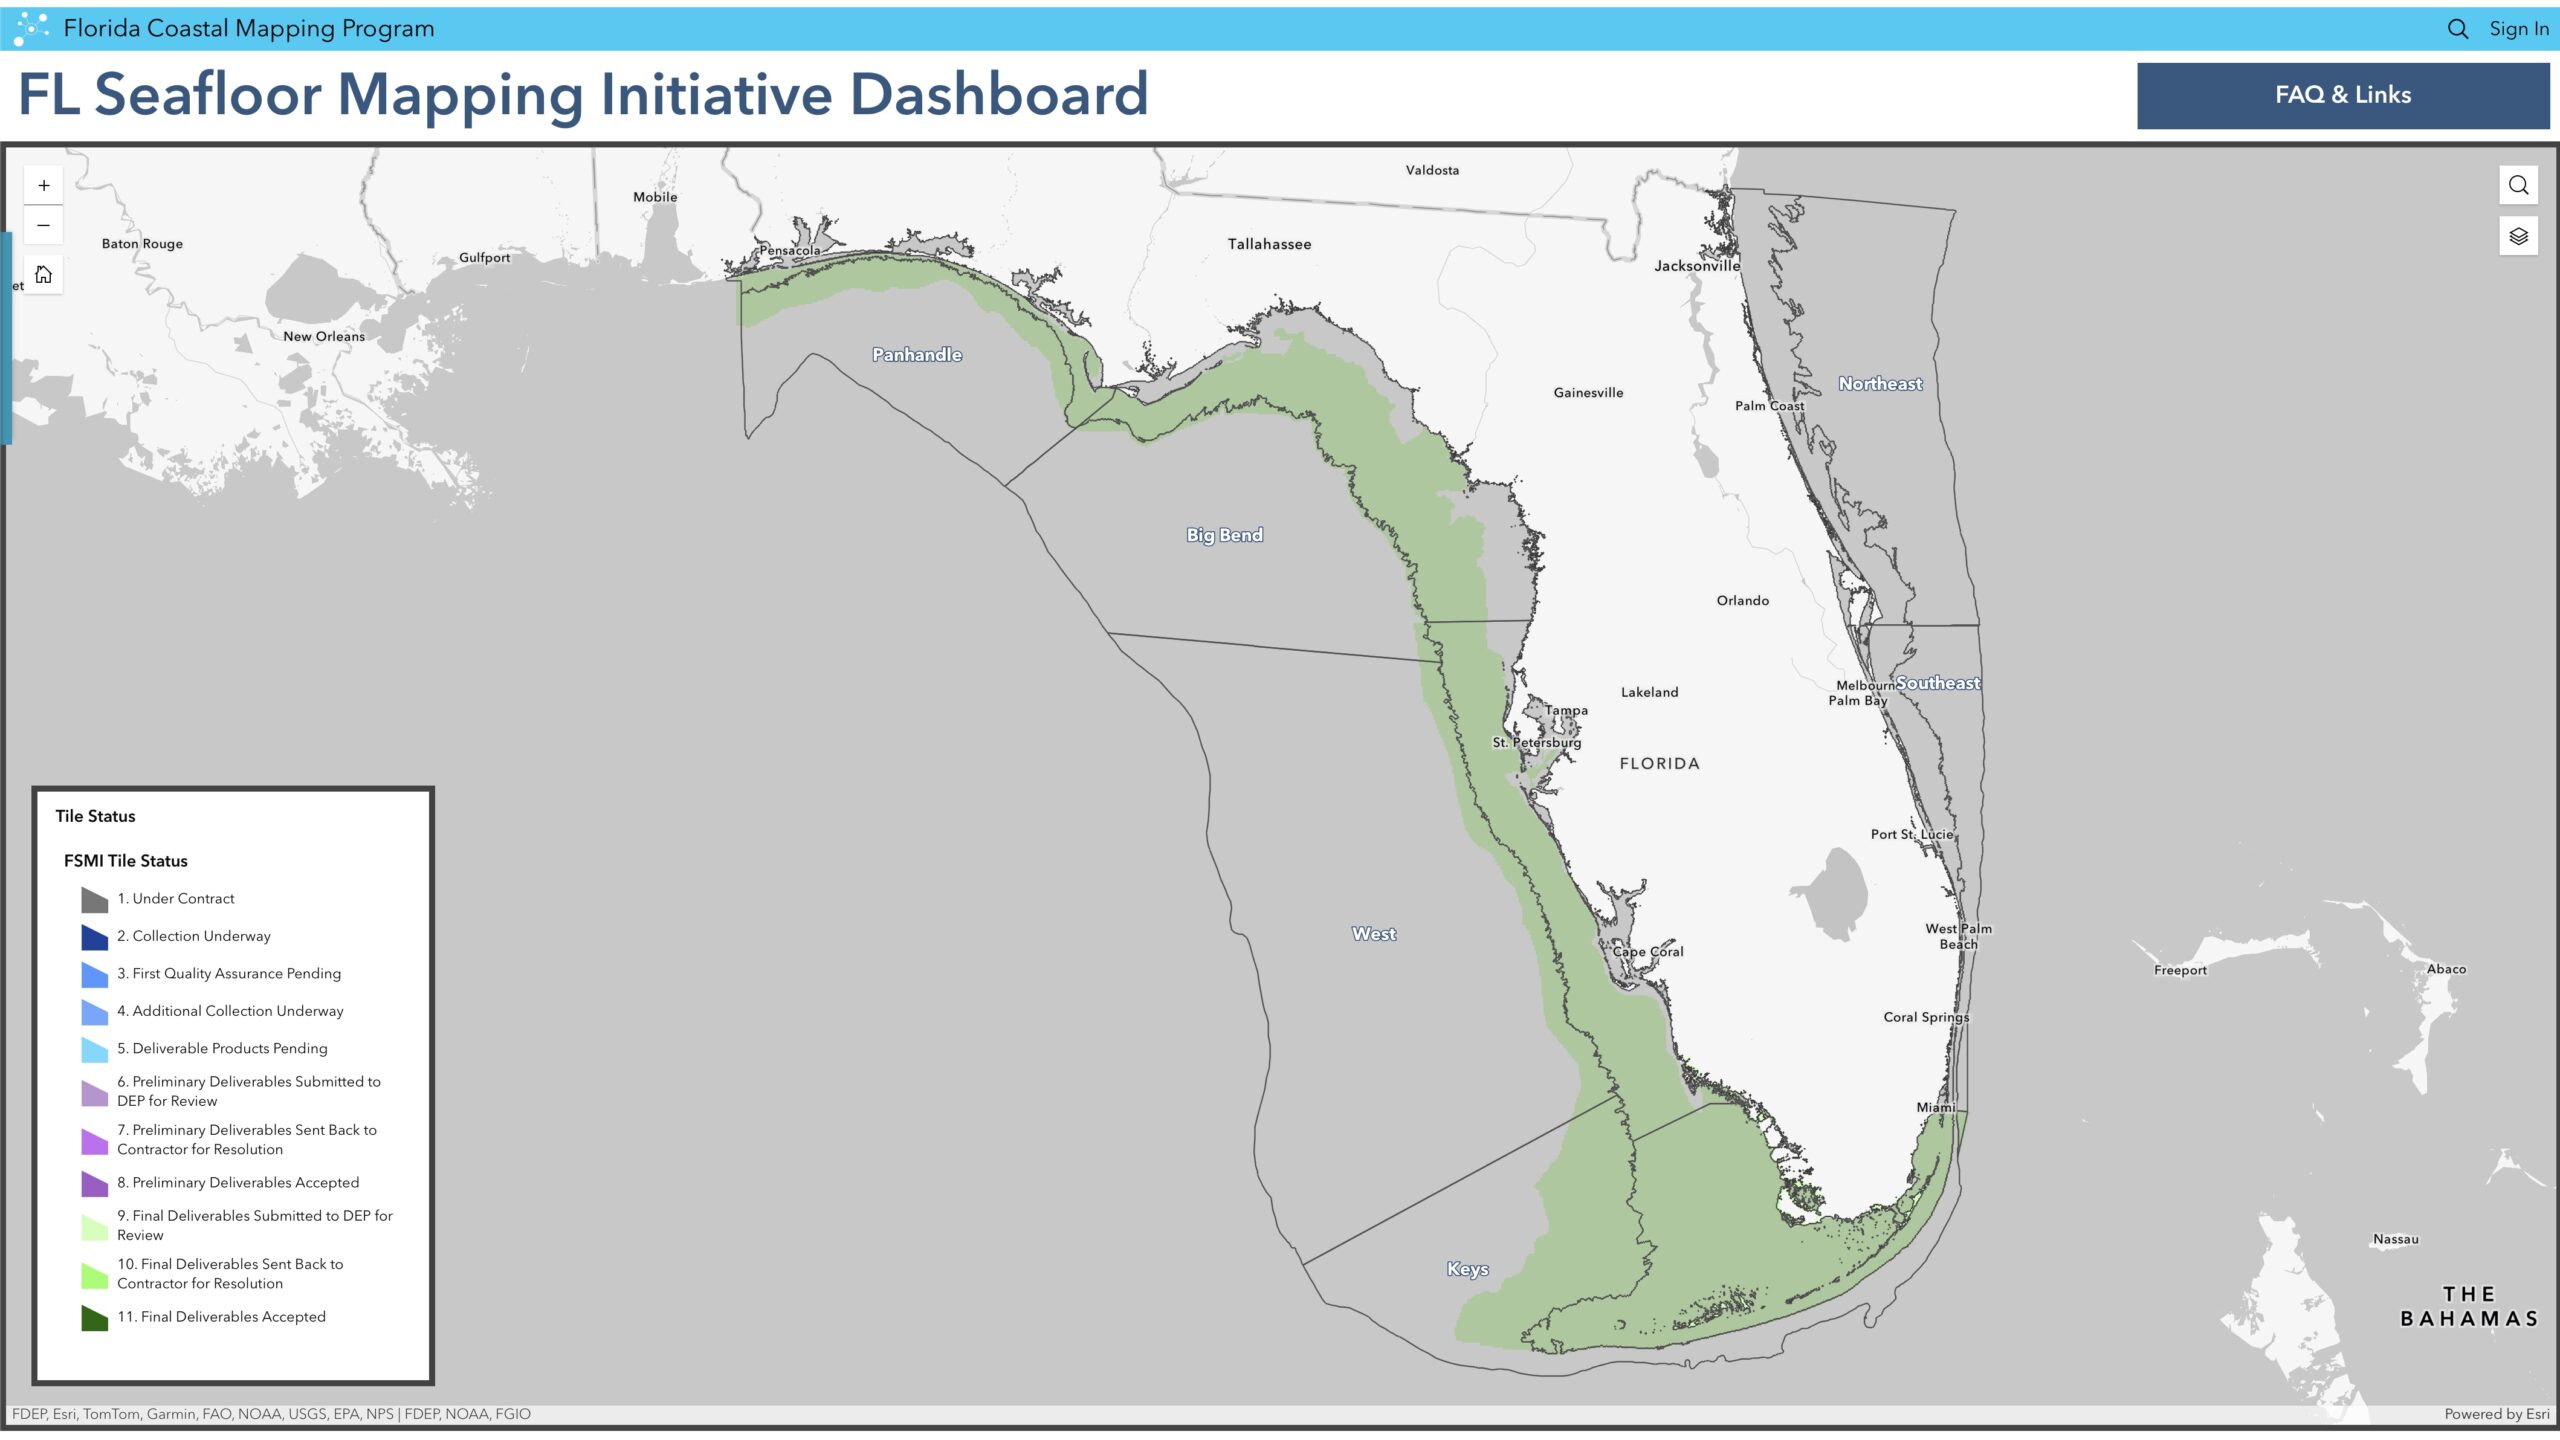
State lawmakers appropriated $100 million in 2021 to collect high-resolution bathymetric data (underwater depths) along Florida’s coastal waters. The five-year Florida Seafloor Mapping Initiative (FSMI) is in the home stretch. Heading into the final year, the aircraft are done with their part, and the vessels are wrapping up in spring, 2026. The vast majority of the data is in the quality assurance phase.
Reed, along with Kim Jackson, Florida’s geographic information officer, who manages geospatial data and technology adoption for the state, has led the effort from day one. For GIS muscle, she enlisted Jim Cichon, technical support lead for the Resilient Florida Program and a veteran of the Florida Geological Survey, and Jeohusua Lugo, the GIS manager for the ORCP.
FSMI will provide critical data for the statewide vulnerability assessment. High resolution bathymetric data, combined with perviously obtained terrestrial topographic data, will improve the modeling capability for determining critical community assets that are at risk of flooding.
With over 8,000 miles of tidal shoreline, the longest in the contiguous US, the team had their work cut out for them. But they weren’t starting from scratch.
Coastal mapping in Florida began in the 1800s as a navigation aid for maritime trade. Early surveys relied on lead lines and manual charting to measure depth and hazards. More recently, the National Oceanic and Atmospheric Administration (NOAA) efforts included lidar surveys and multibeam sonar for mapping critical shipping lanes.
Reed and Jackson knew they could use some of this data. They leaned into the NOAA philosophy—ping once, use many times—as a guide. Jackson and Lugo used GIS to identify which coastal areas still needed surveying.
Upcycling data was like scratching a big item off a long to-do list. Highlighting a long stretch of coastline in dark yellow on the digital map, the team knew precisely where it wouldn’t have to send boats and planes. The large seagrass preserves in the Big Bend region coastline—as well as ports from Pensacola to Tampa to Fort Meyers—were all well mapped with the latest high-resolution sensors and didn’t require revisits.
Cichon planned the survey work that’s left to be done on a web map dashboard in six sections of the state. Water depth determined where he would send vendor boats or aircraft.
Survey operations are more than just covering space. “We have coordinated data collection planning with local fishermen. It is crab and lobster season right now in the Keys,” Cichon said. “We can’t collect data because the fishermen understandably have concerns about their livelihoods if we go near their traps.” There are also challenges to manage, such as major hurricanes and their aftermath.
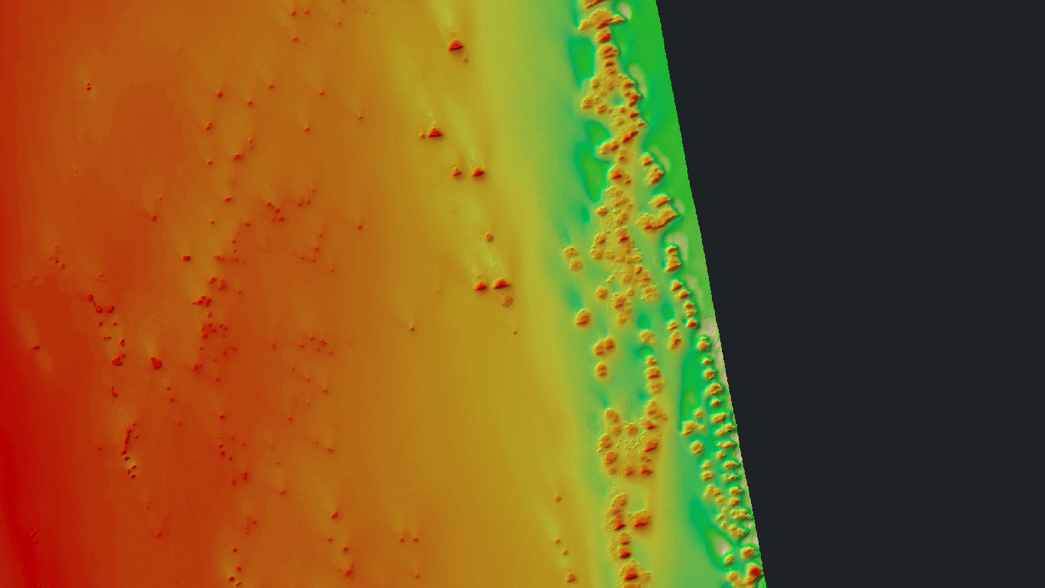
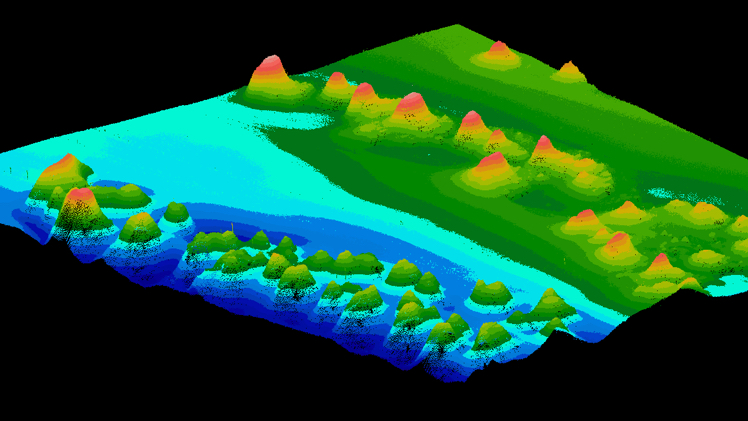
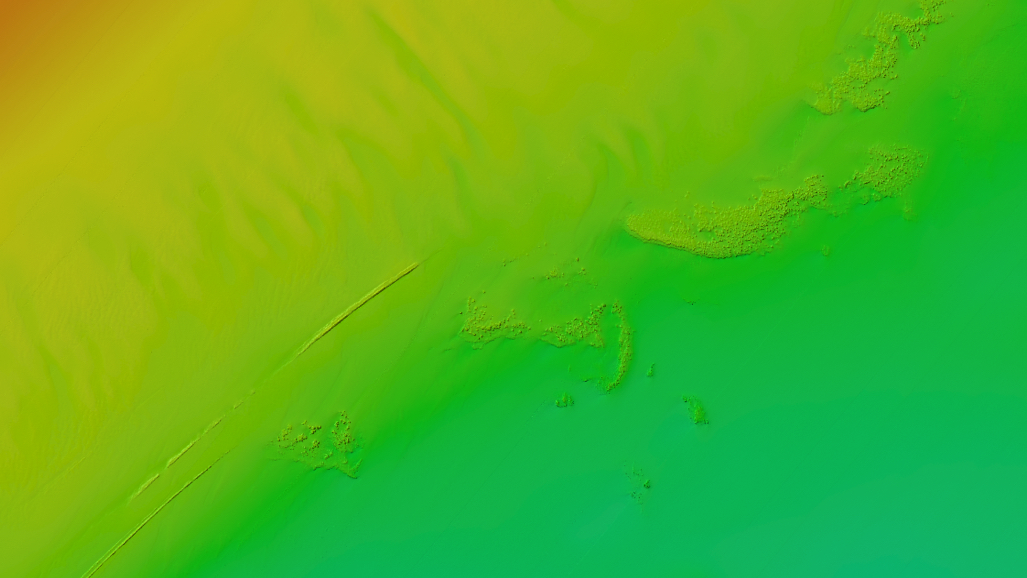
Airborne lidar systems use laser pulses to map shallow coastal waters, reaching depths from 20 to 50 meters in clear conditions. In Florida, especially in the southern part of the state around the Keys, this made large swaths of the seafloor visible for rapid, wide-area survey coverage.
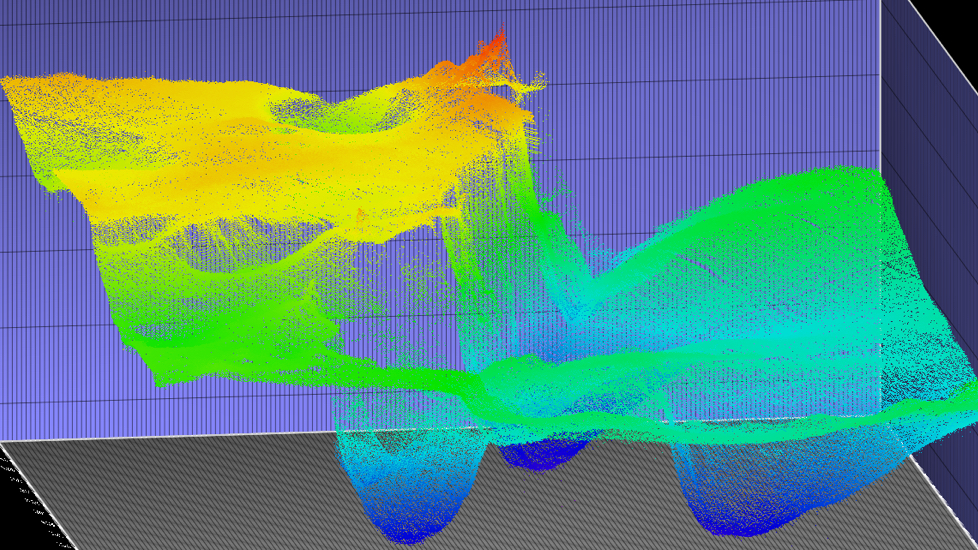
Beyond these depths, ocean mapping relies on ship-based multibeam sonar, which uses sound waves to map deeper areas. Seafloor survey data reveals deep-ocean features such as seamounts and ridges that affect cable routes and shipping lanes, and fault lines that signal seismic hazards threatening offshore energy and coastal infrastructure. It also reveals habitats such as seagrass beds, oyster reefs, and spawning grounds that sustain fish populations.
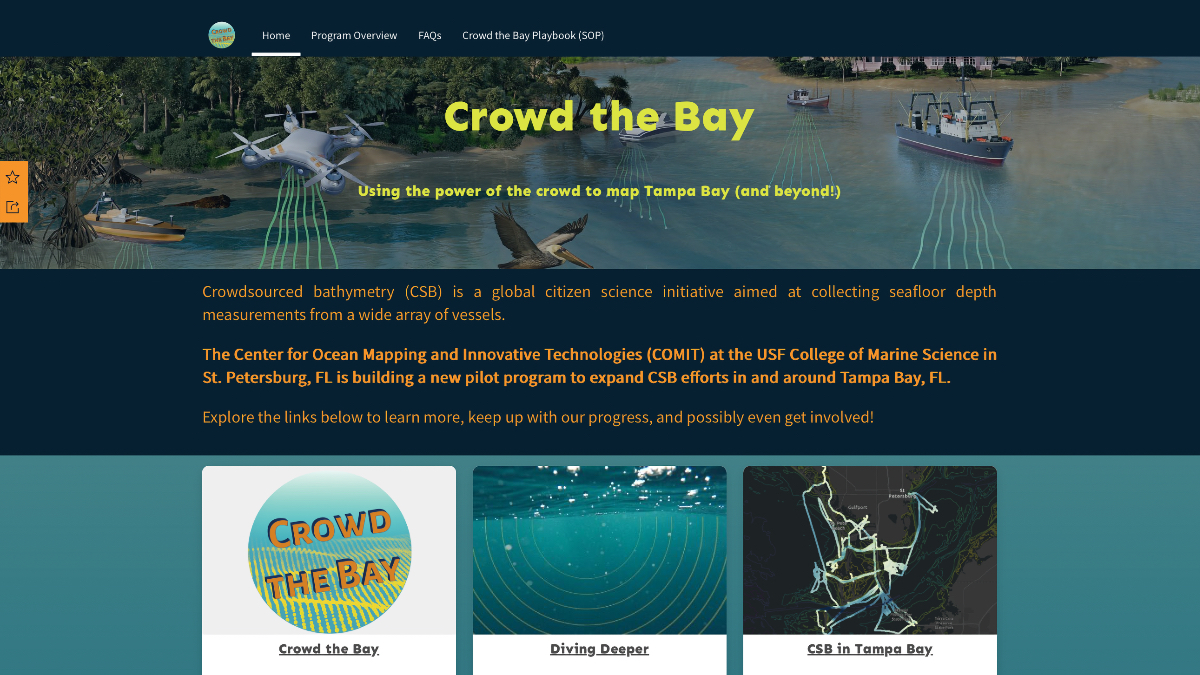
The FSMI team makes geospatial data publicly available via their website so that field survey crews can coordinate the capture of the cleanest possible data. They post tidal information, for example—a lesson from New Jersey’s seafloor mapping project—so crews can time airborne surveys at low tide. This increased the likelihood that they would expose hazards near shore where the sonar boats would later go.
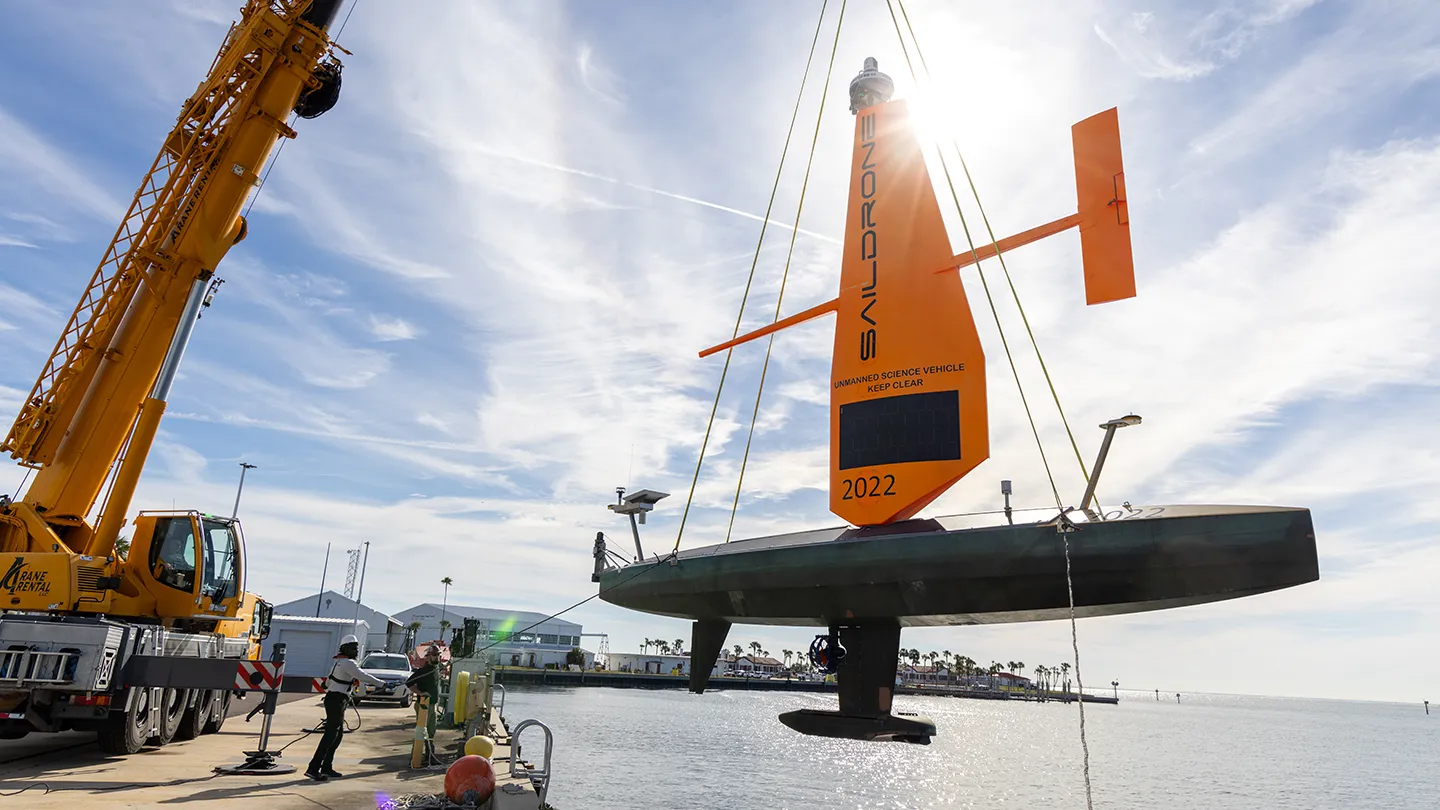
FSMI also embraced the large-scale use of autonomous vessels that may revolutionize seafloor mapping. Combining remote sensing technologies by air and sea accelerated the project. And the use of crewless vessels reduced operational risks when collecting data in the storm-prone Big Bend area of Florida.
Two vendors supplied crewless vessels for the project. Saildrone’s Voyager-class, launched from Saint Petersburg and charted thousands of square kilometers in the Gulf of America. Powered by wind and solar and fuel, these boats leave a minimal environmental footprint and are capable of continuous data collection—even in rough conditions.
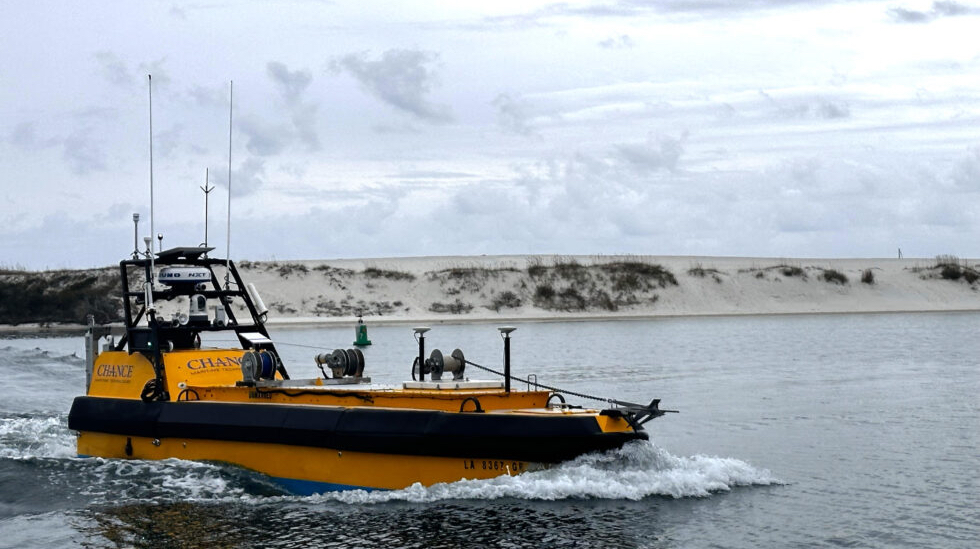
Meanwhile, Woolpert, in partnership with Chance Maritime Technologies, deployed a 29-foot autonomous survey vessel equipped with sonar systems. Gathering data 24/7 for over a week, operators remotely controlled the vessel and monitored progress from shore.
The FSMI team taps into computer systems administered by the Florida Resources and Environmental Analysis Center (FREAC) at Florida State University. Vendors upload raw survey data to cloud storage; then, in the FREAC team in Tallahassee—composed of specialists in analyzing environmental data—conducts an initial review.
From there, Cichon brings the data into GIS for a more focused manual quality assurance review.
Jackson created workflows to support near real-time look at the project. Vendors share updates to show the areas collected, when the data goes into quality assurance, and when it’s going to be completed. Web-published dashboards looped together officials and operations teams.
“It elevates the level of transparency and simplifies a lot of the contract management and status reporting for our team,” Reed added. “The more that you can provide on the web page, the fewer questions people have.”
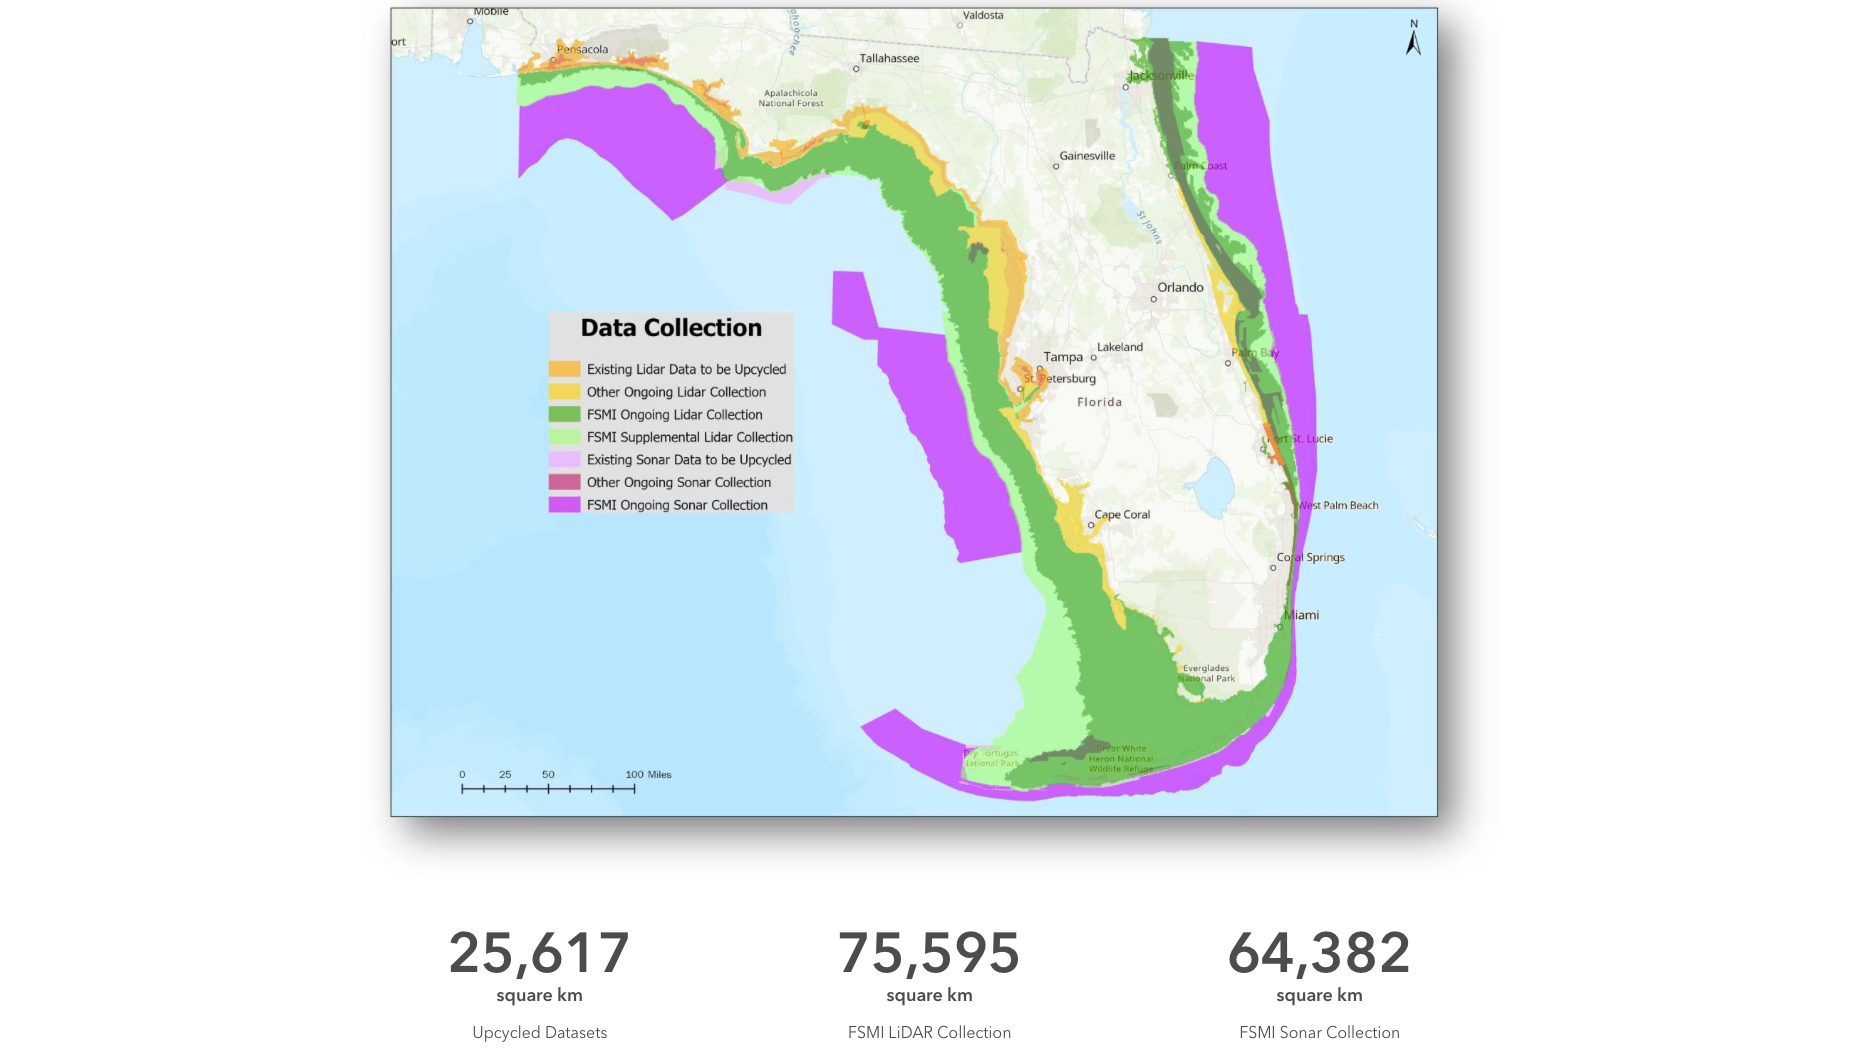
The collection of lidar data was completed ahead of schedule and is currently undergoing processing. Sonar data collection is set to wrap up in March 2026, with all deliverables scheduled to be approved and deliverables scheduled to arrive by June.
The five-year project timeline is on track and running smoothly.
“All along, Alex [Reed] stressed to us that this can’t be a scientific data collection program just for the sake of it,” Jackson said. “Next year we are looking at what derived products and formats users need and how we’re going to effectively deliver those products to them.”
Jackson anticipates strong interest from coastal communities, businesses, and researchers. The public data will be of value to international researchers and universities, other state mapping programs, and federal partners that support Florida initiatives. In addition, Florida’s seafloor data will support a greater understanding of the ocean floor to benefit resource management, storm surge forecasting and public safety, sediment transportation, environmental change, cable and pipeline routing, and more.
In Florida and around the world, mapping the deep is not just about exploration; it is about equipping communities with the geospatial intelligence they need to thrive in a changing world.
Learn more about how GIS is used for maritime charting for safe navigation and to protect the marine environment.