
October 22, 2024 |
Multiple Authors | Infrastructure
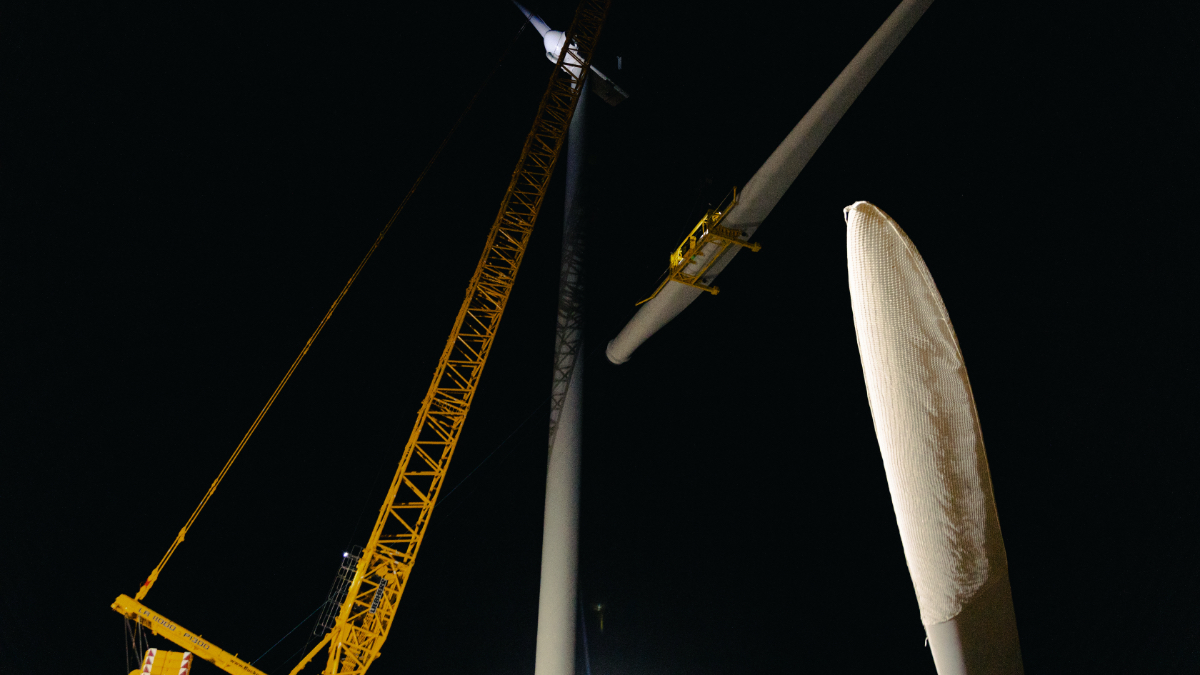
When Pattern Energy began construction on the SunZia Wind and Transmission project across New Mexico and Arizona, the numbers alone suggested the challenge ahead: 551 miles of transmission line connecting 916 wind turbines across three counties—the largest wind power facility in the Western Hemisphere. At peak construction, 2,000 workers would be spread across thousands of square miles of high desert. Once completed, the project will power 1 million homes with clean energy.
Traditional construction management approaches—clipboards, paper plans, weekly meetings—couldn’t coordinate work at this scale. From the project’s earliest planning stages, the project team recognized that enterprise mapping technology would be essential.
“We have so many people involved,” said David Janssen, project director at Pattern Energy. “We need to organize all of our data. We need to keep everyone up to speed with what’s happening with site activities.”
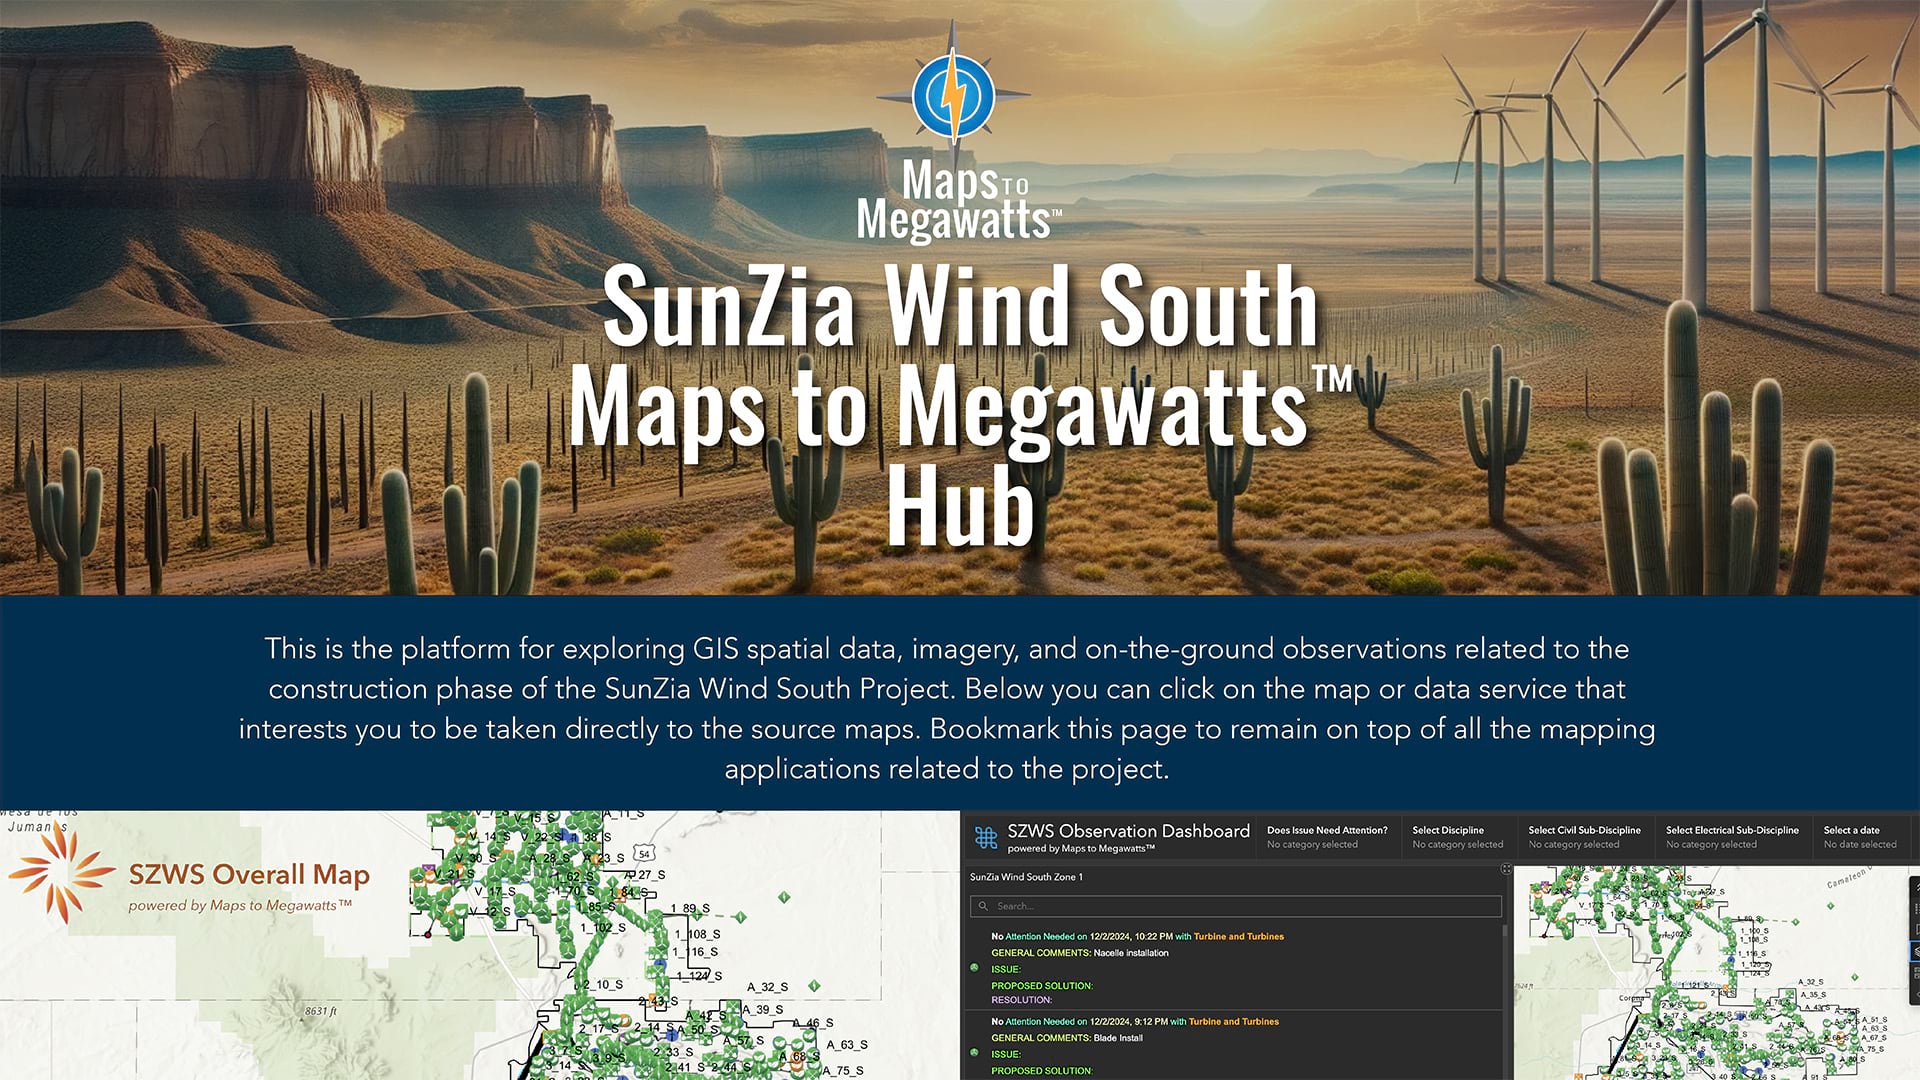
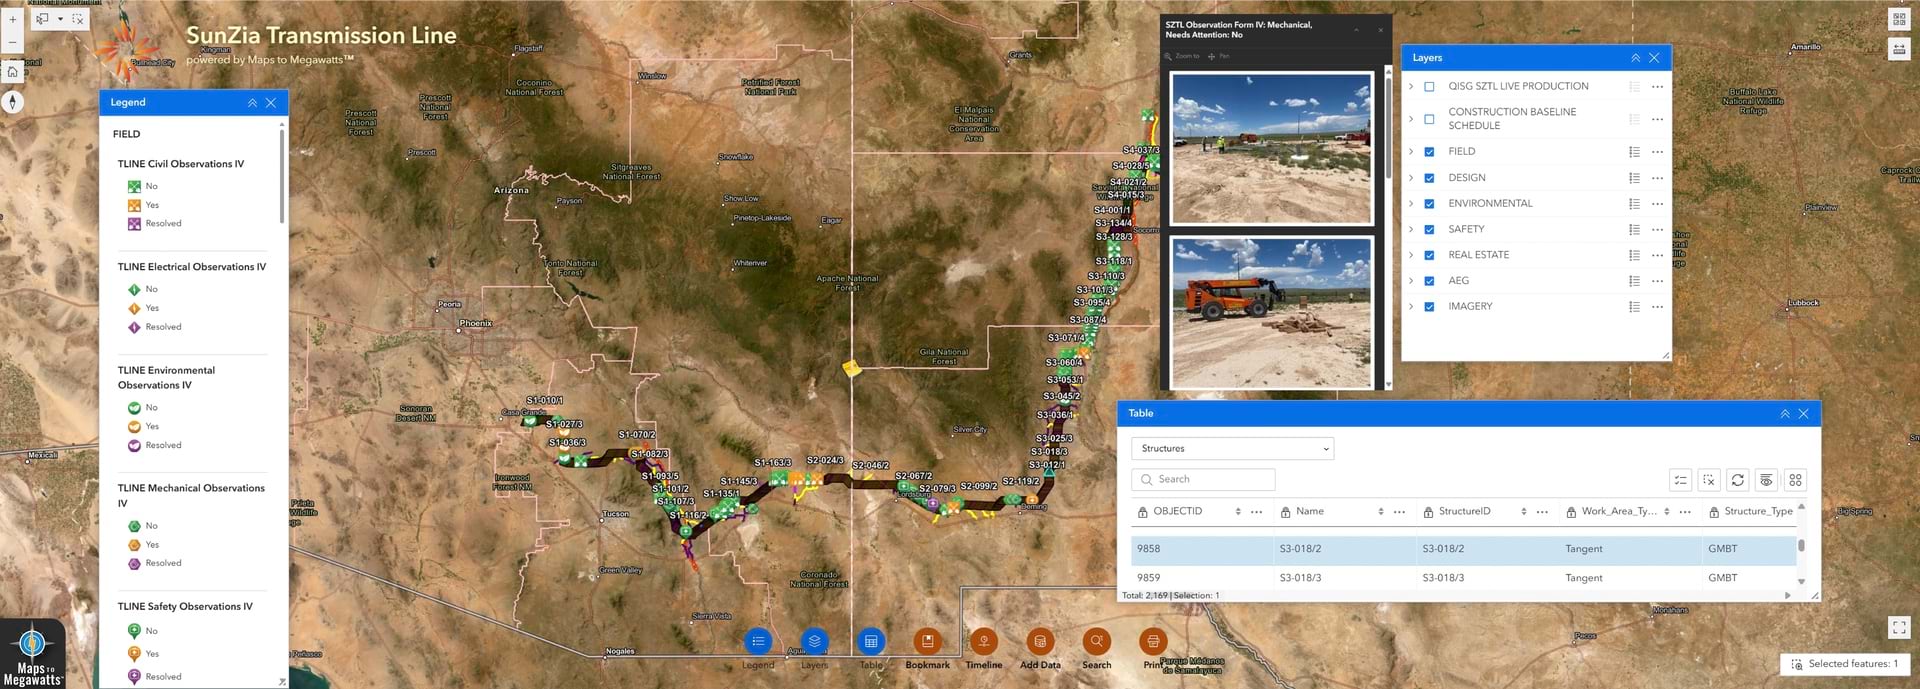
Pattern Energy worked with Aegean Energy Group, an Esri partner whose Maps to Megawatts solution is built on ArcGIS technology and designed specifically for wind, solar, and transmission projects from development through operations. On SunZia, the platform supported coordination across a range of project demands—from resource logistics and environmental compliance to permitting and equipment tracking—with dozens of users logging in daily to update construction status, log inspections, and share field observations in real time, giving both the owner and contractor a shared, live view of progress across 500-plus miles.
Jake Sarno, transmission line construction manager for Pattern Energy, has worked in utility construction for years. He has seen the evolution from paper maps to digital systems, but nothing prepared him for what Maps to Megawatts could do at SunZia’s scale.
“There’s no way whatsoever we could have pulled this off without mapping,” Sarno said.

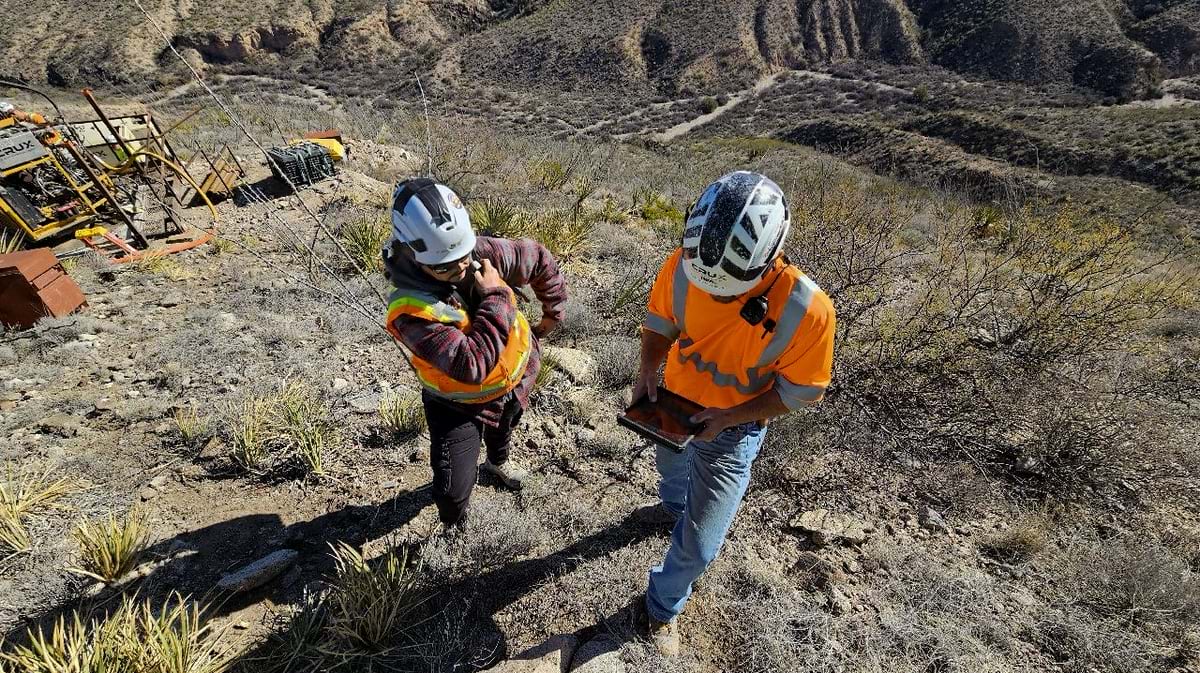
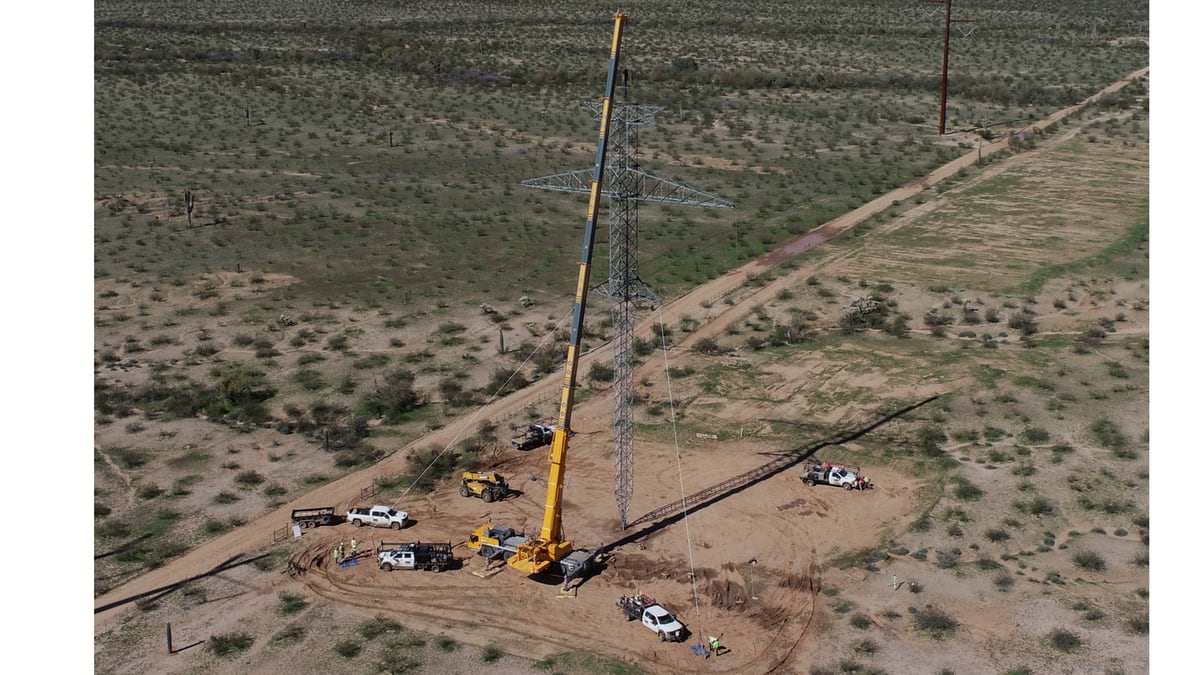
Field crews use the system to navigate sites, update structure status, document challenges, and flag safety concerns in real time. All project stakeholders can see complete data history for each of the 2,163 transmission structures.
“There are records and updates associated with any structure that we roll up to at any given point during the project, during construction, or even postconstruction,” Sarno said.
“You can click on it; go through the layers; and find any issues that structure had, problems that arose on the ground, or everything that went well. It’s a one-stop source for information, and it really helps to move the project along.”
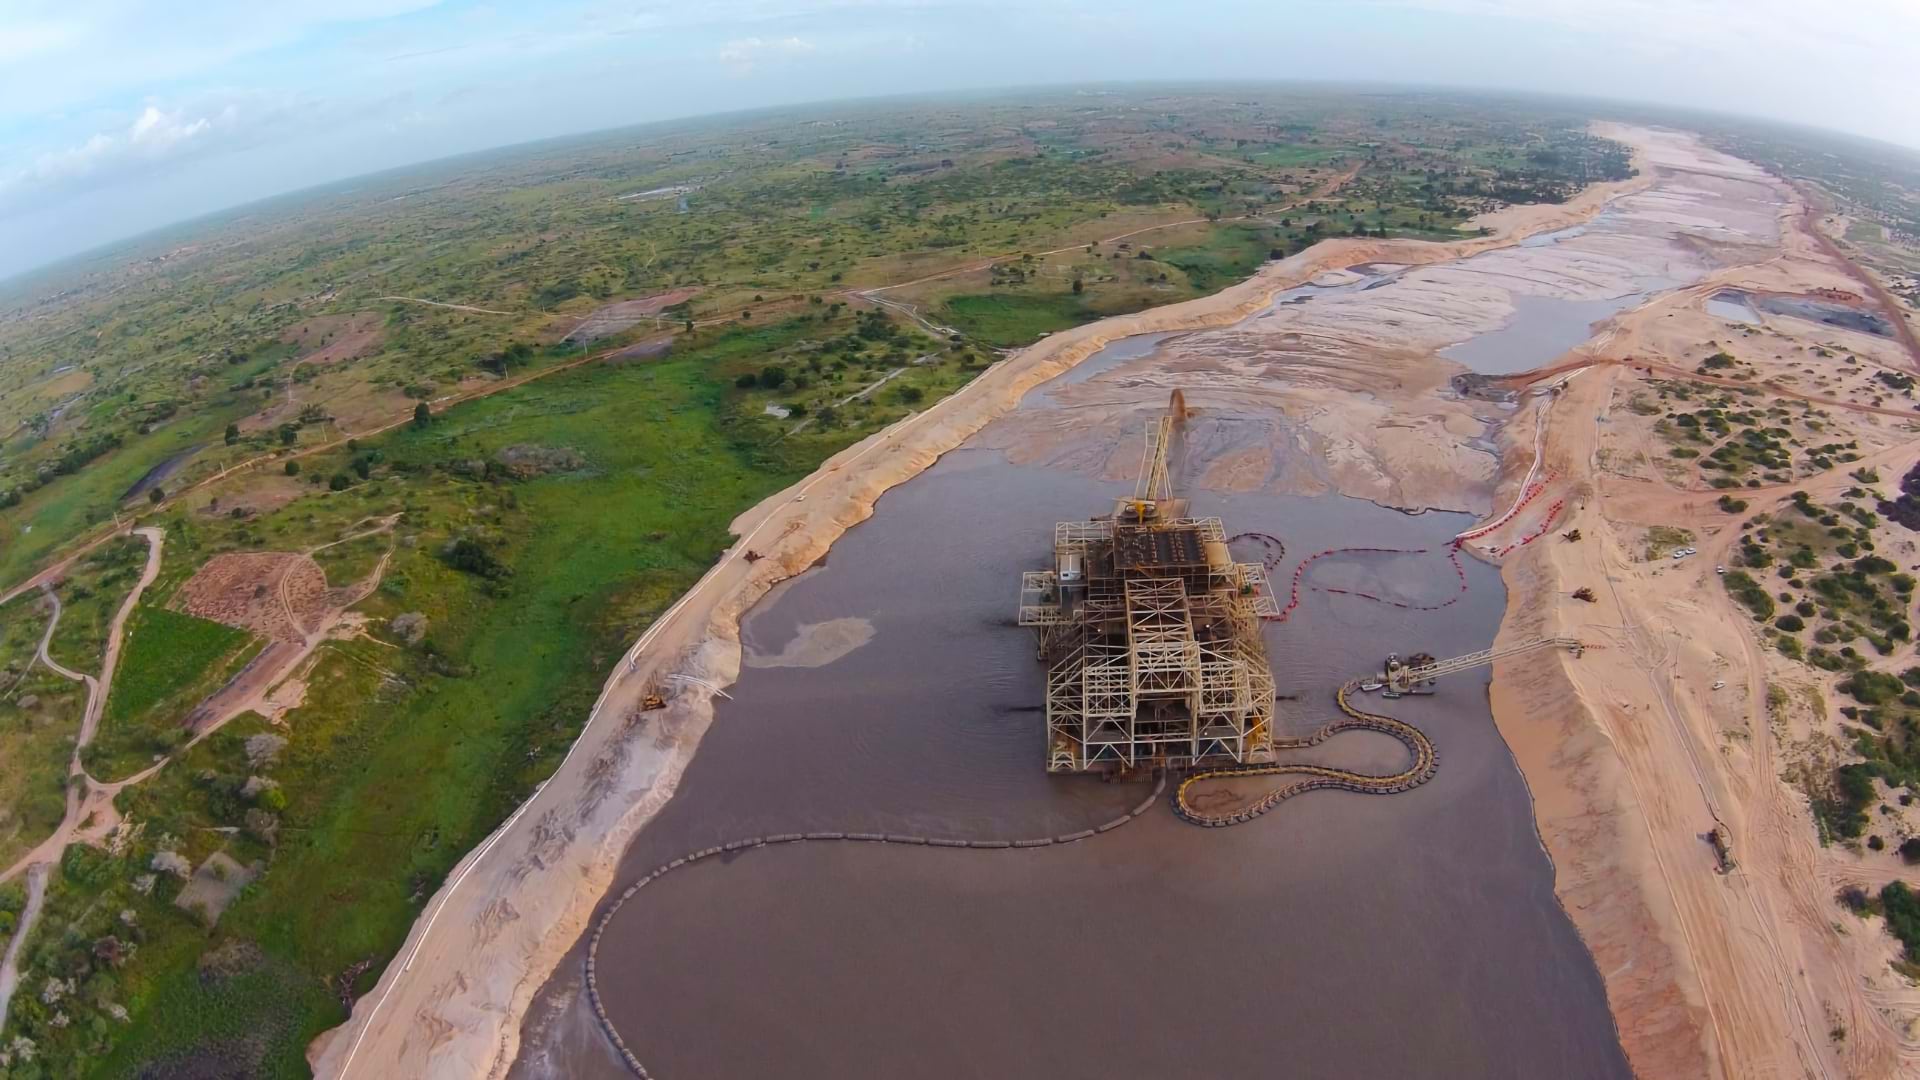
The scale of SunZia created logistical puzzles that traditional methods couldn’t solve efficiently. Consider water management: The project required water for dust control, and mixing concrete for turbine foundations.
“We’ve been using more than three dozen different water sources across the project,” Janssen explained. “The maps helped us optimize which sources to use based on price, availability, capacity, and driving distance to work locations.”
Teams calculate optimal routes on shared maps, factoring in road quality and distance—producing real cost savings on water and fuel for truck trips across the project.
Equipment logistics presented similar challenges. Components arriving by rail needed tracking and routing to correct locations across the massive site. “We use our maps and our data to connect each other with what’s happening with all those events,” Janssen said.
The mapping capabilities proved critical for environmental compliance—a complex challenge given SunZia’s scale and extensive federal permitting requirements.
“SunZia is an environmental project wrapped in a construction project,” Janssen said, noting the extensive permits required for work on federal Bureau of Land Management (BLM) territory. Each permit carried specific requirements that varied by location, time of year, and type of activity.
Eric Finke, Pattern Energy’s manager of geospatial systems, built geographic information system (GIS) applications that made compliance manageable by giving project planners a holistic view.
“We’re looking at the land use—everything that we need to do to deal with landowners and accommodate them throughout the project—to try and keep the integrity of the ecosystem as intact as we can as we go through the process, and do whatever remediation that we need to do,” Finke said.
Maps guided remediation efforts—the careful transplanting of native species like saguaro cactus displaced by construction and monitoring raptor nesting across the project area.
“We have several detailed dashboards set up that track the reproductive cycle, from mating to egg laying to young flying from the nest,” Finke said, “just to make sure we don’t disturb areas where we shouldn’t be.”
Using location-sharing features, workers’ devices automatically alert them when they enter sensitive areas near a bird nest or an archaeological site.
All of that species data is being shared with university researchers.
“We were able to dually purpose the data that we are required to collect,” Finke said.
The data includes records of when and where birds nest, species identification and counts, recurring sightings—information collected across thousands of square miles over several years. This scale and duration provides researchers with baseline information on raptor populations, migration patterns, and habitat use that would be difficult and expensive to gather through traditional field studies.
Understanding how species respond to infrastructure development also helps improve future project designs and mitigation strategies.
As the project moves to operations, the team will keep collecting ecosystem data while maintenance crews use established road networks and routing to avoid disturbing sensitive habitats.
“There’s going to be a continuing need to observe the wildlife in the area and make sure that we mitigate impacts,” Finke said. “It’s an ongoing collaboration and we’re excited to be part of it.”
Map-based collaboration extended across the many disciplines and organizations involved in SunZia.
Ron Baker, head of Quanta Infrastructure Solutions Group’s work on the transmission line, said that instead of the typical tug-of-war between contractor and owner, GIS allowed everyone “to be on the same side of the rope, pulling together.”
This collaborative approach extended to regulatory agencies. Rather than wade through written reports, BLM regulators could view the map to see exactly what was happening on the ground. Shared project maps updated daily with drone imagery and field data streamlined what could have been a time-consuming approval process.
The project’s geographic change request process brought together legal, environmental, design, and construction representatives each week to review proposed changes. Each request was mapped, reviewed by all stakeholders, and tracked from beginning to approval. For changes on BLM land, the visual documentation made requests clear and responses faster.
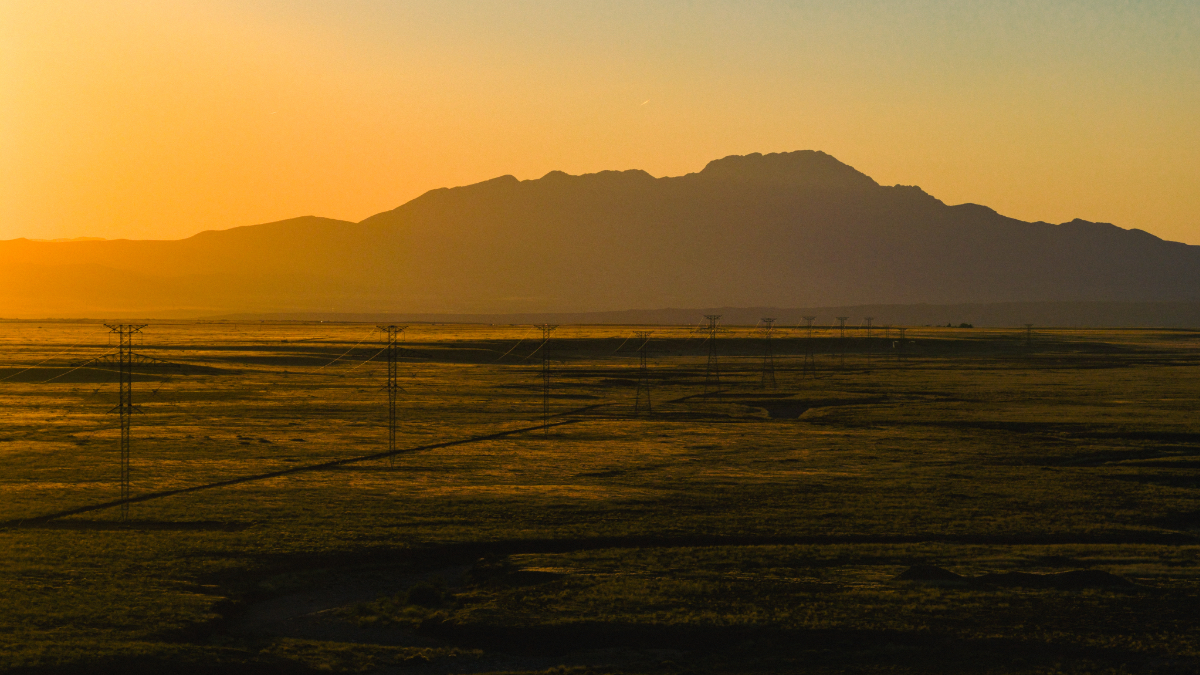
The transmission line itself became a data network. Fiber-optic cables run through the optical ground wires that protect the line from lightning strikes. These cables connect the two High-Voltage Direct Current (HVDC) converter stations—one in New Mexico, one in Arizona.
These cables enable real-time monitoring of every component along the transmission route.
“Our operations control center will be able to see all the wind turbines that are feeding into it and how much power is coming in,” said Todd Harrison, site construction manager at the New Mexico HVDC station for Pattern Energy. “They’ll be able to estimate losses between the amount of power coming from the wind farm, coming through here, going down the transmission line, and coming back out on the grid.”
The energy performance system lives alongside Maps to Megawatts. Together, they provide a full picture of operations and catalog years of institutional knowledge on construction.
Operators will see every inspection, every component installed, every issue encountered and resolved. Managers can locate serial numbers for parts that might need replacement. Maintenance crews will have access to data about each specific structure—what components are there, what tools or parts they’ll need before traveling to a site.
“We’ve organized all of our data,” Janssen said. “Everything we learned building this project, all the information about how each structure was built, what worked and what didn’t—it’s all there in the system for whoever needs it next.”
Over the three-year construction timeline, Maps to Megawatts evolved to incorporate more capabilities as project needs emerged.
Location sharing expanded to more teams in the field, and geofencing kept crews from treading on environmentally sensitive areas. Another feature allowed teams to trigger notifications and workflows based on field conditions—when certain observations were recorded, the right people were automatically alerted.
With Excel integration, project managers could work with observation data and construction trackers in familiar spreadsheet interfaces, building the formulas and pivot tables they needed without leaving their existing workflows.
Another feature automated data entry across multiple contractor and subcontractor systems—relieving crews from the tedious work of entering the same information into various systems. The integration also gave Pattern Energy cohesive visibility across all activities.
SunZia is now crossing the finish line. Turbine commissioning began in April 2026, with commercial operations expected by July 2026. The lessons from concept to completion extend to other energy projects—especially the multiple data center projects planned across the US. Maps will be vital for communication and collaboration, providing a shared visual language.
“Mapping has taken a leap with this project,” Janssen said. “We mapped things we’ve never mapped before because of the complexity and scale of this project.”
The success of SunZia shows how technology can manage complexity while enhancing human expertise. Safety specialists, environmental monitors, civil engineers, electricians—each added their knowledge to one shared map, creating a collaborative intelligence no individual discipline could achieve alone.
For Sarno, the value is clear: “I continuously look at Maps to Megawatts. That is where I can acquire most of the information I need to get to in meetings or share with other parties. It’s a one-stop shop for me, and it makes my life a lot easier.”
Learn more about how infrastructure managers apply GIS to plan, deliver, and operate projects and networks.