



September 9, 2025 |
Ryan Lanclos | Public Safety
August 13, 2026
As US cities and counties confront an increasingly complex scope of work—from disruptive weather events to aging infrastructure—planners need quick and precise data for decision-making. When they can see this data on a map, they can design and build for resilience.
It’s an approach that’s taking hold across the country, powered by maps made with geographic information system (GIS) technology. GIS maps are helping leaders and planners see hidden risks and opportunities within critical networks—from roads and housing to energy, water, and IT systems.
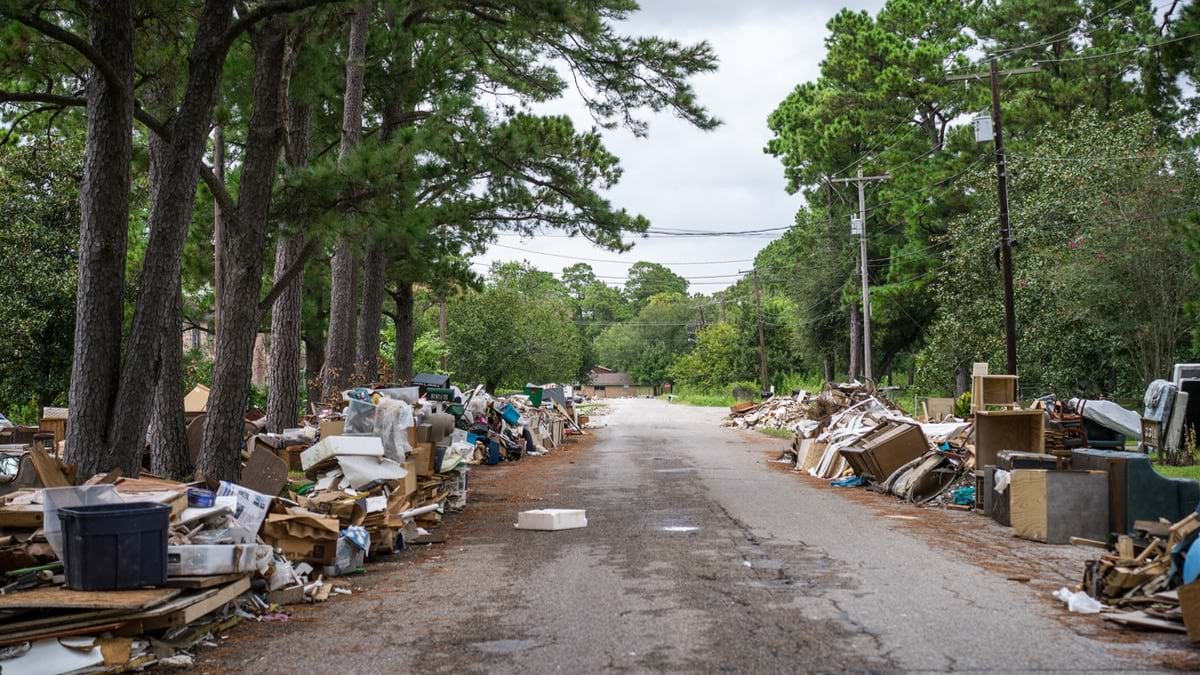
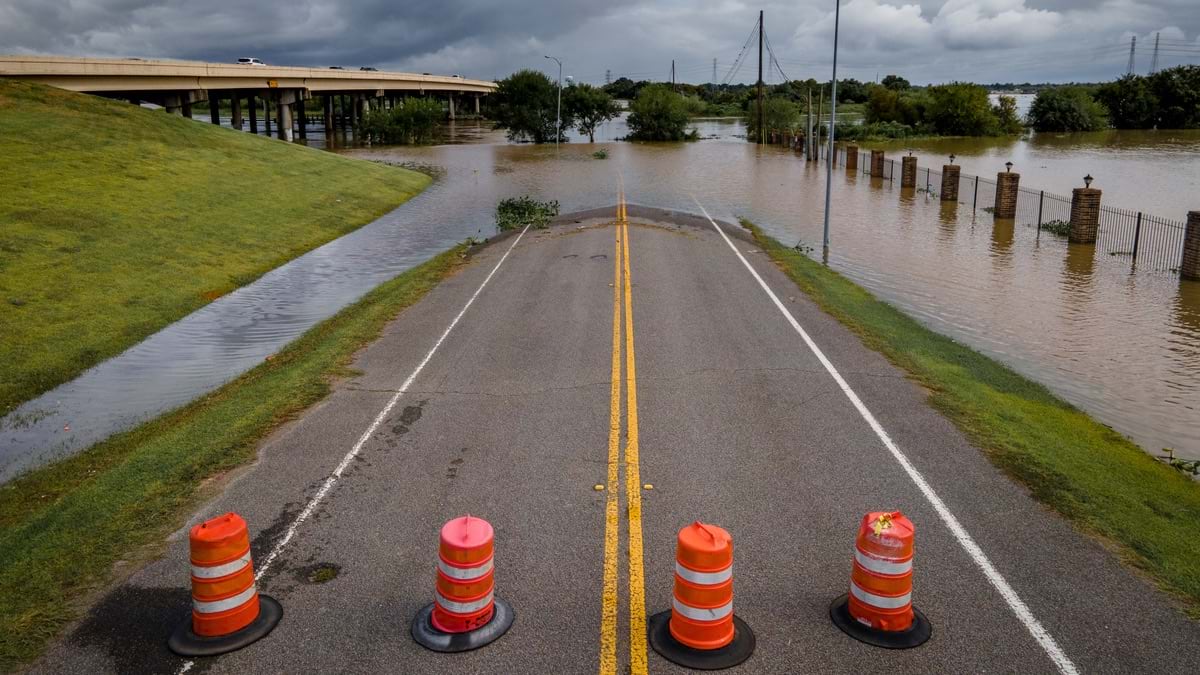
When Hurricane Beryl hit Houston in 2024, that single event sent ripples across the region. Power outages caused compounding disruptions, darkening homes and halting water systems as well as some hospital operations and communications.
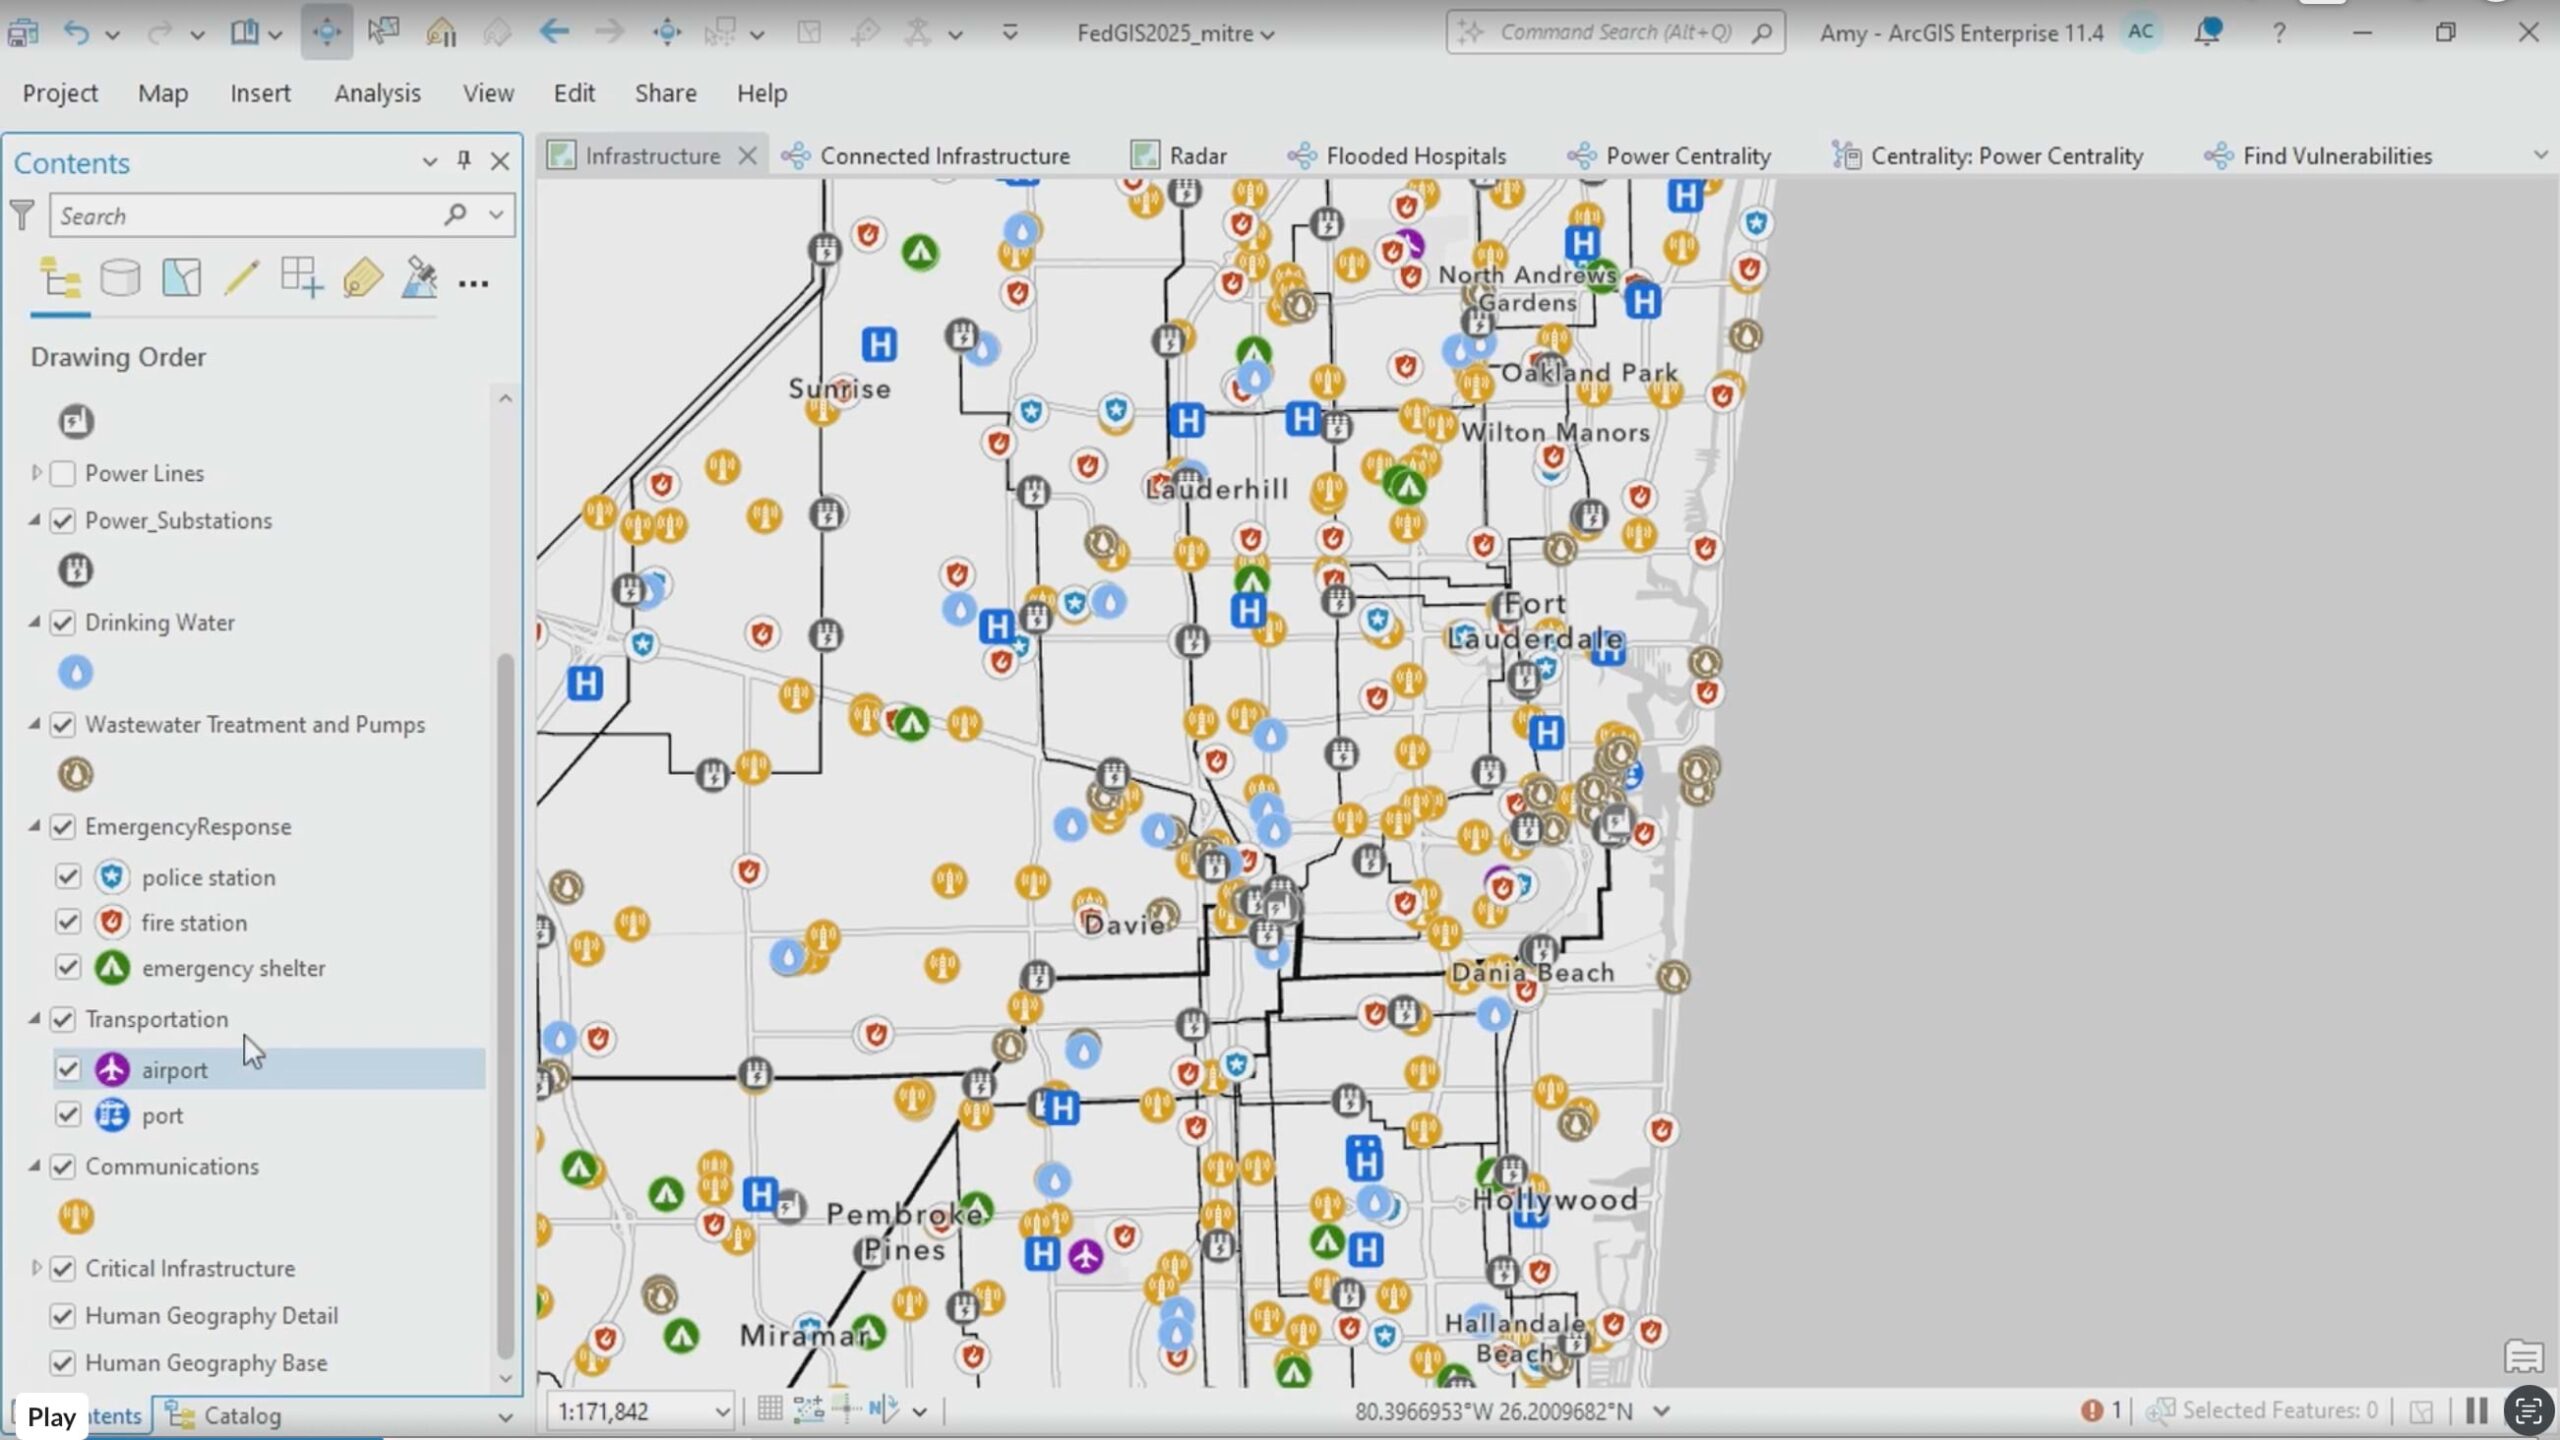
Today, Houston planners and emergency managers can map and model critical networks to anticipate cascading failures and prioritize investments for the greatest impact. Aiding the effort is nonprofit organization MITRE and its nationwide mapping and research initiative known as Project Homeland. With six federally funded research and development centers nationally, MITRE partners with government agencies and private companies.
Rather than viewing power grids, water treatment plants, hospitals, and emergency services as isolated entities, planners can look to GIS maps and spatial knowledge graphs to understand how individual systems affect one another. They can quickly uncover the most critical nodes in a network—areas susceptible to triggering widespread disruptions.
While many communities are developing strategies for shoring up aging infrastructure, Los Angeles County recognized that resilience would require a new paradigm.
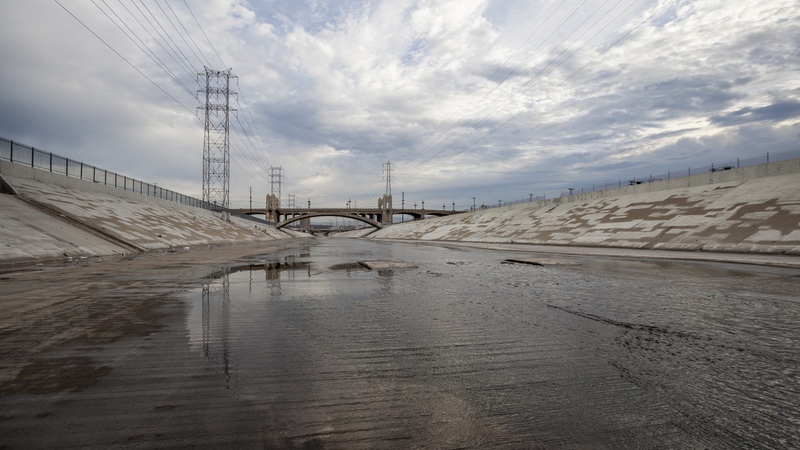
Powerful storms bring an average of 15 inches of rain per year to the otherwise drought-prone Los Angeles area. Planners wanted to capture some of that water to meet community needs instead of letting billions of gallons wash into the Pacific Ocean.
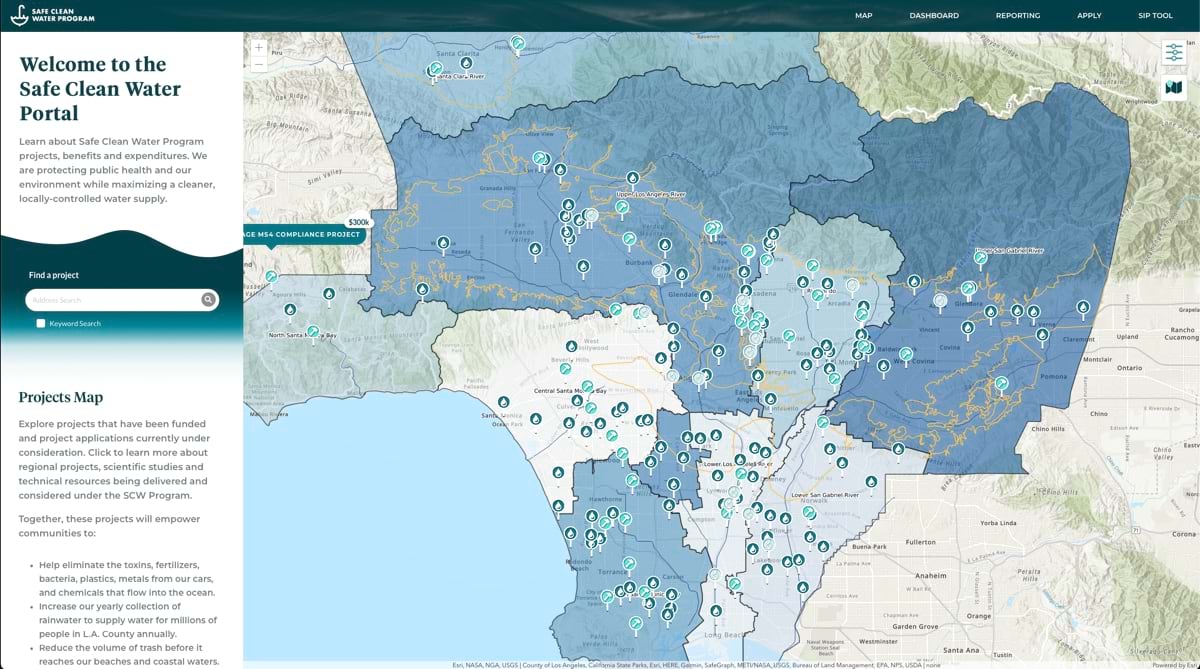
The county’s Safe, Clean Water Program uses GIS maps to track and manage hundreds of projects designed to capture rainwater. This includes green infrastructure such as infiltration basins, rain gardens, bioswales, and wetlands as natural ways to collect and filter water. The methods also reduce urban flooding, restore wildlife habitats, and create healthier public spaces.
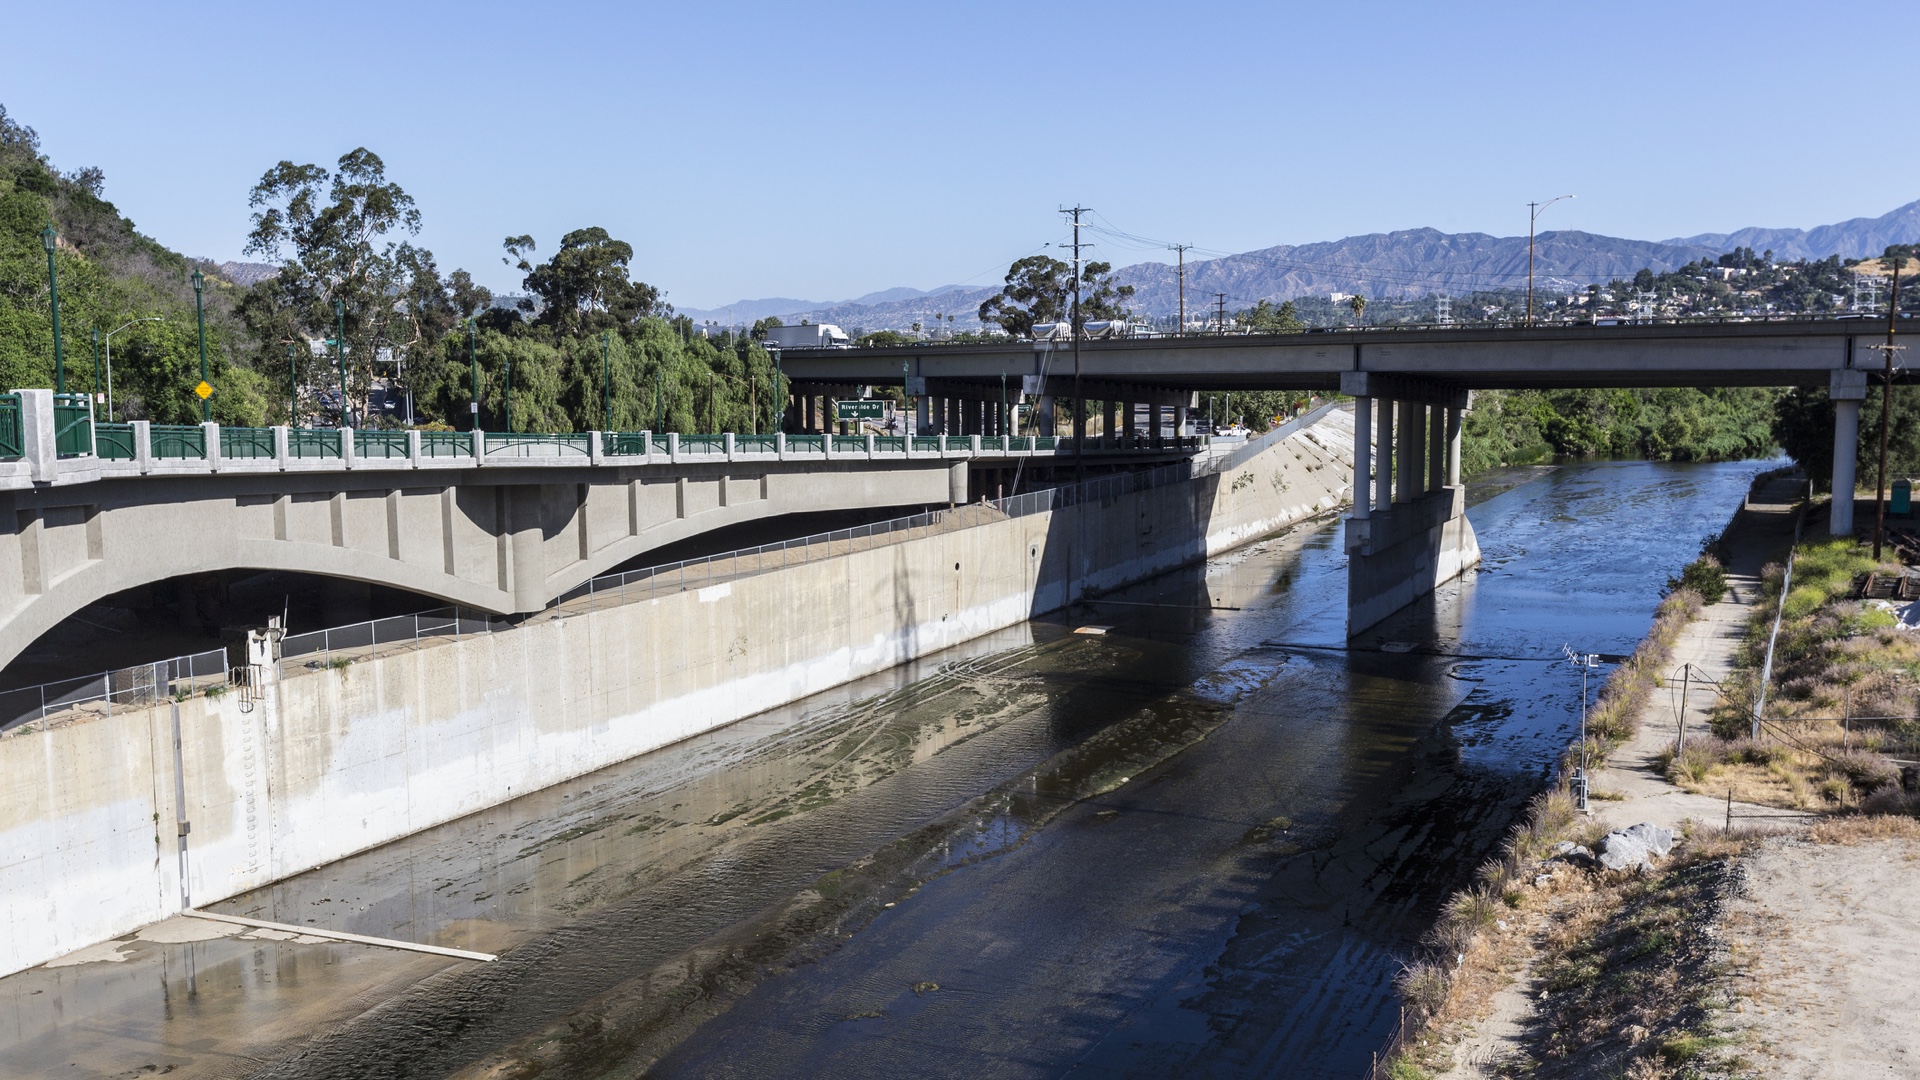
LA’s plan combines these natural solutions with built systems. Gray infrastructure, like concrete and steel storm drains and underground cisterns, help shore up network reliability and capacity during peak use. Together, natural and engineered infrastructure create a dynamic network that supports neighborhood revitalization and makes places more livable.
Using GIS to manage, report, and track stormwater projects, county analysts can ensure equitable attention across the service area and prioritize based on need. They can also measure the performance of each system.
Through its approach to infrastructure development, LA County highlights critical pillars of smart growth: equity, environmental stewardship, and flexibility and redundancy built into designs.
A cyberattack in Durham, North Carolina, in 2020 inspired a strategy for modernization within the city’s regional transportation planning organization. The attack took critical systems offline, including applications essential for transportation planning and coordination.
The disruption underscored a pressing reality: Resilience must extend beyond physical assets to include the digital systems that keep cities running. The Durham-Chapel Hill-Carrboro Metropolitan Planning Organization decided to migrate its tools for managing infrastructure networks to a secure, cloud-based GIS environment. The change supported recovery from the attack and delivered a more resilient technology foundation. Now the agency has a full-system backup, making future data recoveries less challenging.

For the city, cloud-based GIS tools also remove the burden of maintaining servers, managing security patches, and safeguarding vital backup files. Planners and analysts can spend more time getting insights from their data with the additional protection over system security. These include automated backups, scalable security, and built-in disaster recovery to reduce the risk of future disruptions and ensure continuity for critical planning functions.
Regional agency partners have also integrated into the cloud environment so they can access insights and gain spatial awareness without friction.
What started as a cybersecurity crisis evolved into a more resilient IT infrastructure network strong enough to withstand changing conditions.
For many years, urban planners have had to work from incomplete pictures—because of siloed data, outdated maps, and systems that couldn’t speak to each other. They’ve had to make decisions without complete context. Service or safety gaps would remain invisible until something happened—a storm hit, a pipe failed, a cyberattack exposed a fragile operation.
That reality is changing with advances in GIS technology.
GIS knits together data on terrain, systems, networks, and social fabric so cities and counties can uncover vulnerabilities. Planners can see and act before it’s too late. They can trace how a flooding would affect a hospital’s backup power supply. They can see where environmental risk and economic hardship converge in the same neighborhood because of inequitable development. And now they can predict where a cyberattack could impact an energy network. This is the modern approach, using location intelligence to design—mitigation and recovery measures before a crisis.
Learn more about how GIS helps communities prepare and adapt by mapping and analyzing hazards and human vulnerabilities.