January 7, 2020 |
Greg Milner | Mapping
Carbon garners a lot of attention in the fight against climate change, but scientists are equally troubled by methane. This colorless, odorless gas prefers to keep a low profile, escaping from aging infrastructure and fossil fuel production. The Environmental Defense Fund (EDF) is in the midst of a decade-long project to reveal methane as an outsized contributor to global warming. EDF researchers started by gathering street-level data, using a geographic information system (GIS) to display and analyze findings.
Local surveys, such as one conducted in Boston in 2011, use mapping to highlight methane leak hotspots. Through their sensing and mapping work, EDF teams discovered that most leaks in cities occurred where pipes were more than 50 years old. Often city officials only have a rough idea of the precise location of underground infrastructure, including pipelines, and GIS helps bring this situation into deeper focus.
Last year, EDF and Colorado State University scientists released a study that used vehicle-mounted methane detectors, pipeline maps, and data provided by utility companies to assess the entire US natural gas distribution network. The study’s methodology used ArcGIS Pro software to reveal an estimated total of 630,000 leaks.
Methane is a silent killer—until it’s not. Scientists know methane as CH4. For the rest of us, methane is most familiar as the major component of natural gas.
In the public perception of climate change drivers, CH4 lives in the shadow of CO2. Although CO2 remains in the atmosphere for more than a century, 10 times longer than methane, the latter gas packs a bigger punch. As a 2013 study put it, methane is “more potent molecule for molecule” than CO2. In fact, it’s “more than 20 times as potent,” according to a recent report in Nature. Over a 20-year period, 1 megaton of methane causes as much greenhouse damage as 85 megatonnes of CO2.

Methane also poses an immediate risk from explosions caused by leaks in gas delivery networks. Incidents and accidents along distribution lines that deliver natural gas to homes and businesses cause hundreds of injuries and deaths each year.
For reasons related to the precise dangers of methane, the problem can be difficult to grasp. The gas is both a long-term cause of climate change and an immediate source of explosive events, and its sources are both natural and human-derived.
Natural gas extracted by the fossil fuel industry comes from organic material buried deep in the earth, and drilling releases this thermogenic gas to the surface. Bacteria in wetlands, landfills, sewer systems, and even cow manure, creates biogenic gas when breaking down organic material. These natural sources account for one-third of all global methane emissions.
Methane generated by human activity has skyrocketed since the Industrial Revolution, with the amount of methane in the atmosphere more than doubling and causing an estimated 25 percent of all global warming.
One overarching factor that complicates any assessment of the methane problem is how these categories—human-made vs. natural, long-term threat from climate change vs. the immediate danger of explosions—combine and overlap.
For example, cows naturally release methane from methanogens, one-celled organisms in their digestive tracts. The cattle industry has turned this natural source into a major contributor to greenhouse gas emissions, compounded even more by biogenic gas generated from the settling ponds used to process manure.
Scientists, researchers, and industry experts use GIS to cut through the ambiguity and better understand the interconnectedness of the methane problem. The maps generated by GIS provide visualizations of where the problems are located, including the complicated contexts around methane seeps and leaks.
Maps generated by the US Department of Transportation’s Pipeline and Hazardous Materials Safety Administration reveal hotspots where pipeline incidents are most likely to occur. This countrywide resource shows both large extraction sites and the vulnerable infrastructure that delivers the energy source to homes and businesses.
While the problem is a national and global one, incidents are local. One day in 2018, simultaneous natural gas explosions in the Merrimack Valley of Massachusetts caused as many as 80 individual fires, displacing 30,000 people and killing one person—a clear illustration of methane’s danger.
Since 2014, explosions of methane in thawing permafrost have created enormous craters in sparsely populated Siberia. This source of biogenic methane is the result of thawing from climate change, driven in part by methane caused by human activity. The thawing process leads to more climate change—a classic feedback loop where warming causes changes that lead to even more warming.
Scientists studying methane in the northern permafrost zone use GIS to help understand the many variables and inputs. The authors of a recent study, published in the journal Geosciences, combined data on sediment, soil, and vegetation to create a “GIS-oriented landscape map.” The visualization tool helped the researchers conclude that methane content is higher when areas become wetter. The methodology for a more recent Geosciences study on the craters in Siberia involved a combination of GIS and satellite remote sensing. The goal is to detect and assess diverse types of land surface change to potentially mitigate risks.
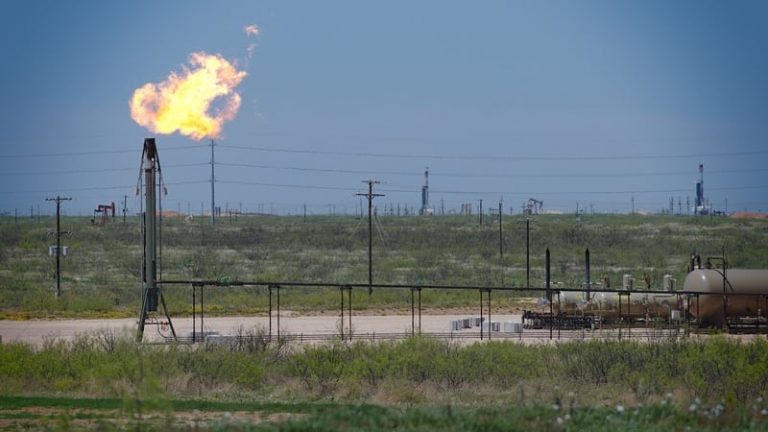
Despite the growing release of methane from thawing, fossil fuel production remains the largest component in the methane problem. In its most recent Methane Tracker report, issued earlier this year, the International Energy Agency estimates that oil and gas operations contributed 70 megatonnes of methane to the atmosphere in 2020—“broadly equivalent to the total energy-related CO2 emissions from the entire European Union.”
Sometimes methane release comes as a result of major events. Satellite data determined that a 2018 blowout at a gas well in Ohio leaked more atmospheric methane in 20 days than most European nations produce in a year. Mostly, however, the damage accumulates from many leaks spread over wide areas.
More recently, researchers at EDF and other organizations have made extensive use of satellite remote sensing and GIS to obtain a broader picture of methane leaks. Working with the European Space Agency, EDF analyzed data from 11 months of observing oil and gas operations in North America’s Permian Basin, discovering enough wasted methane to power two million US households.
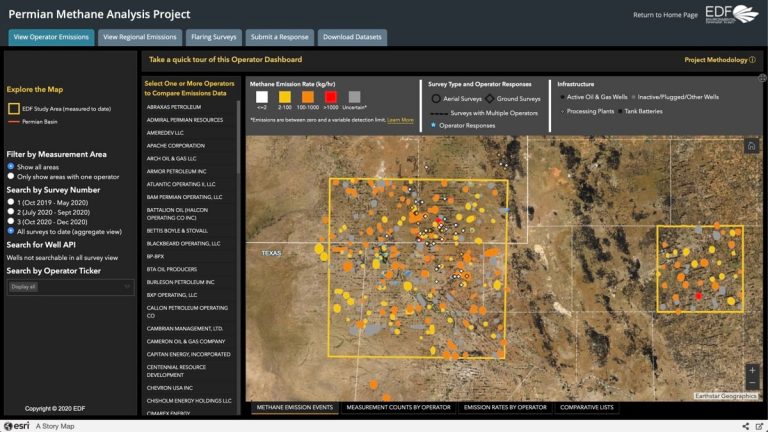
EDF presented data from its Permian Methane Analysis Project as an interactive GIS map. One powerful aspect of the map is how it was able to identify and name individual polluters. Its larger value is the way it provides geographic context to the methane problem, revealing the complexity and ubiquity of the problem in just one area of the world.
The context that maps provide is the foundation for any major reckoning of the methane problem—and any serious program to fight it. With growing momentum to combat climate change, the use of advanced technologies like GIS to sense and map natural and human-made methane emissions is moving beyond assessments to find and mitigate leaks and seeps.