April 23, 2018 |
Brooks Patrick | Urban Planning
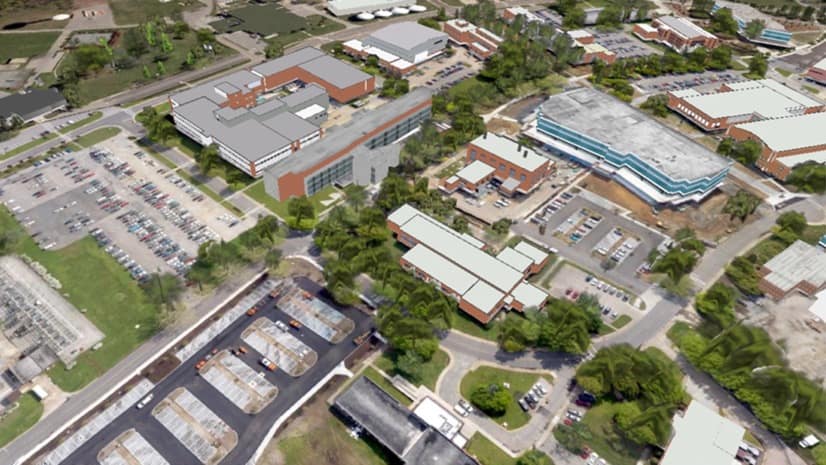
NASA’s Langley Research Center got its start in the early days of aviation. Scientists at Langley expanded their aeronautical research to testing supersonic flight and space hardware, including the Apollo Lunar Module. The 764-acre campus houses an array of testing facilities including 40 wind tunnels used to study and improve aircraft and spacecraft safety and performance.
For nearly 30 years, a dedicated team of technologists worked to build the center’s geographic information system (GIS) to help manage operations and maintenance. They created a detailed map of the entire center, including the interior and exterior of the more than 200 facilities. Tailored applications use the map as a backdrop for everything from daily maintenance and safety to flood prevention and sustainability.
“We have 300 curated applications, and the apps get more than five million hits a year from more than 3,500 users,” said Brad Ball, GIS team leader.
The GIS team has taken the concept of creating a digital twin of the center to heart. They precisely measure and thoroughly collect data, including intricate details of underground utilities. In a center full of engineers, this due diligence preceded wide adoption.
“We surveyed all of our visible features, all of our utilities, all of our roads, and then we backed that up with high-resolution aerial photography. We can compare the map to the aerial photo and they align exactly to where things are,” Ball said.
Once Langley’s GIS team established trust in the precision and accuracy of its maps and data, the calls for solutions began to pour in from other departments.
“We started to have people approach us for data to back up specific facility decisions,” Ball said. “Sometimes we had to roll up our sleeves and go get the data, but then the data would be sustained because people use it to back up their next decision and the decision after that.”
The GIS team now supports every branch of operations at the center. The ReVITALization office, which oversees a 20-year strategy for deconstruction of aging structures and construction of state-of-the-art facilities, uses apps the most. They regularly interact with 48 apps that address space management, real property management, and planning functions.
The broad use of maps and apps to deliver location-based information moves Langley to the forefront of GIS-based facility management.

The interior mapping effort began with the need to more efficiently allocate space within and across campus buildings. First, the team digitized paper floorplans. Next, they developed optimization algorithms to weigh facility needs for each department.
By 2004, the GIS team created a space allocation tool that was the first of its kind. Langley used the tool in its Reduce the Footprint program which adjusted the average office size from 190 to 125 square feet per person. The space allocation tool aided tough decisions on how to juggle the locations of more than 3,000 targeted personnel. Considerations include the amount of space required, proximity and synergy to various laboratories and research facilities, available power and water utilities, building security, proximity of key personnel, the need for new construction, and the cost of each scenario for comparison purposes.
“We recently added the inventory of elevators and stairways into our routing tools and this detail will be incorporated into the next-generation space allocation tool that’s under development,” Ball said. “Rather than move everyone to one floor to achieve desired synergy, the personnel can just climb the steps. This will save a great deal of expense, and it’s probably good for their hearts too.”
Langley achieved its relocation objectives for Reduce the Footprint, under time and under budget using the space allocation tool. Teams continue to rely on the tool to speed space assignment and avoid the usual politicking.
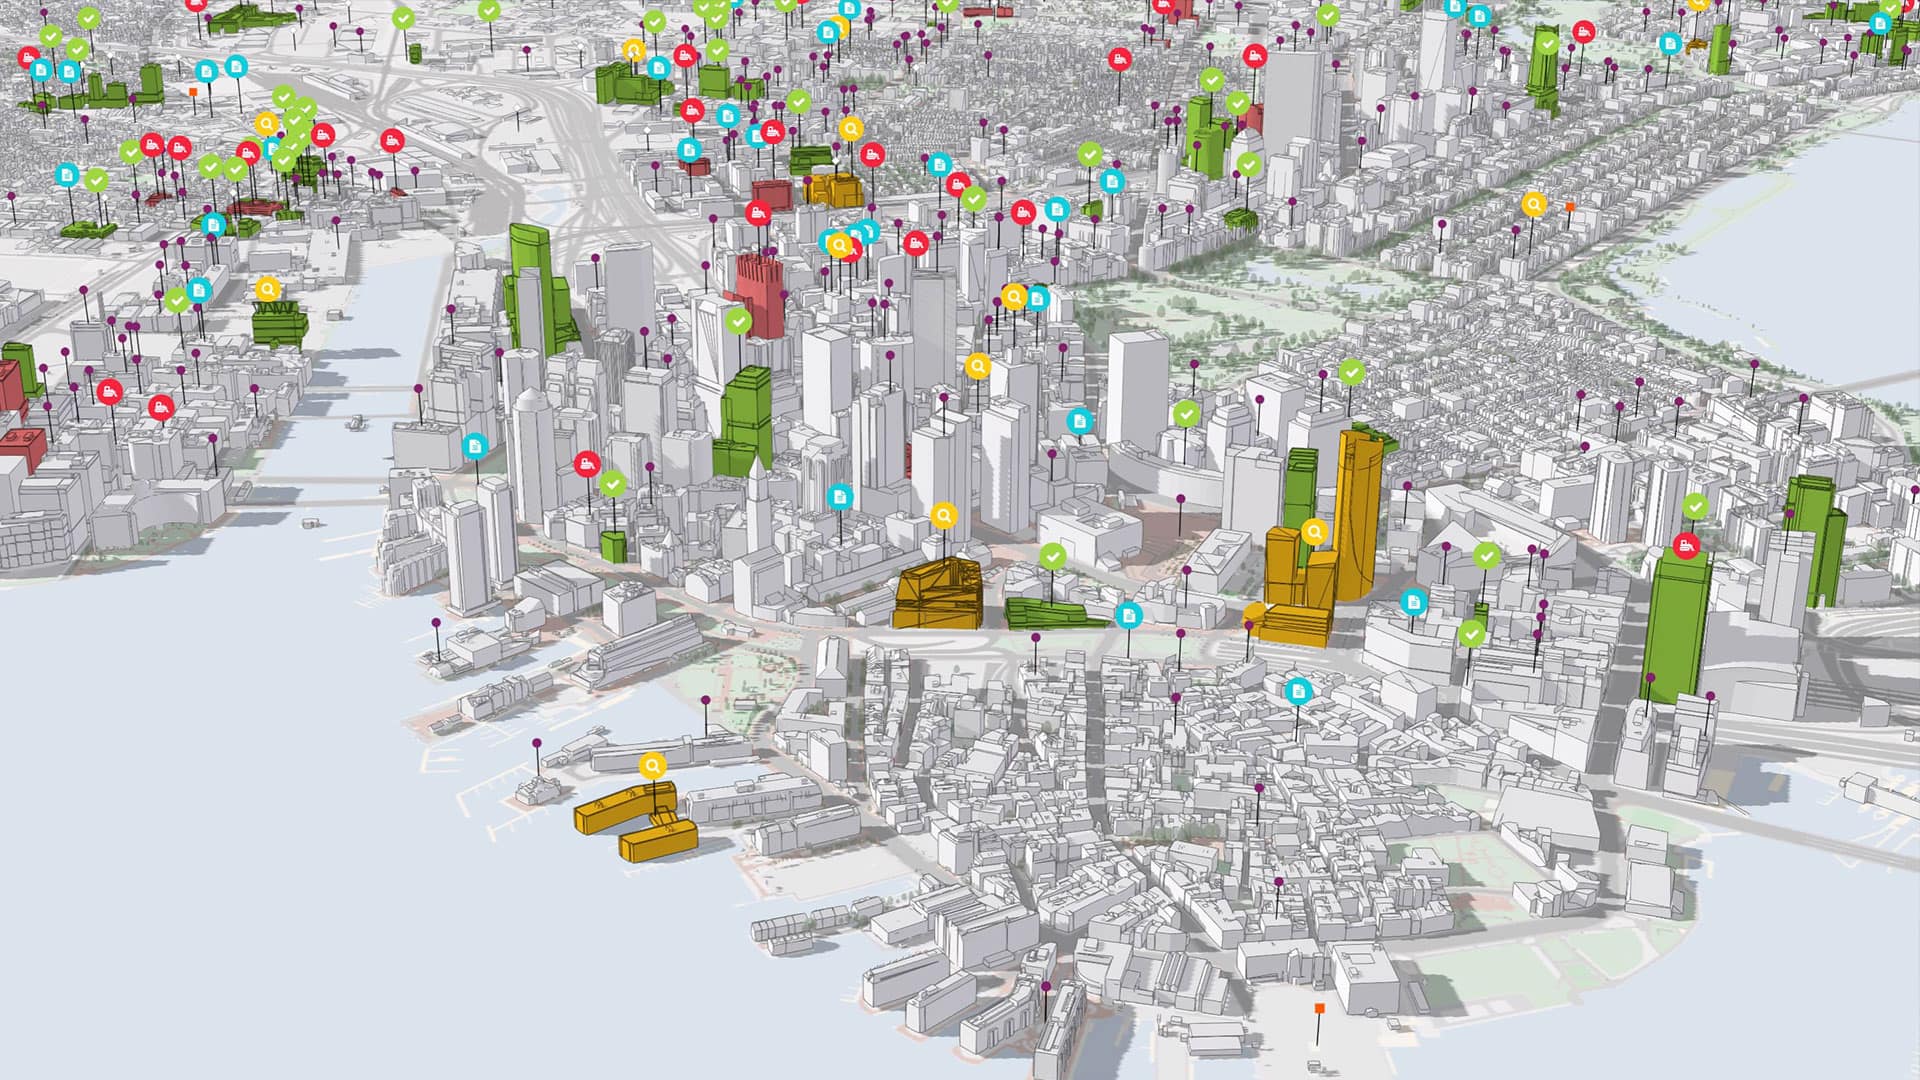
The next step for interior mapping moved best-fit floorplans from paper drawings to absolute accuracy via laser scanning. The scans informed 3D interior models using Building Information Modeling software. Now, staff at Langley begin every building project in 3D rather than 2D drawings.
“We’ve still got some of the old school folks that absolutely have to have a rolled-up paper drawing,” Ball said. “So, we’ve got to change that way of thinking as we move forward.”
Public Safety and Security
The 3D models inform many lightweight apps, such as the Locator app that guides maintenance staff to the right piece of equipment. They are working to expand the app’s functionality by adding multimodal routing to safely navigate personnel down roads, paths, and hallways—whether by car, electric cart, bicycle, or on foot.
“It will guide our maintenance staff to equipment rooms, but it will not route our scientists or administration personnel near dangerous machinery they’re not familiar with,” Ball said.
The map includes the precise 3D location of fire extinguishers and automated external defibrillators to assist emergency response personnel. It shows details of all ladders, catwalks, mezzanines, locks, safes, and critical infrastructure. After a recent accident, the 3D model informed an investigation without disrupting vital experiments.

Given Langley’s low-lying location, next to the Back River on the Chesapeake Bay, the center regularly relies on GIS to perform flood impact analysis and preparedness scenarios for weather events.
“Years ago, we took a look at updates to tidal elevations and we thought we had our map and our measurements wrong,” Ball said. “That’s when we discovered sea level change was real, and we adjusted our outlook.”
A new understanding of the center’s flood vulnerability led to a number of applications that factor in facility elevation. Center-wide planning guidelines require high enough elevation for new buildings. And, staff examined elevations of existing buildings as well as infrastructure to make sure that NASA’s critical programs stay out of harm’s way.
Vulnerability also fosters vigilance. NASA takes real-time measurements of tide height and land height. If flood response requires sandbags, the 3D model calculates how many are needed for each doorway.
“We’re working on the migration of various NASA projects and programs to more secure facilities,” Ball said. “In the interim, we’re putting in mitigating strategies such as dams on doors.”
Langley shared the technology with NASA headquarters for a standardized approach to storm surge prediction across all centers. Additional adoptees of the tool include the Johnson Space Center, the adjacent Langley Air Force Base, and a local municipality. Each reported a greater understanding of flood risks and depend on the tool for hazard mitigation planning.
Years of detailed data collection are paying off with no input going unused. Langley’s detailed view of facility information underpins competitive bidding for maintenance and operations. This ensures transparency when putting contracts out for bid and reduces contract padding, saving the center money.
“We know exactly how many square feet of carpet and linoleum they’re going to clean, and how many bathrooms and sinks,” Ball said. “We also know how many acres of grass of different types and how many linear feet of edging occurs around roads, buildings, and fences. This reduces the risk for us and our contractors, because everything is in black and white.”
Learn more about how GIS integrates campus and building information for improved facility management.