
February 21, 2019 |
John Beck | Public Safety
August 28, 2019
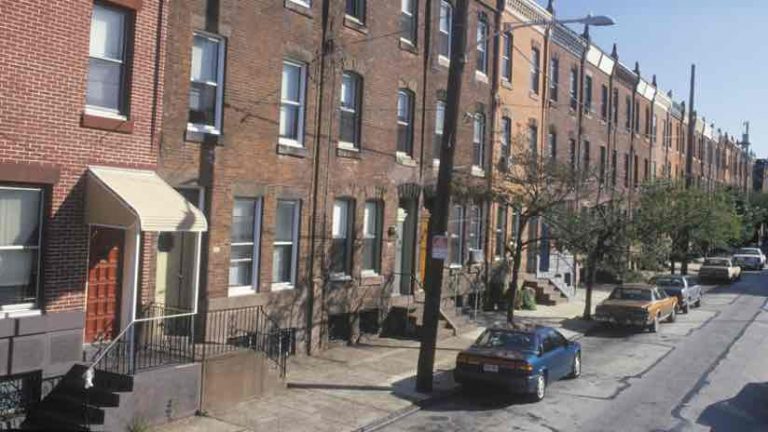
Like much of the country, Philadelphia battles an opioid crisis of unprecedented proportions, with residents sufferings from overdoses in record numbers. The epidemic surges in certain “hotspot” areas, notably the city’s Kensington neighborhood.
“Kensington is ground zero for the opioid problem on the East Coast, and one of the country’s biggest heroin markets,” says Kevin Thomas, director of research and analysis for the Philadelphia Police Department (PPD).
Law enforcement officers in Philadelphia tackle the problem by doing more than just racking up drug-related arrests. PPD uses location intelligence—through a geographic information system (GIS) that enables analytics and collaboration with other city agencies—as a key part of its response to the ongoing public health emergency.
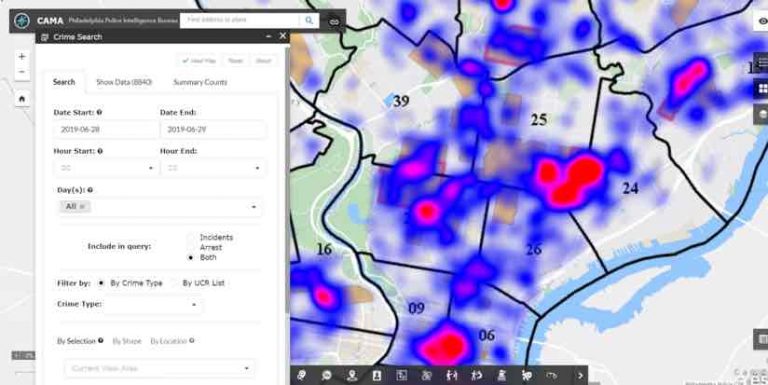
The team’s analysis takes several forms, including correlating the locations of overdoses. For example, most heroin sold on the street is identified by its “heroin stamp,” the images and icons dealers emboss on the bags they sell. PPD officers can trace the stamps responsible for geographic “clusters” of multiple overdoses, and tie them back to the originating street corner and drug organizations.
“We can track overdoses, so we have that data all in one place,” Thomas says. “We also built an application to track the stamps. Combining those two data-gathering efforts, and the intelligence that supports them, we can say ‘okay, these are the three corners that you need to send your police officers to shut down narcotics operations, because we want to tamp down that overdose spike.’”
Using GIS technology allows police to focus on the geographic locations where the epidemic is most concentrated. In this way, a seemingly intractable problem that can’t be solved merely by arrests becomes more manageable.
This work relates to a larger PPD initiative, Operation Pinpoint, launched earlier this year. The goal is to combine data-driven information from various sources with real-time, ground-level intelligence from officers on patrol. Pinpoint enforcement zones are selected based on data analysis. Officers use this analysis to plan when and where their outreach will have the most impact.
Determining Optimal Deployment
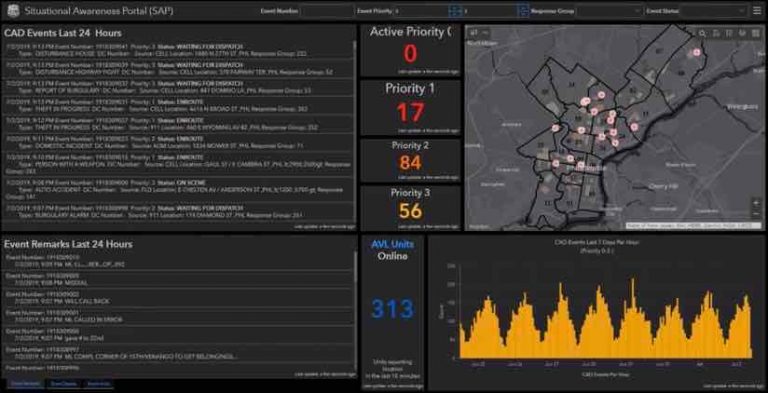
The GIS aspect of Operation Pinpoint allows for a useful “feedback loop,” as information regarding the location and activity of officers shapes future analysis. Every five seconds, a mobile data computer in every PPD vehicle calculates and transmits the vehicle’s position.
“We can present information to command staff, supervisors, and commissioners, to help them evaluate and adjust their deployment,” Thomas says. “It’s about understanding deployment patterns using a passive measure like GPS [location], instead of, say, being so focused on things like stops, arrests, and curfews. We’re trying to integrate that back into CompStat so that we can understand how much proactive police time is going into certain grids.”
CompStat is a catch-all term for a type of statistics-driven approach to law enforcement pioneered in New York City in the 1990s, and now considered a standard accountability practice in many police departments, including Philadelphia’s. GIS has always been integral to the CompStat approach, and using GPS data represents a logical next step. As the amount and diversity of data available to police increases, GIS provides a common platform and framework for warehousing data and providing analytics. And because it displays data in the context of physical location, GIS allows police to visualize the complex workings of the city with maximum clarity.
In Philadelphia, the police themselves can become an important data point. The presence of cluster points where police cars coalesce can highlight new hotspots. “The saying in CompStat,” Thomas points out, “is what gets measured gets done.”
Looking at Problems in a New Light
Location data helps PPD design unique policing plans for different areas of the city, especially the 46 designated “hotspot” regions where violent crime is most prevalent. “Each one of those targeted areas should have an articulated plan, so that everyone, all different aspects of the organization, can understand what their role is in supporting the solution,” Thomas says. For Kensington, locus of the opioid trade, police are faced with a hotspot area with a highly transient population and a constantly changing set of offenders.
“What we’re trying to do is look at things on a neighborhood basis, not a topic basis,” Thomas says of the GIS-based approach, which gives PPD a solid view of the various ways local characteristics can be both cause and symptom of crime. “Where you have violence, you’ll also have blight problems. You’ll see income and poverty issues. And you’ll see opioids. Having that location focus is perfect for our GIS platform.”
PPD’s GIS platform combines information driven by intelligence—such as observations made by police—with data-driven metrics.
“That combination can inform decisions regarding, for example, where a task force should be or where we should focus on offenders,” Thomas says.
This approach can also integrate data from other city agencies, leading to a more holistic approach to policing.
“Opioids and the violence caused by the drug trade are not just police problems,” Thomas points out. “They’re city problems. Solving them requires the input of other city agencies, quasi-governmental agencies, and even the private sector.”
The use of GIS to visualize problems in context of location along with collaboration across city and private agencies are part of a uniquely ambitious plan to revolutionize the process of urban law enforcement.
“This is not a short-term solution, something we’re using to just knock down crime this summer—we are changing how the organization operates,” Thomas says. “It’s changing how we communicate, how we do police work, how we share information and intelligence, and how we coordinate goals and objectives. This is about much more than just crime reduction.”
Learn more about how GIS improves public safety.