

March 17, 2026 |
Christian Carlson | Urban Planning
Today’s US cities too often grow faster than their infrastructure and policies can support. Population booms —and the parcel-centric development that tends to follow—can result in missing opportunities that would have bolstered quality of life and community aesthetics.
This is the opposite of smart growth.
But a modern approach to urban planning uses location data and digital maps to solve problems. On a map, city officials can see what a community needs and what it must protect.
Data—and technology that makes it easy for collaborators to manage, organize, and analyze it—brings key elements into focus. These include housing, transportation, infrastructure networks, and the green infrastructure of open space. With a clear view of what’s already in place, it’s easier to see opportunities and risks.
This is the frontier of smart growth—data rich, location aware, community centered, and built to meet the moment. Artificial intelligence (AI) accelerates the work, guiding cities toward outcomes that are equitable, resilient, and financially sound.
Yet growth always comes with limits. In urban planning, those can include burdensome financing and development costs, restrictive zoning rules, environmental considerations and restrictions, aging infrastructure, and community concerns. What’s changing is how planners understand and innovate to overcome those limits.
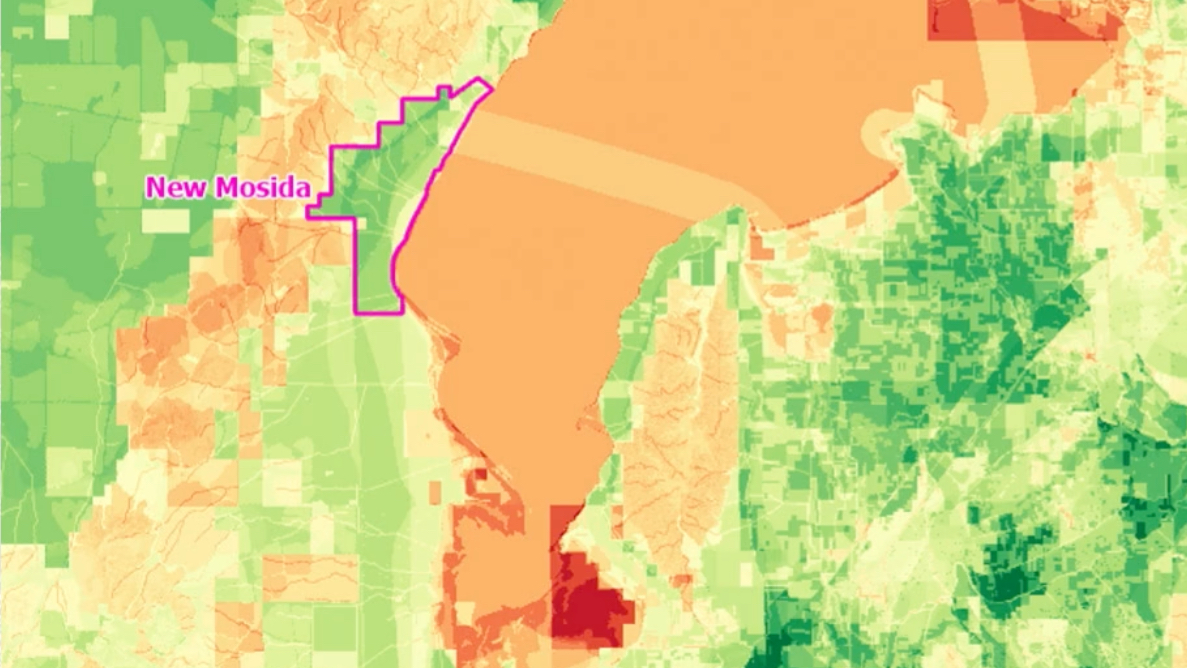
A University of Pennsylvania geodesign student tested what smart growth could look like in Utah County, one of the fastest-growing regions in the country, starting from scratch on desert land that had limited water and infrastructure. The project envisioned a place called New Mosida. It would be located on the foundations of the ghost town Mosida and redesigned with the help of spatial data and geodesign tools.
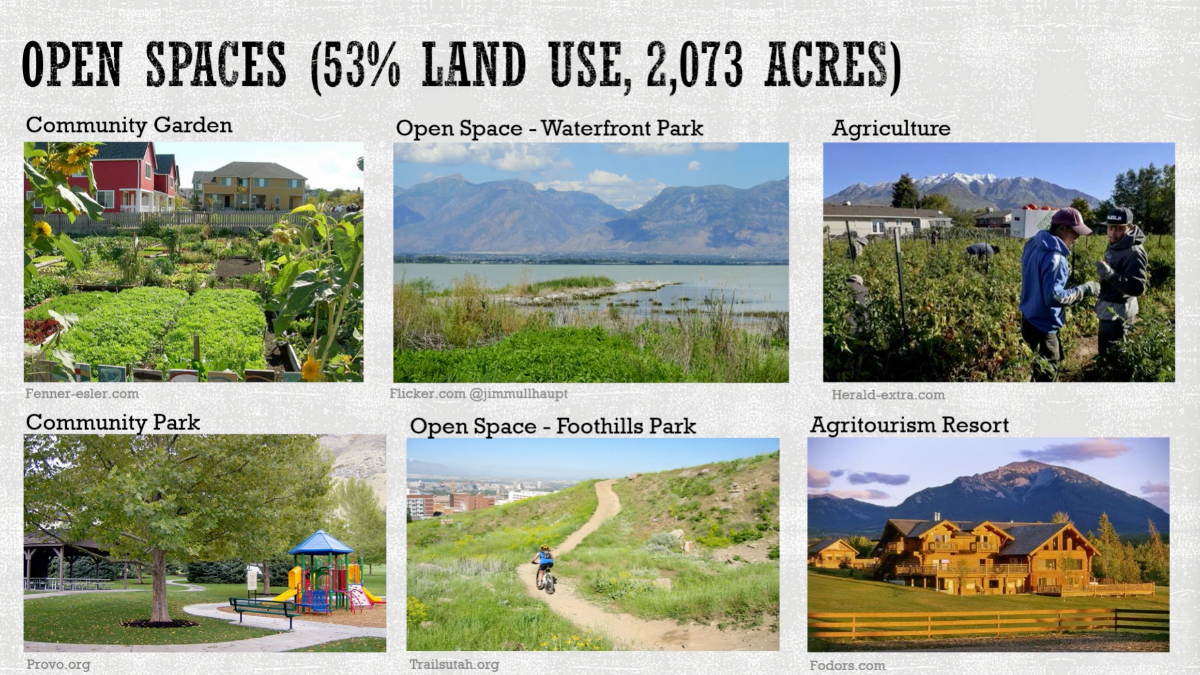
The city fostered a distinctive sense of place by embracing the desert setting—designing around natural features, honoring the site’s agricultural history, and integrating open space as a defining element of the community.
Mosida’s first settlers arrived in the early 1900s with ambition but without the tools to understand the land beneath them. The colony failed. A century later, the New Mosida project started with geographic information system (GIS) data layers to ask what a community there could look like if the data led the way.
The work started with a site-suitability analysis. The student identified the most viable location—layering data about transportation networks, water rights, seismic activity, and existing land uses onto maps. Using Esri’s ArcGIS CityEngine, they modeled development options to evaluate potential performance metrics such as population growth targets, available jobs, and open-space-to-urban-space ratios.
The result was a concept for a self-sustaining agrihood, a community designed around protecting working farmland and open space while optimizing residential areas to support food production and features that enhance livability.
This approach combines globally recognized smart-growth principles: mixing land uses; preserving open space; and creating a variety of housing options within a walkable, multimodal framework.
In the project, New Mosida fostered a distinctive sense of place by embracing the desert setting—designing around natural features, honoring the site’s agricultural history, and integrating open space as a defining element of the community.
By grounding every decision in spatial data, planners turned environmental and infrastructure constraints into a blueprint for sustainable development.
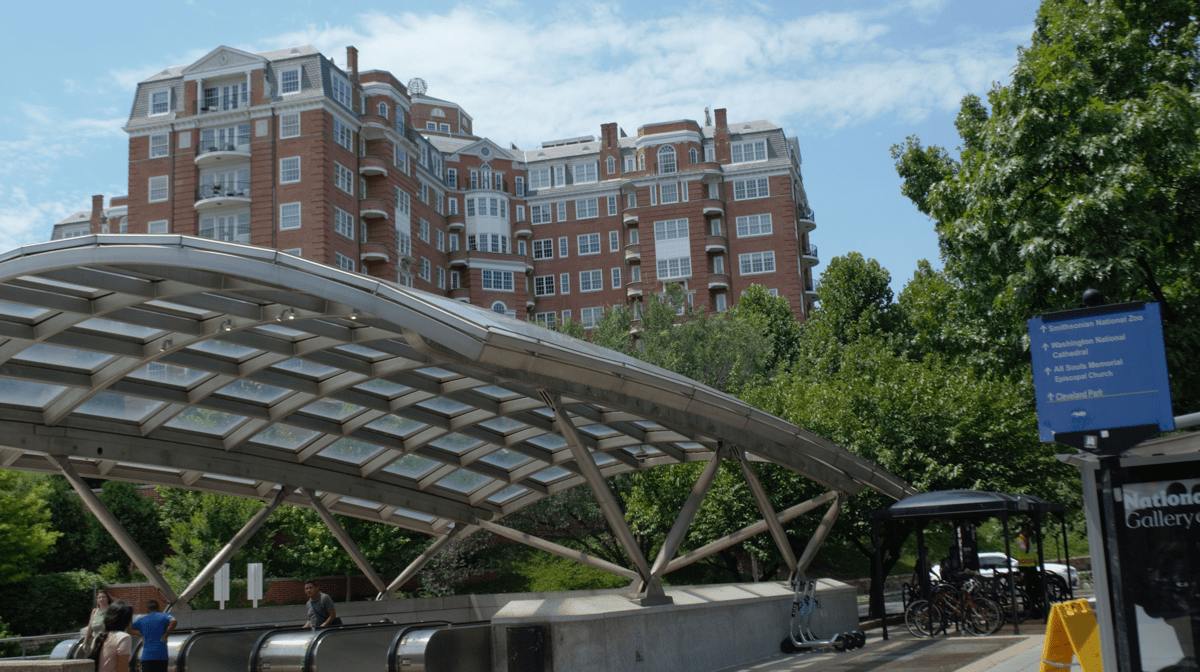
In Washington, DC, planners needed to strike a balance between preservation and inclusive, transit-oriented growth in the city’s Rock Creek West planning area. This part of the city has Metro subway stations, parks, and civic amenities, but lacks affordable housing.
Rock Creek West makes up over 10 percent of the city, but its restrictive zoning and historic preservation rules limit options for building more housing. Communities that advocated for those restrictions did so to protect against large-scale change. There are even caps on the number of restaurants allowed.

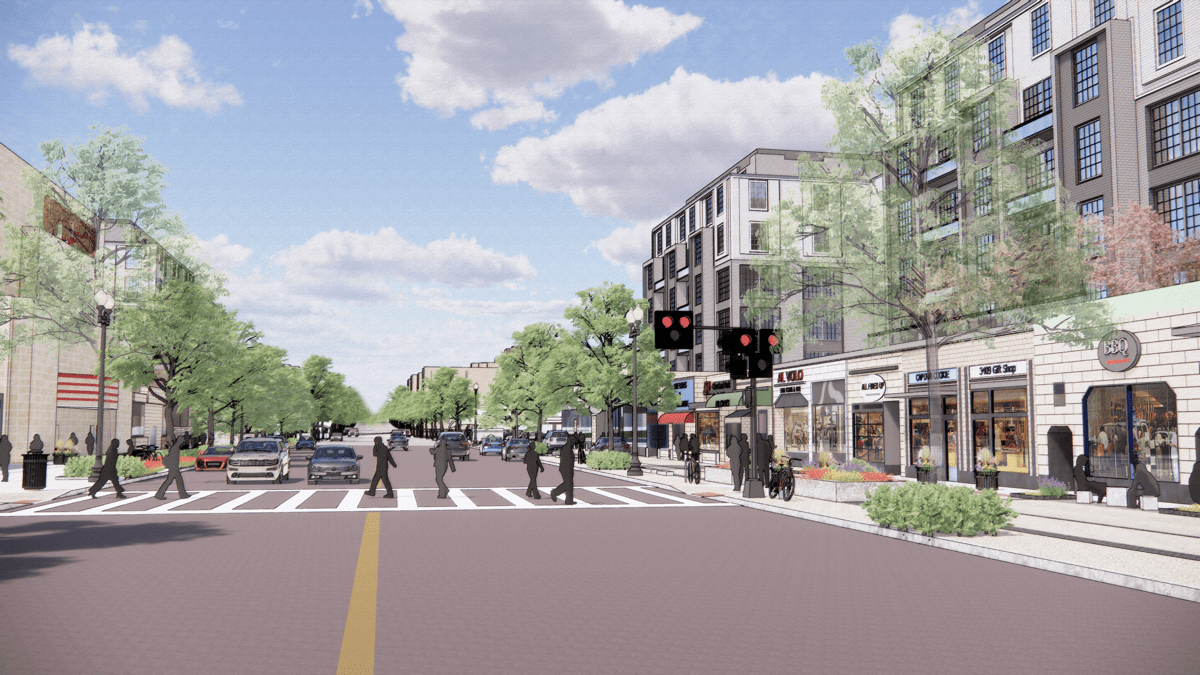
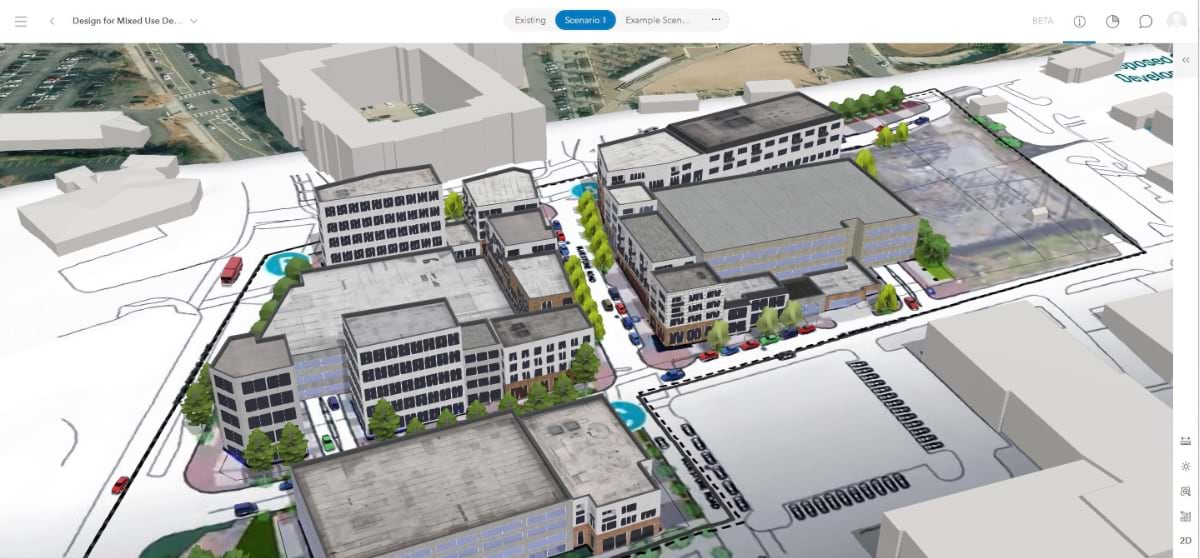
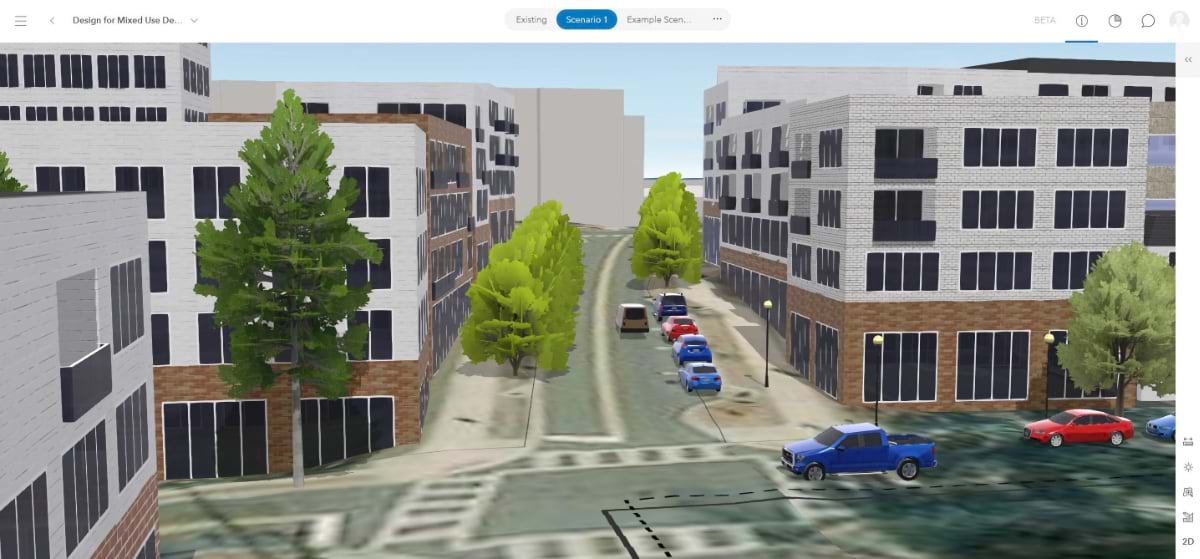
To navigate within these constraints, planners had to identify underutilized corridors and create multiple models for new development. They used GIS to make a location-aware digital twin—a virtual replica of the area that provides a 2D and 3D design environment.
Inside the digital twin environment, planners could model different building heights, density levels, and streetscape designs as solutions for adding residential units while protecting neighborhood character. The planning team’s GIS tools extended to support public engagement, with virtual walking tours and ArcGIS StoryMaps stories to explain the vision and generate feedback.
The student’s approach embraced smart-growth principles by directing development efforts toward existing communities, creating a range of housing choices, and encouraging stakeholder collaboration.
As in the nation’s capital, planners in Sandy Springs were working to protect the character of established neighborhoods while adjusting to meet rising demand for housing and infrastructure.
The once-rural outpost near Atlanta historically has had an independent spirit and a distinct identity. However, it has taken on a more urban persona as it has become one of the fastest-growing cities in the Atlanta metro area.
Today, half of the city’s housing is in the form of apartments, a more affordable option that has attracted a sizable population of millennials. Meanwhile, in the Crossroads neighborhood, planners have made a diligent effort to balance the interests of a diverse community of current residents along with those of newcomers.

The challenges were easy to see on a map. The west side of State Route 9 is home to a Latino community that has deep roots in Sandy Springs. Crossroads is also the location of The Prado, a large shopping area that includes Life Time Work, a combined coworking space and health club. Across the street from the mall is El Taco Veloz 2, Atlanta’s oldest taqueria.
That type of geographic juxtaposition—an established local institution and a work/wellness facility for remote office workers—will define the next generation of life in Crossroads.
City staff rely on various types of data, analyzing it on GIS maps to understand where growth is happening and how it’s affecting residents. And city planners apply these insights to hit strategic objectives: protect and rehabilitate existing neighborhood housing stock, increase open space, improve walkability, and promote mixed-use zoning.
Equally important, the maps help planners balance growth with inclusion in mind, ensuring that new development supports current residents and strengthens the city’s identity as it evolves.
The cities of tomorrow will flourish based in part on how boldly planners apply data to address the challenges of growth, equity, and sustainability.
As communities face mounting pressures to do more with less, spatial data and the technology needed to optimize it can help create a road map. With it, cities will better understand constraints, test ideas, and develop the precision to act in ways that reflect their local values.
From desert agrihoods to historic urban corridors and diverse suburban neighborhoods, smart growth is being redefined—for everyone—with location data.
Learn more about how urban and community planners use GIS to analyze community needs; strategically design development; and support resilient, sustainable growth with maps and spatial analytics.