June 10, 2025 |
Mike Cox | Public Safety
September 17, 2026
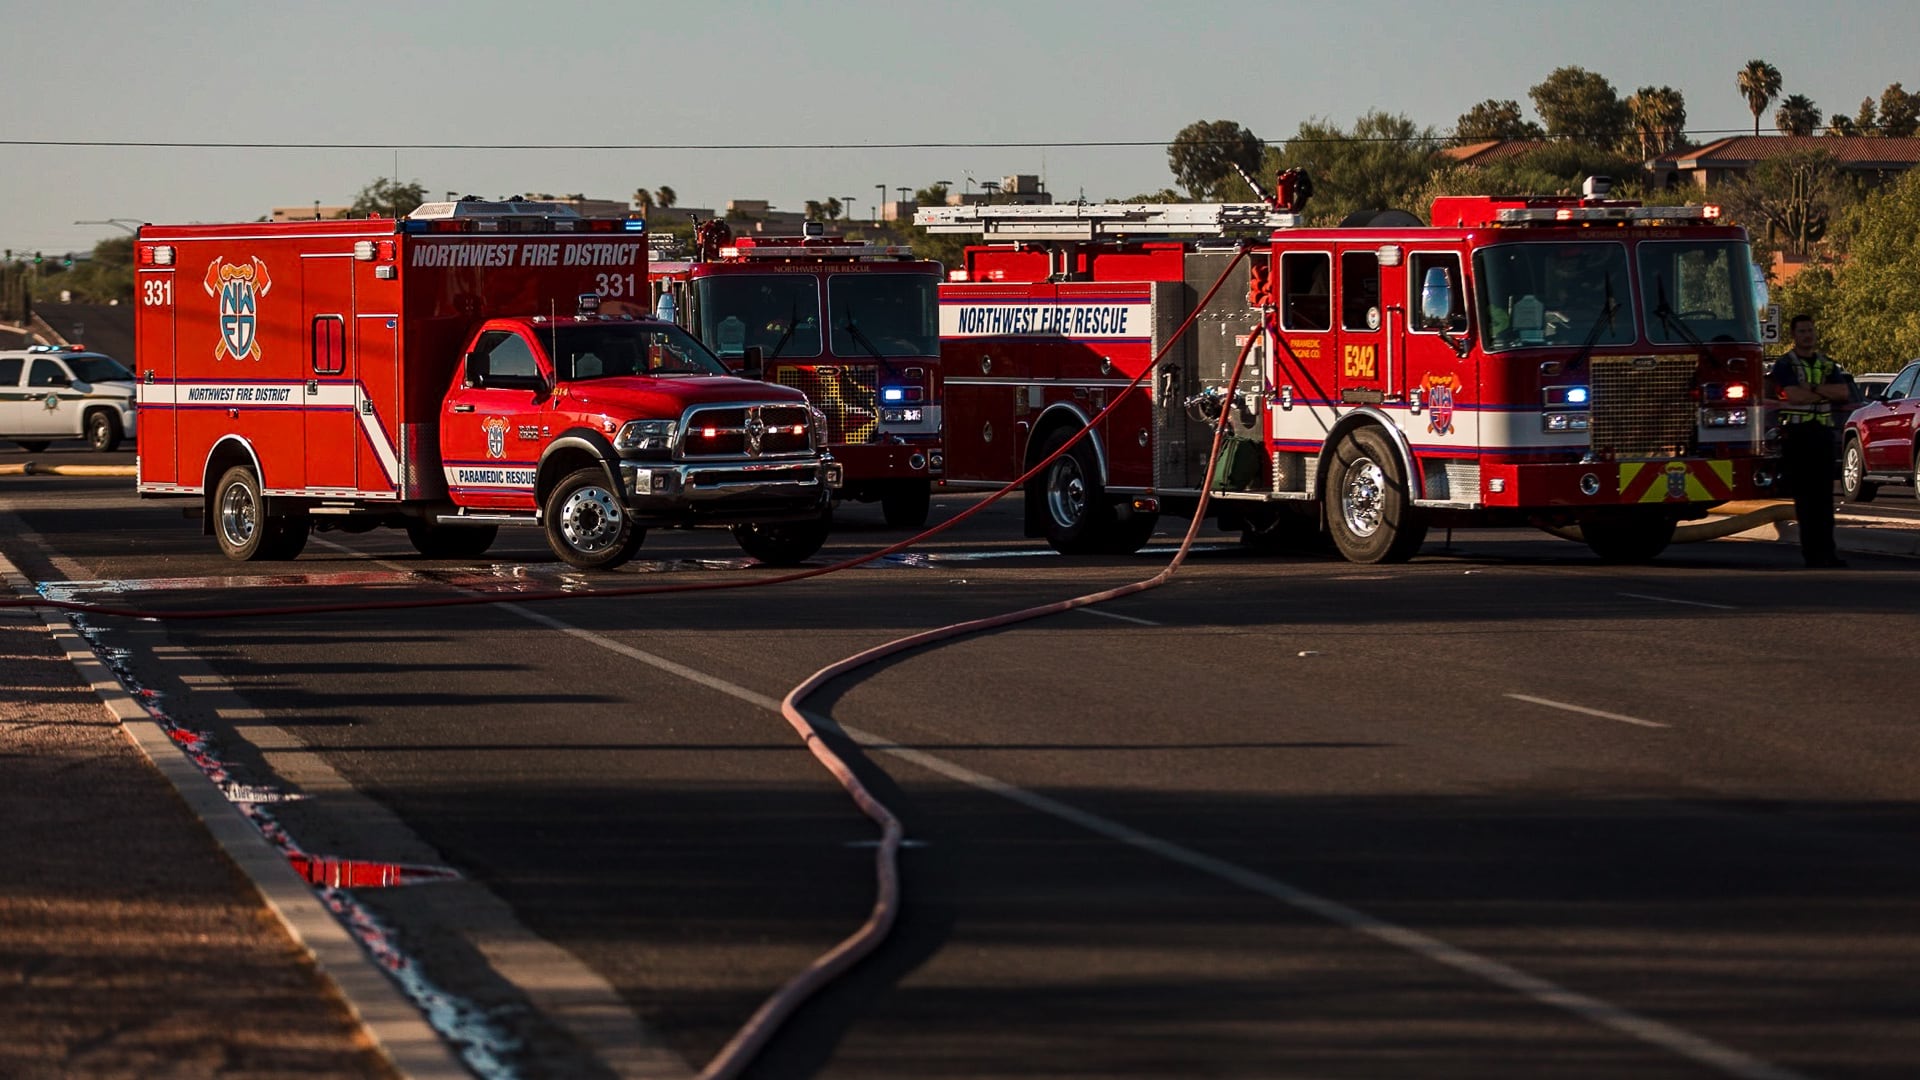
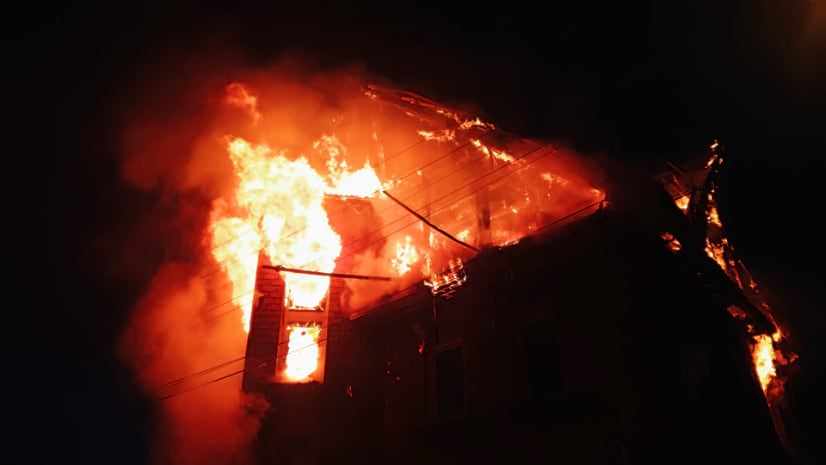
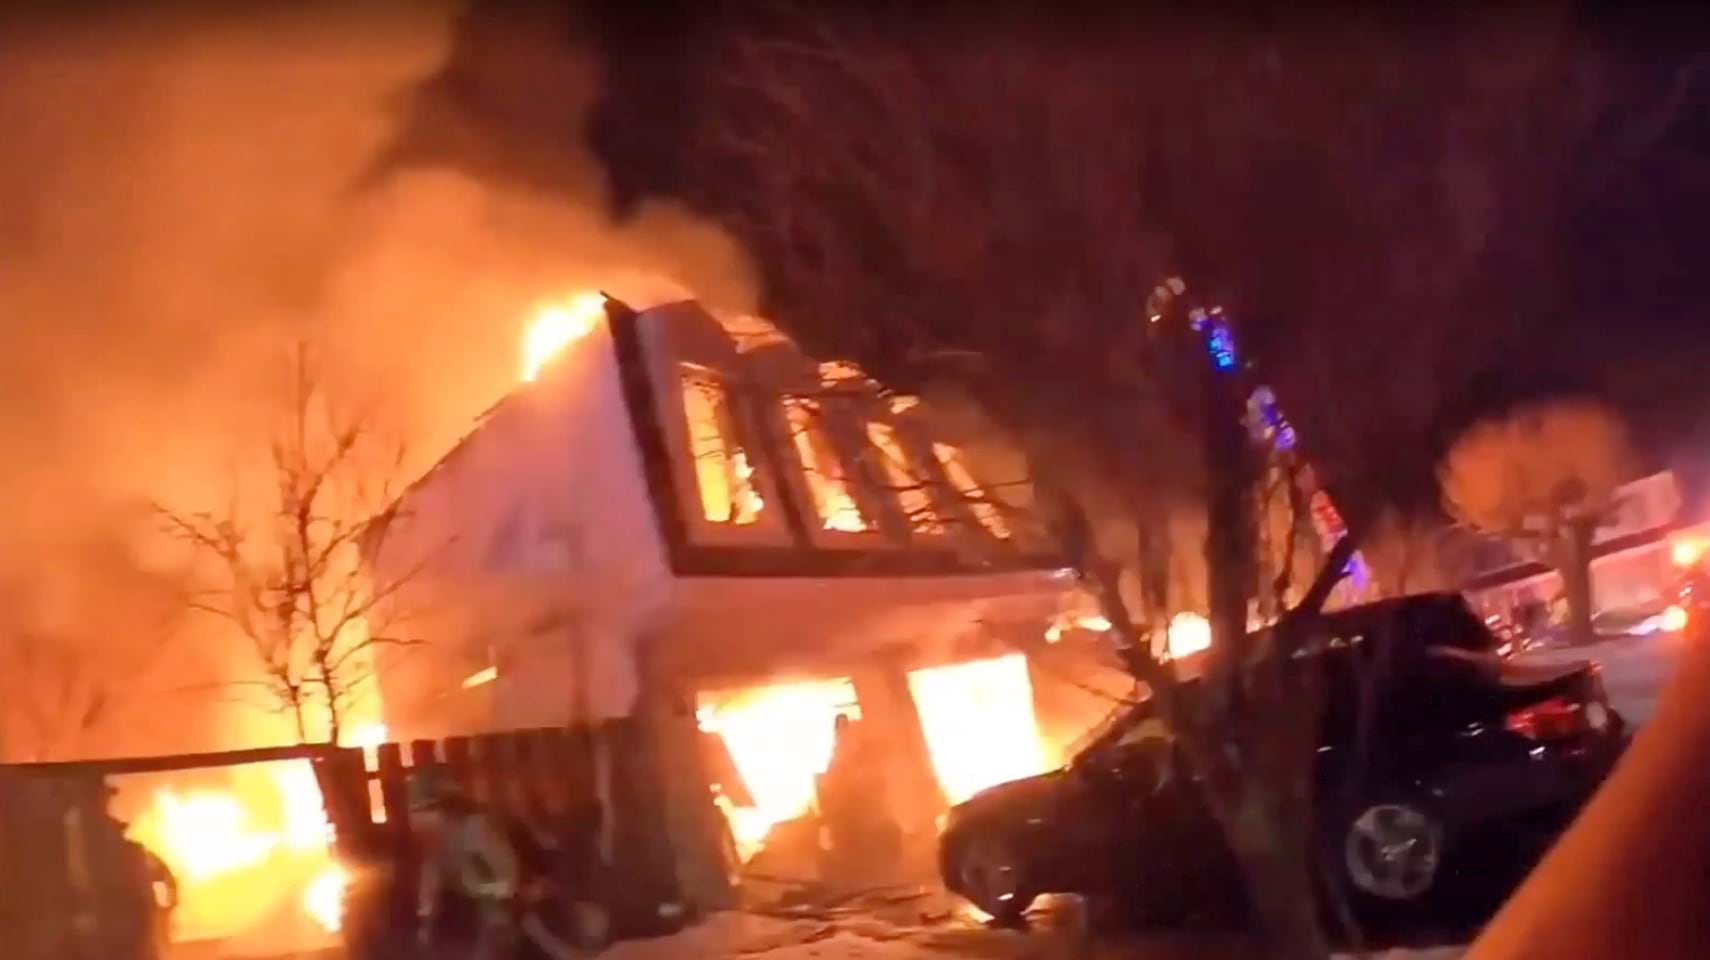
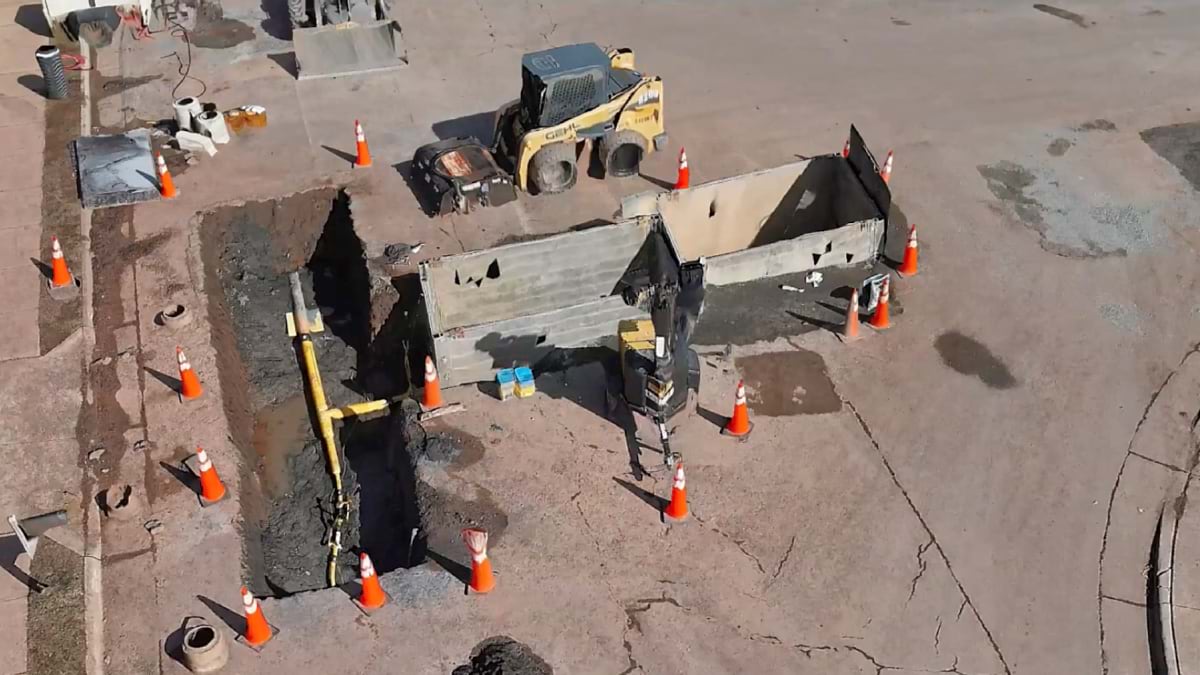
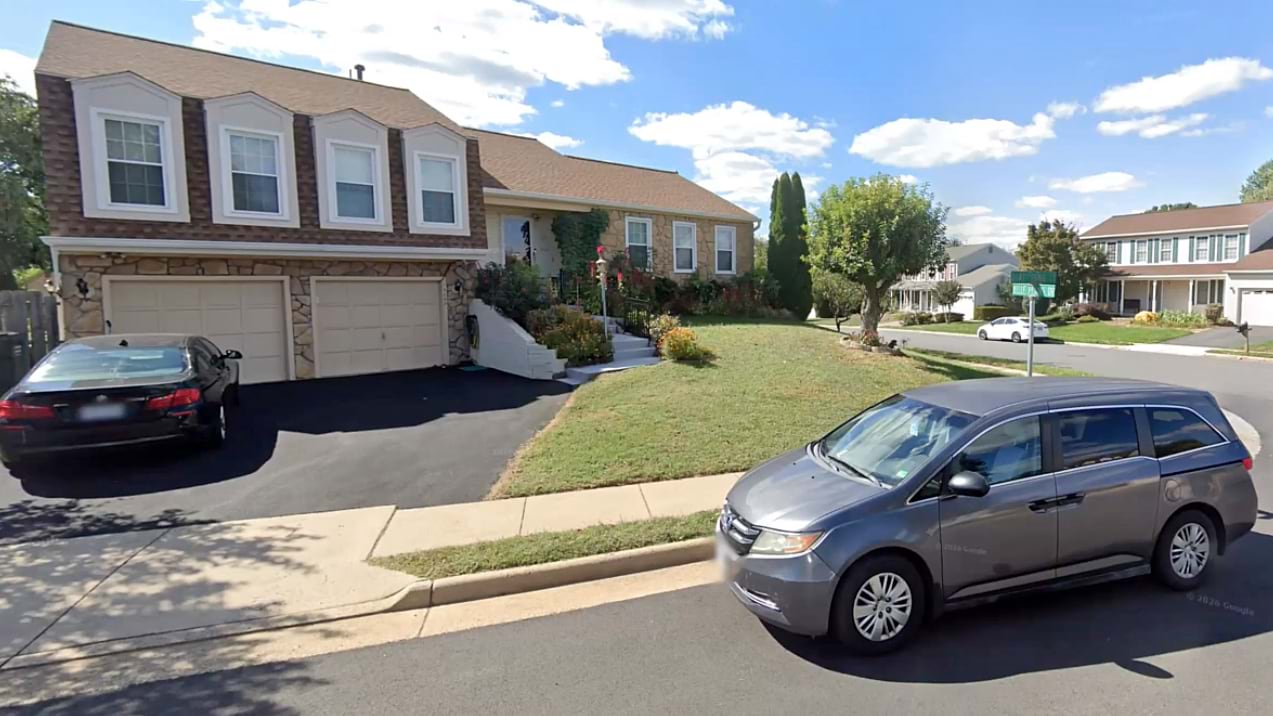
On a Sunday night in February 2026, just south of Dulles International Airport in Fairfax County, Virginia, a gas explosion ripped through a home. By the time emergency response crews arrived, methane had moved into basements across the neighborhood. In some homes, the gas levels were approaching explosive limits.
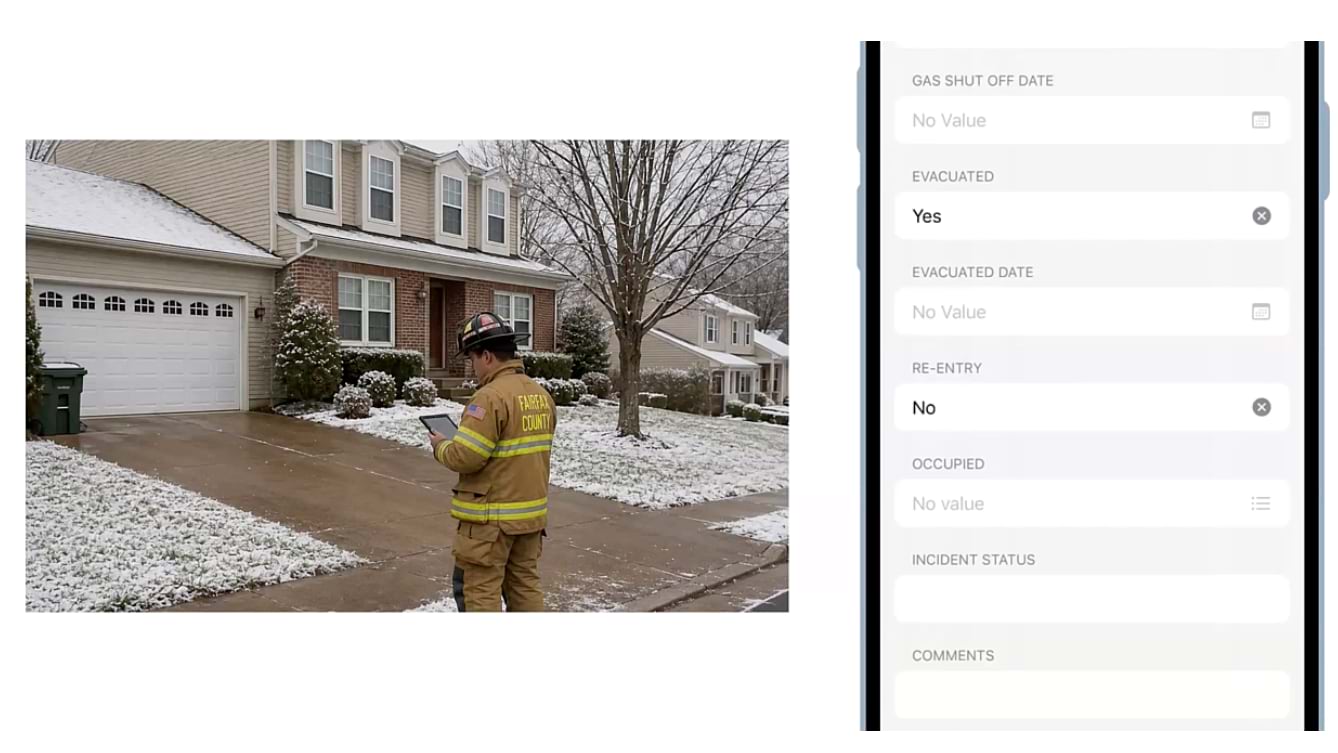
To protect people and property, incident commanders had to act fast. They tracked evacuations and gas shutoffs with screenshots they quickly gathered from online maps. That initial tactic worked, but responders needed real-time situational awareness to completely mitigate the threat. Methane readings were shifting across dozens of homes and multiple agencies rallied to coordinate from a single command post.
John Morrison, data analytics strategy manager for the Fairfax County Fire and Rescue Department, saw the incident progressing beyond the scope of a normal response to something that could last several days to weeks. “As firefighters do, the first crews on the scene used the technology they had in hand—an iPad and some scratch work,” Morrison said. “But we knew we could make the response more efficient by using GIS to collect, analyze, and visualize the volumes of data the incident would generate.”
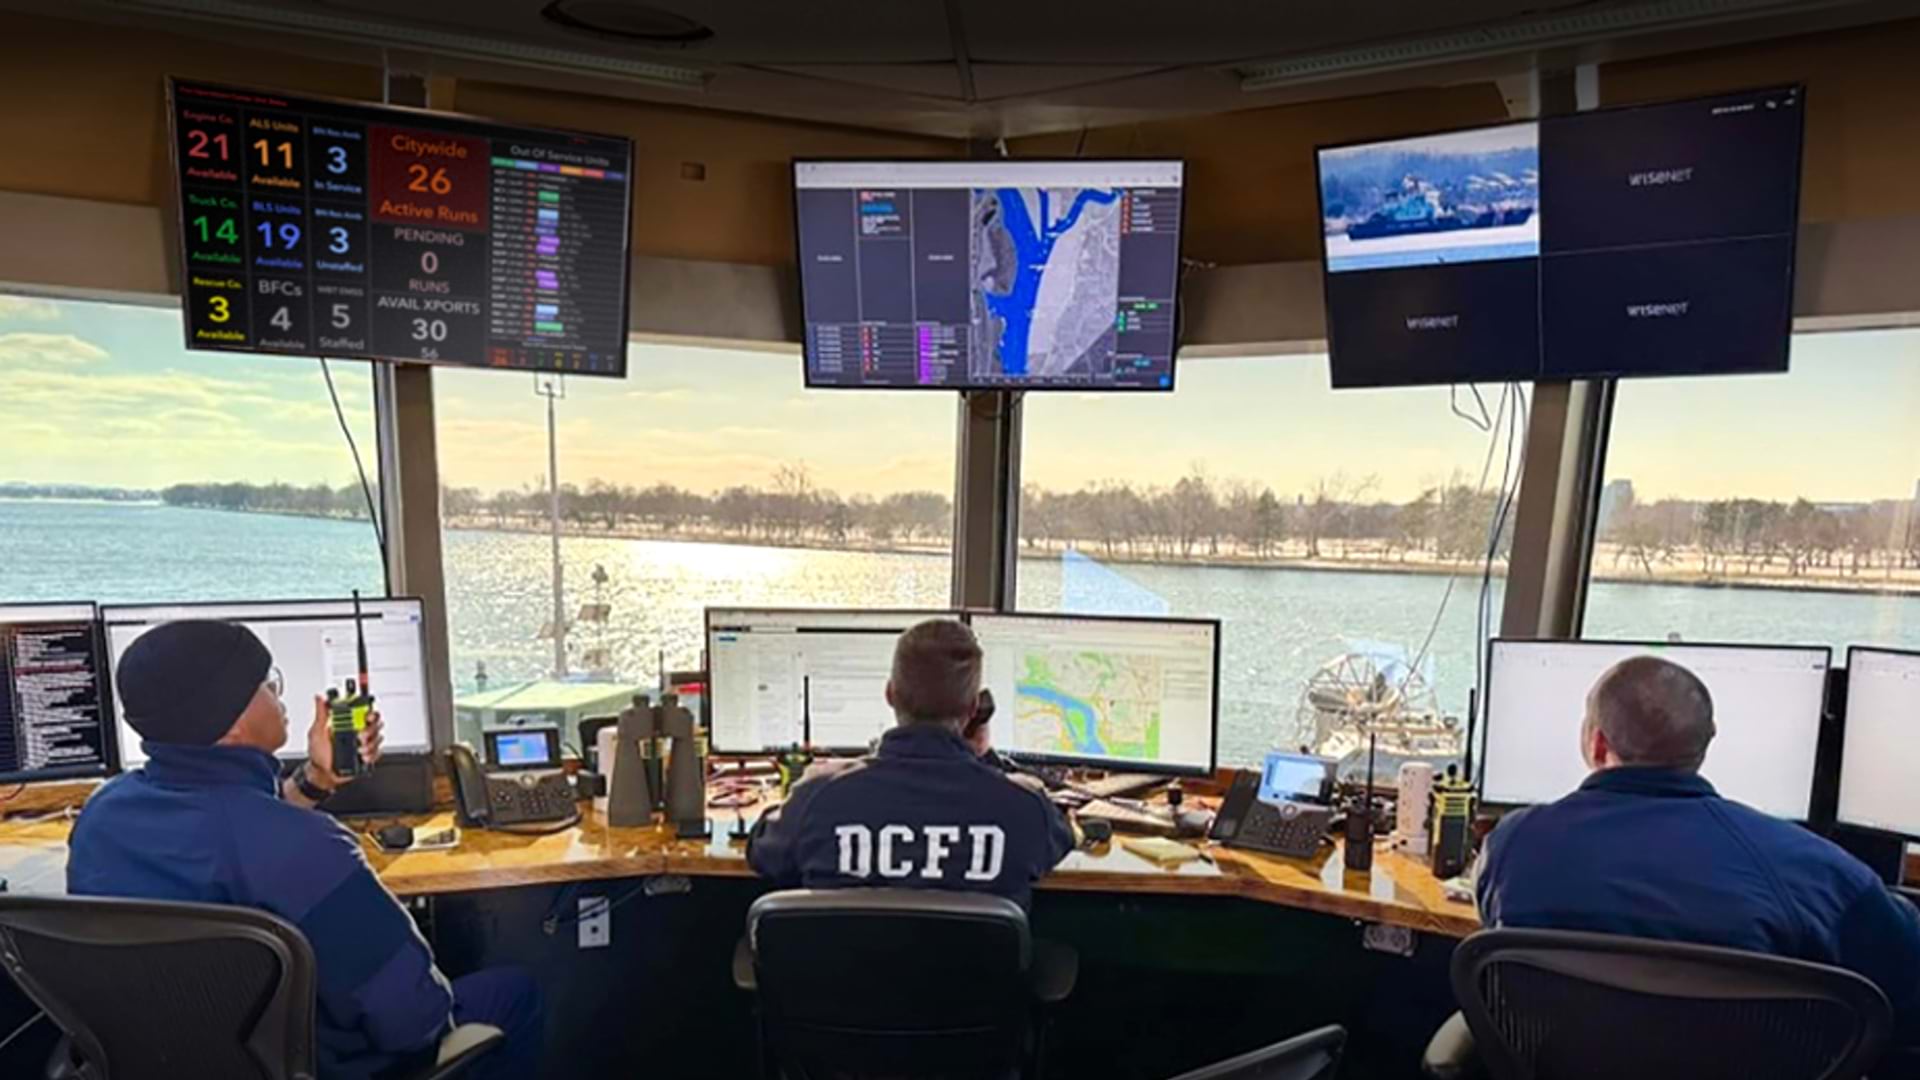
At 7:00 p.m. on Monday night, Morrison called a mapping expert, Chip Galloway, the geographic information system (GIS) technology section lead for Fairfax County Fire and Rescue.
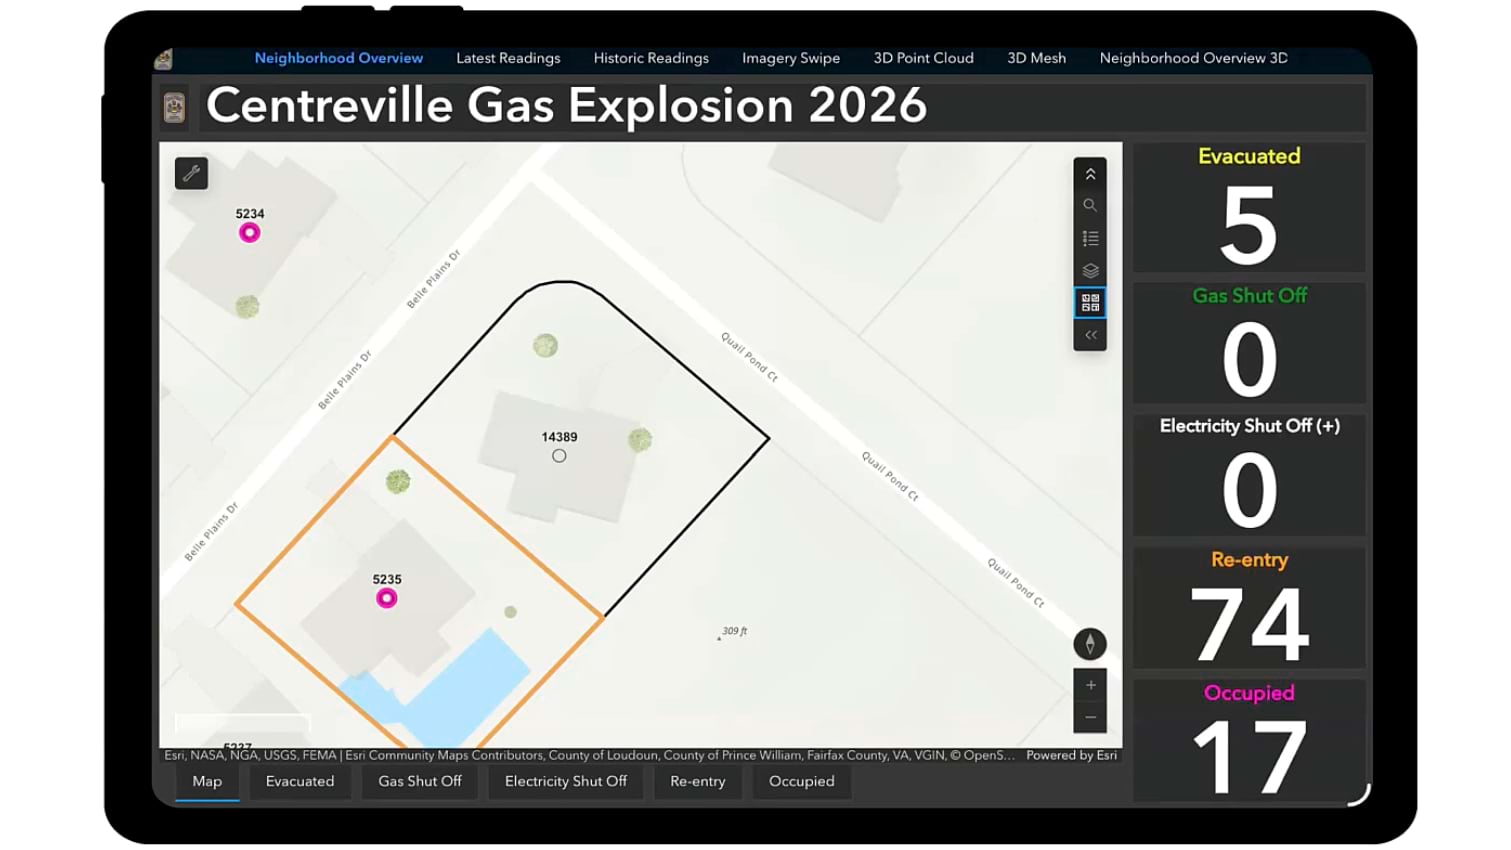
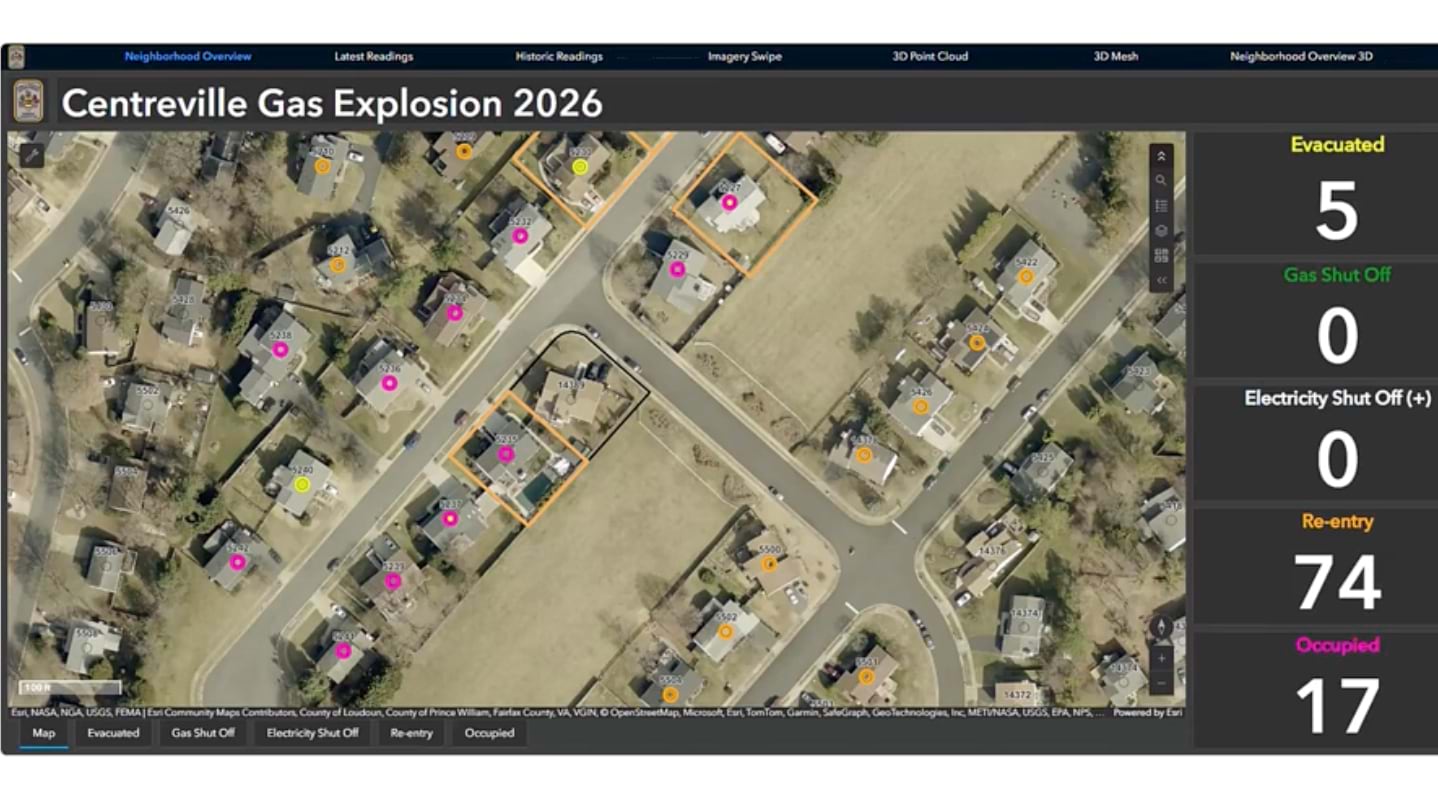
Within hours, Galloway and his team—GIS analysts Eric Fisher and John Woolverton—had a field mapping application and dashboard running in the command post. Address parcels showed evacuation status, gas shutoffs, and electrical status in real time.
But crews also needed to capture gas readings across dozens of locations.
“Morrison reached out to me on a Friday at 10:00 a.m. saying, ‘Hey, learn ArcGIS QuickCapture,’” Woolverton said. “By 2:00 p.m. that day we had an active app in the field.”
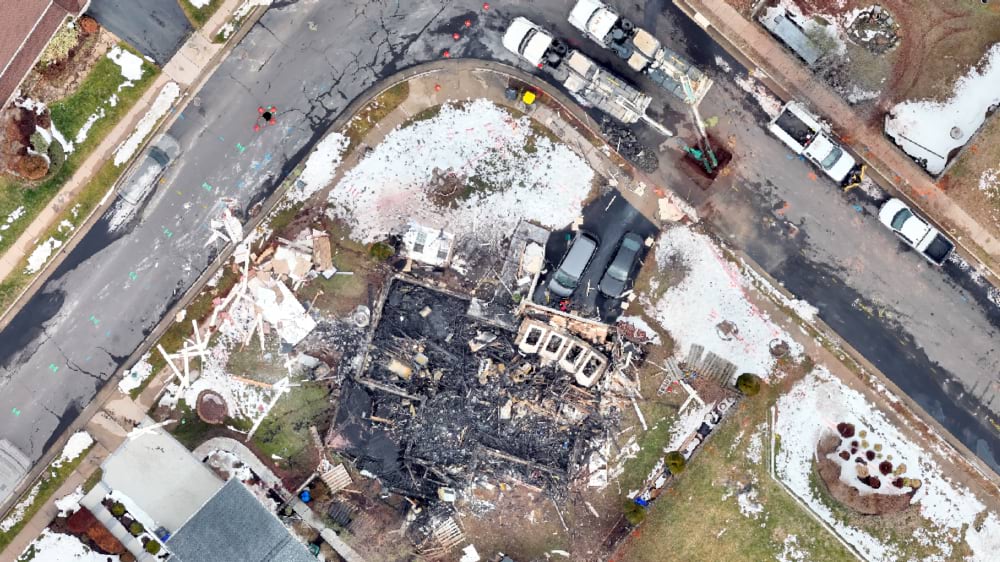
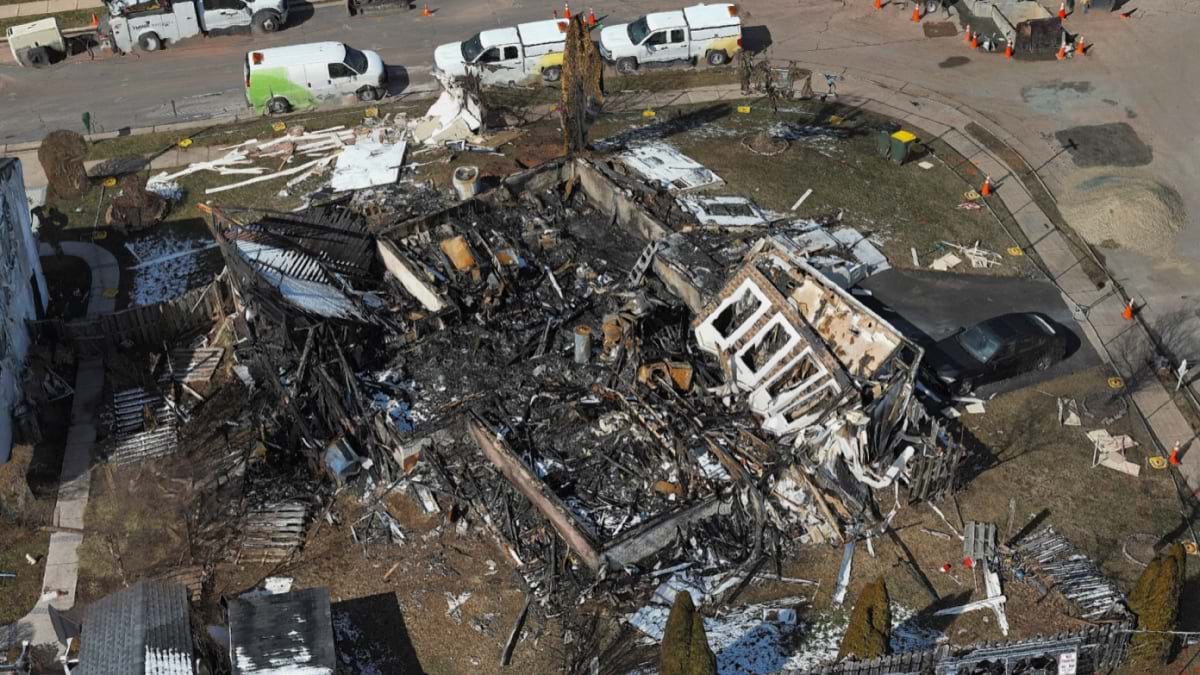
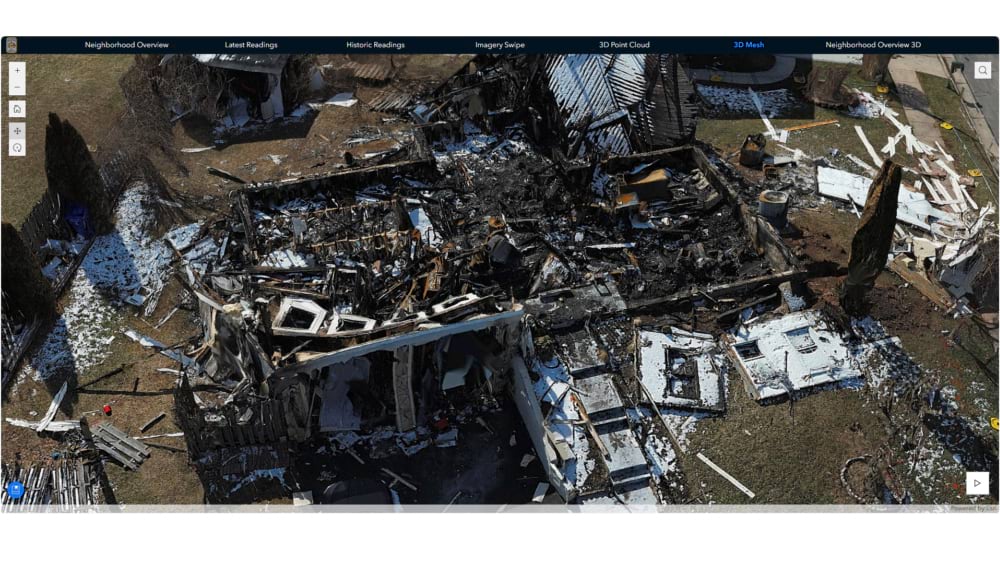
The fire department’s police partners provided drone imagery—approximately 2,000 images totaling 30 gigabytes of data. The imagery was quickly processed using ArcGIS Drone2Map and rendered first as a 2D and then as a 3D visualization.
“I was floored,” Galloway said. “The detail allowed you to visualize the damage and track mitigation progress over time. The results were more compelling. Incident commanders and senior leadership quickly embraced the technology when they saw its value.”
Even details about the destroyed structure were clear: a water heater, a refrigerator and stove, a washer and dryer. The front door bent from the blast. A bathtub that had fallen from the second floor. In the adjacent yard, a neighbor’s dog sitting by the gate—captured because it sat still long enough.
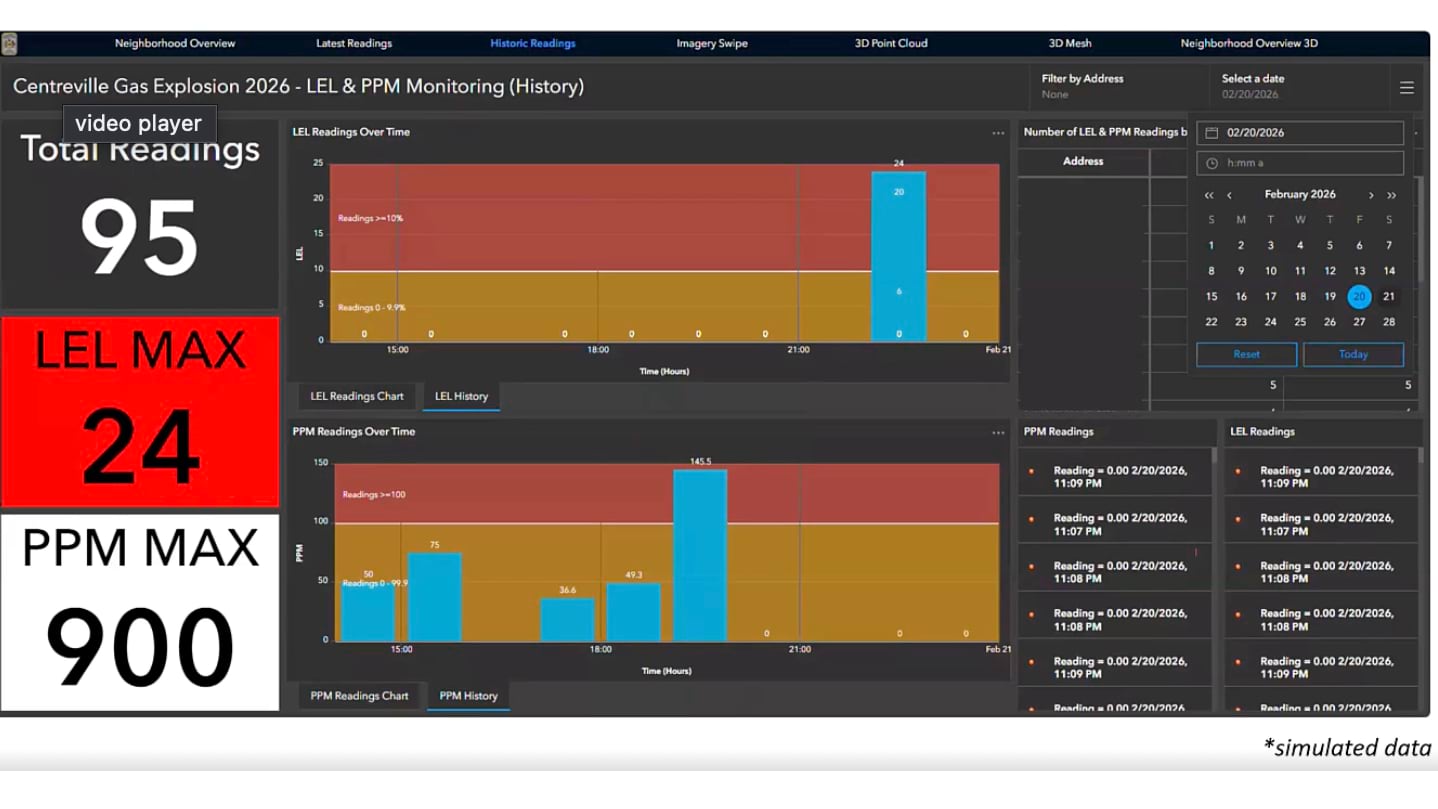
Next, Woolverton added functionality to immediately visualize gas readings from QuickCapture within the 3D neighborhood map. Parcels with elevated readings glowed orange or red, depending on the levels.
“They asked me in the field, ‘How long does it take to show up on the map?’,” Galloway said. “I told them it’s real time. When you identify a higher reading, it will show up automatically on the map.”
The initial evacuation covered 65 homes. As readings came in, commanders scaled back the perimeter and tracked residents returning to their homes over the 12-day response. The imagery also showed how close neighboring properties had come to being destroyed.
“Data drives decisions in near real time,” Morrison said. “It’s near real-time imagery flown by a drone with all the overlaid layers and live data collected by field units in one common operating picture.”
The incident brought together Fairfax County Fire and Rescue, utility companies, the National Transportation Safety Board (NTSB) investigating the pipeline, and the State Corporation Commission overseeing utilities. All stakeholders could see the real-time information hosted in the command post.
The Esri Disaster Response Program provided temporary licenses that gave response teams access to mission-critical tools. Leadership monitored operations remotely from GIS dashboards. Briefings supported by GIS maps aided public communication. Over 12 days, the county managed evacuations, ongoing monitoring, and re-entry.
In the aftermath, the experience accelerated adoption of GIS capabilities for future incident response. For Morrison, the incident validated years of investment in the technology.
“We’ve done a tremendous amount of work on data and GIS literacy and infrastructure over the last five years in this fire department,” he said. “Whenever the technology is needed, we can deliver it, and it makes the mission more effective and efficient.”
Twelve days after the explosion, the last evacuated resident returned home as the neighborhood was declared safe—informed and guided by the map.
Learn more about how GIS helps agencies prepare for, response to, and recover from emergencies.