August 21, 2023 |
Alex Pasternack | Resilience
Patrick Flynn lifted the thick tome above his head at Esri’s 2025 Geodesign Summit—234 oversize pages of Denver’s Storm Drainage Master Plan. Only engineers like Flynn or infrastructure planners would likely tackle such an unwieldy reference. Certainly not new residents researching flood risks for their families. Not even city officials, who’d likely ask staff for a summary instead. And as if this weighty book weren’t enough, those pages were from just one of a two-volume set.
“It’s a lot of work. It’s good work,” Flynn said of the books that make up Denver’s Storm Drainage Master Plan. “But it’s not particularly engaging.”
It’s also updated only once every five years. The vital data inside, though, directly impacts the more than 700,000 people who live in the Mile High City. The plan informs decisions about long-term investments in the city’s infrastructure. That, in turn, protects residents from destructive floods that can close roads and damage properties.
The Denver Department of Transportation and Infrastructure (DOTI) believed the information should serve a wider audience. So, Flynn and his colleague Erin Sturm, both of global engineering firm Stantec, worked with DOTI to transform the printed plan into a more accessible online portal of interactive information.
Now, there’s a one-stop digital destination for all the city’s stormwater information, built using ArcGIS Hub, the community engagement platform driven by powerful geographic information system (GIS) technology.

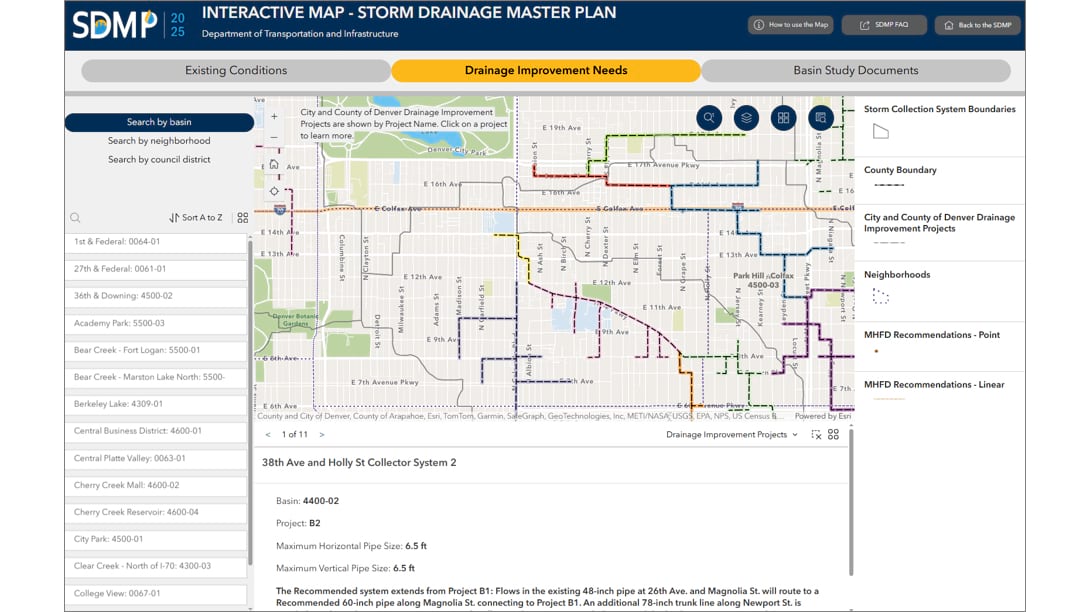
Anyone can see where the current infrastructure sits—whether it’s pipes, culverts, inlets, or detention basins where flooding is likely to occur—as well as what solutions have been proposed. DOTI’s technical staff can also see predictions about how flooding could be mitigated in the future, based on planned infrastructure investments. Models inside the portal simulate existing and future conditions, extreme weather impacts, and infrastructure improvement needs—an approach supported by geodesign (see sidebar).
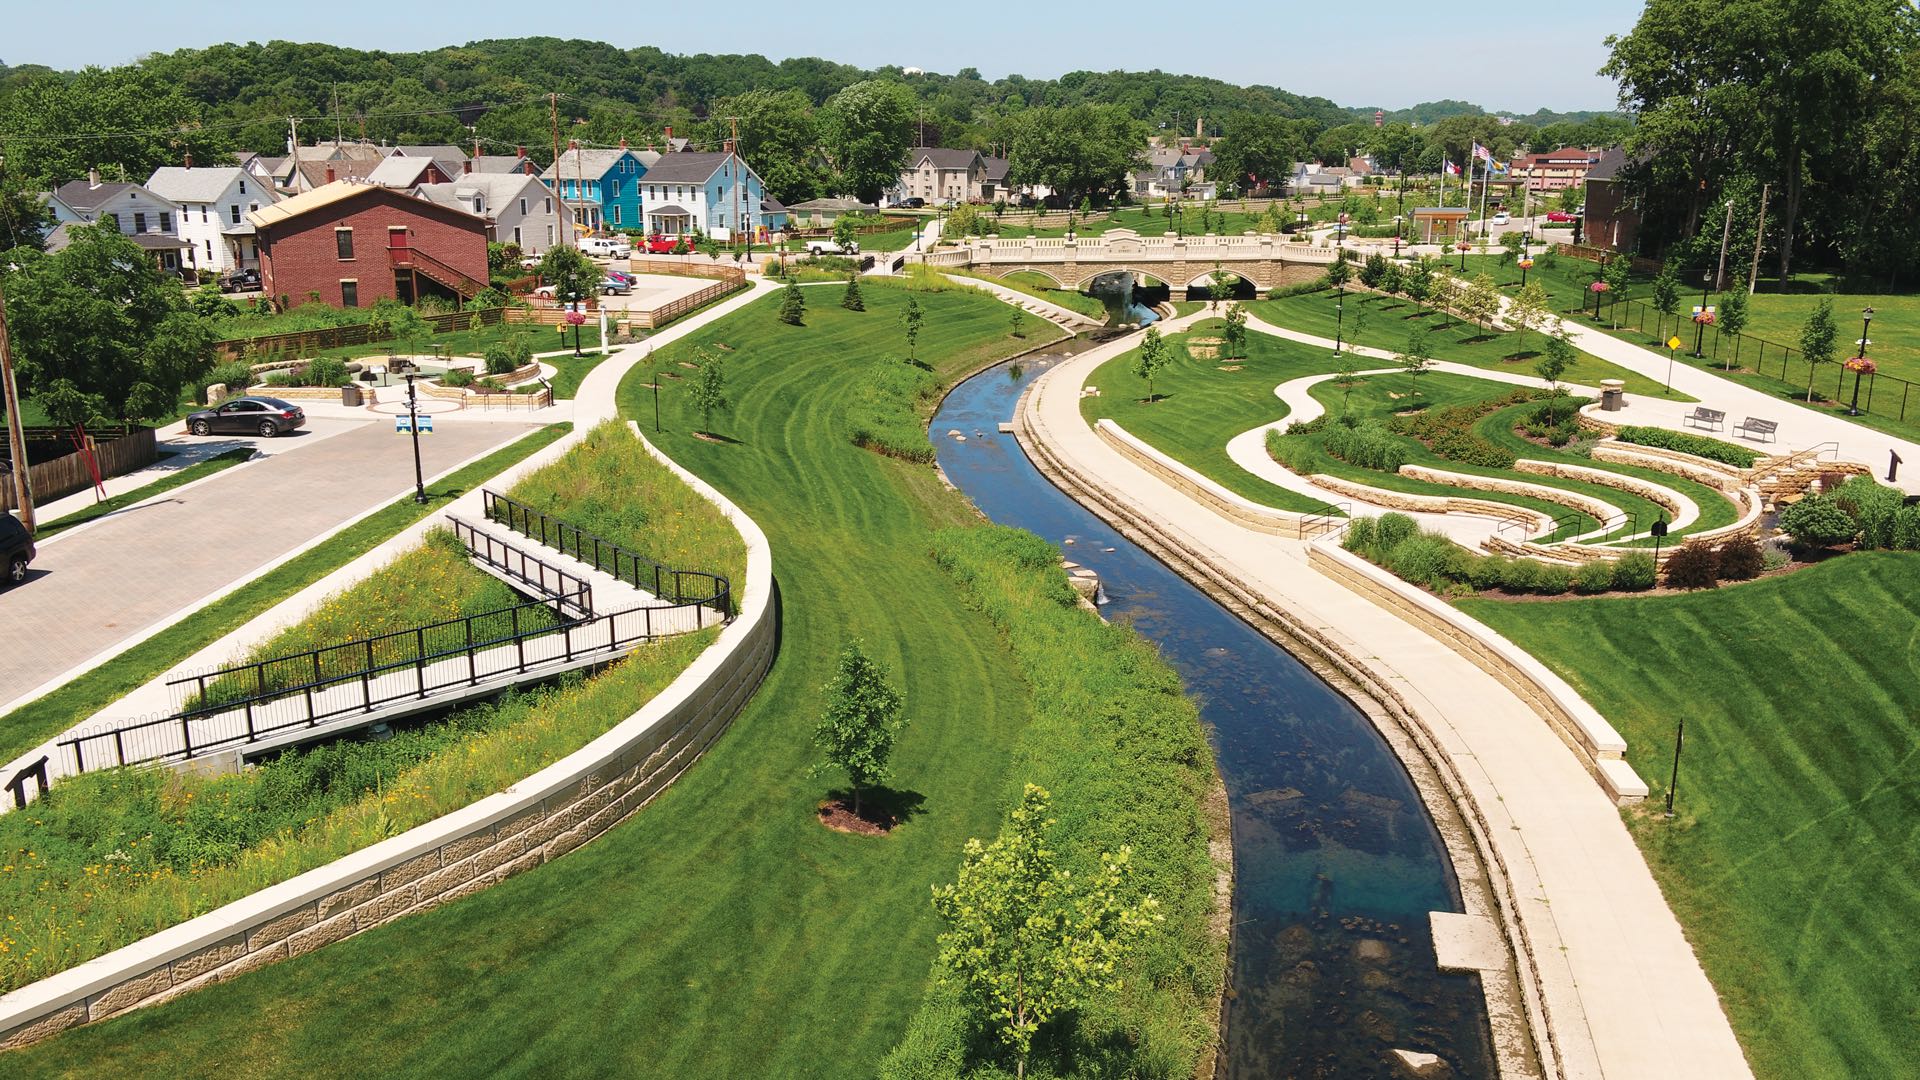
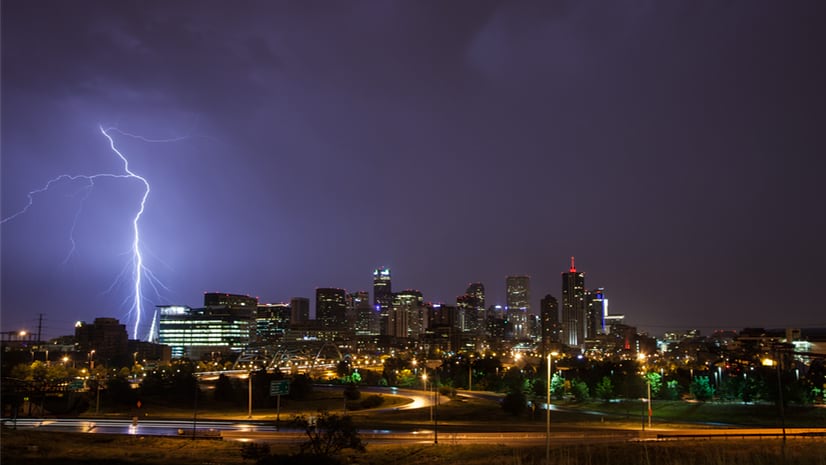
Denver has battled flooding since its earliest days. In 1864, Cherry Creek overflowed and wiped out much of the young city. As Denver grew, older neighborhoods were built without natural waterways or proper drainage—leaving behind an undersized pipe system that still struggles today. The problem is getting worse. Denver ranks among the 28 largest US cities that are physically sinking, increasing its flood risks. But the city has been innovative. Since 2010, Denver has taken a proactive approach, using advanced modeling to map flood-prone areas and plan accordingly.
Denver’s drainage system spans 154 square miles with over 1,000 miles of pipes, channeling runoff from 67 watersheds to the South Platte River.
The city faces about 75 storms annually—and when several dump heavy rain quickly, they can overwhelm the stormwater infrastructure.
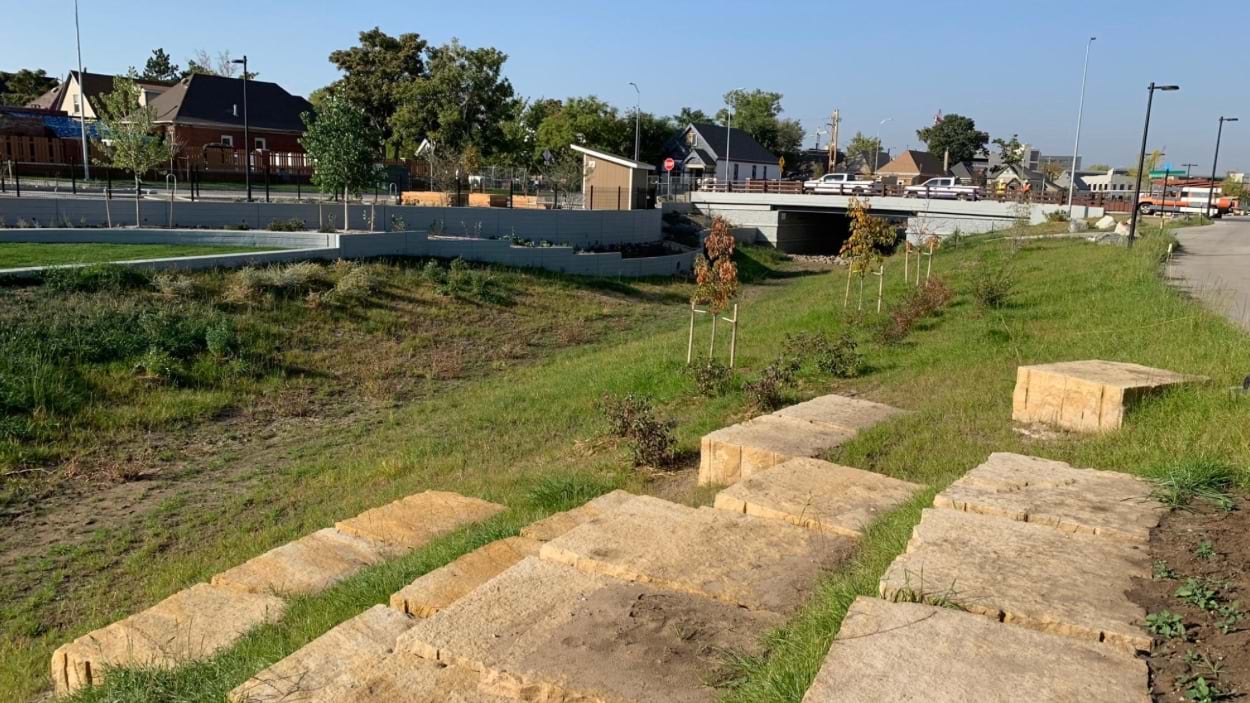
That’s why it’s critical for Denver and other growing cities to regularly review and analyze their stormwater infrastructure and plan for future needs. Stormwater-detention ponds, where rainwater collects, may need to be expanded or dug anew. Storm drains may need to be cleaned of debris more regularly. Stormwater routes may need to be entirely redrawn.
In its first three months online, Denver’s 2025 Storm Drainage Master Plan attracted more than 10,000 visits, according to Jun Meng, an engineer-architect specialist with DOTI who managed the project.
The highly visual plan now serves as a decision-support tool for drainage improvements in Denver. Developers, city engineers, and regulators can determine where and how to build a new project for flood safety. DOTI teams working on capital projects can look at flooding risks and collaborate on solutions for the future to enhance communities. The plan guides drainage design and the movement of earth before any new structures are built.
Would-be homebuyers can view the flood risk in a certain neighborhood. Council members can access the plan to identify where improvements are already being made in their district. Emergency management teams can use it to prepare before storm seasons.
The comprehensiveness of the plan helps the city prioritize projects for the most impact. Thomas Blackman, an engineering supervisor at DOTI, said the storm drainage program has a $50-million annual budget for capital improvements. That figure doesn’t address all the needs, but the plan helps prioritize what to do first.
“Being able to find opportunities to make major improvements for low dollars is huge,” Blackman said. “Having this kind of modeling and visualization is incredibly valuable for that.”
The first step in developing the online version of Denver’s Storm Drainage Master Plan involved using ArcGIS Experience Builder to create a flood model data viewer. Stantec and DOTI used the viewer internally to compare data scenarios and model results. They integrated historical and current data to see what’s happening now and visualize future flood risk, and how that flood risk might be reduced with planned capital improvements.
A feature of the new model data viewer that has significantly aided the planning process is a slider, used for comparing current conditions with future scenarios based on fixes being made. An initial overhead view indicates roads that might be impassable based on a variety of flood conditions. It can be switched to a view showing what those same roads might look like once a feature is built to address the flood risk. The view also makes it easier to see precisely where stormwater is likely to flow from the streets to pipes and, eventually, to the river.
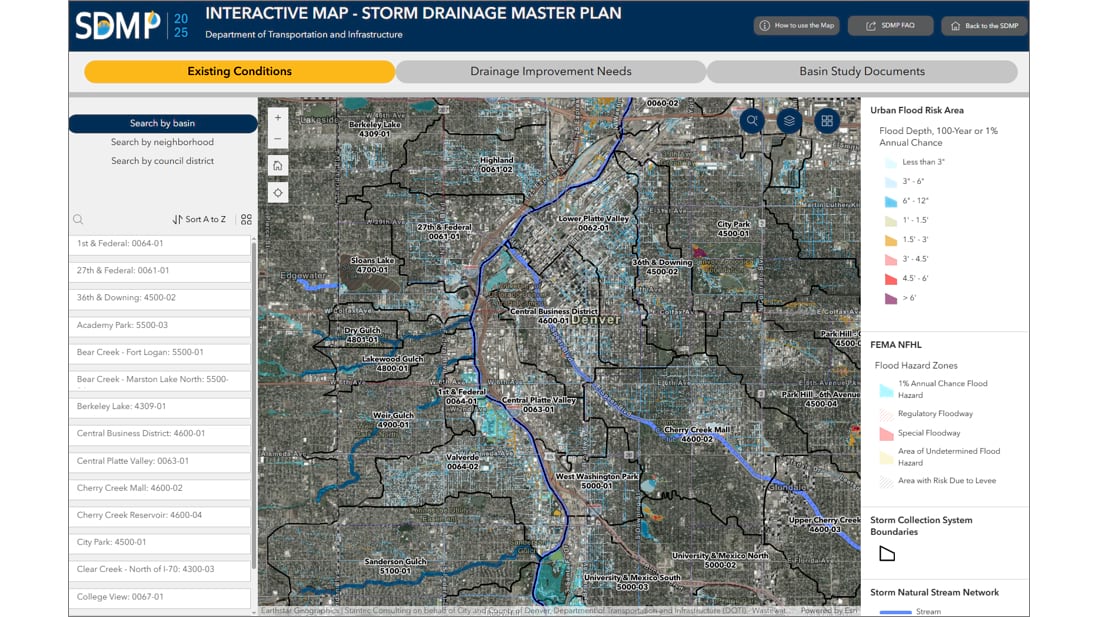
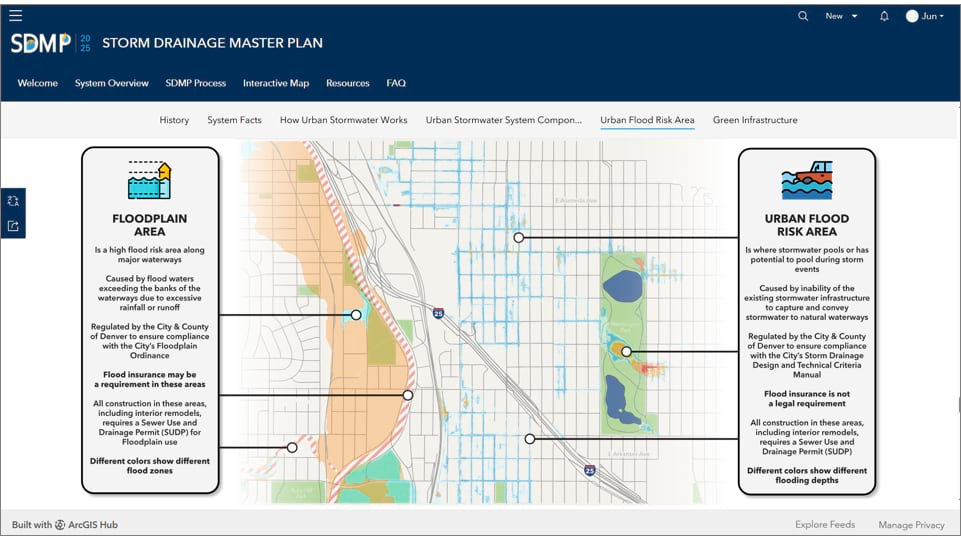
Resulting from that modeling, and core to the new online format, are interactive elements that are now available to the public and provide better awareness of urban flood risk, Meng said. Anyone can explore data by neighborhood, council district, drainage basin, or specific address.
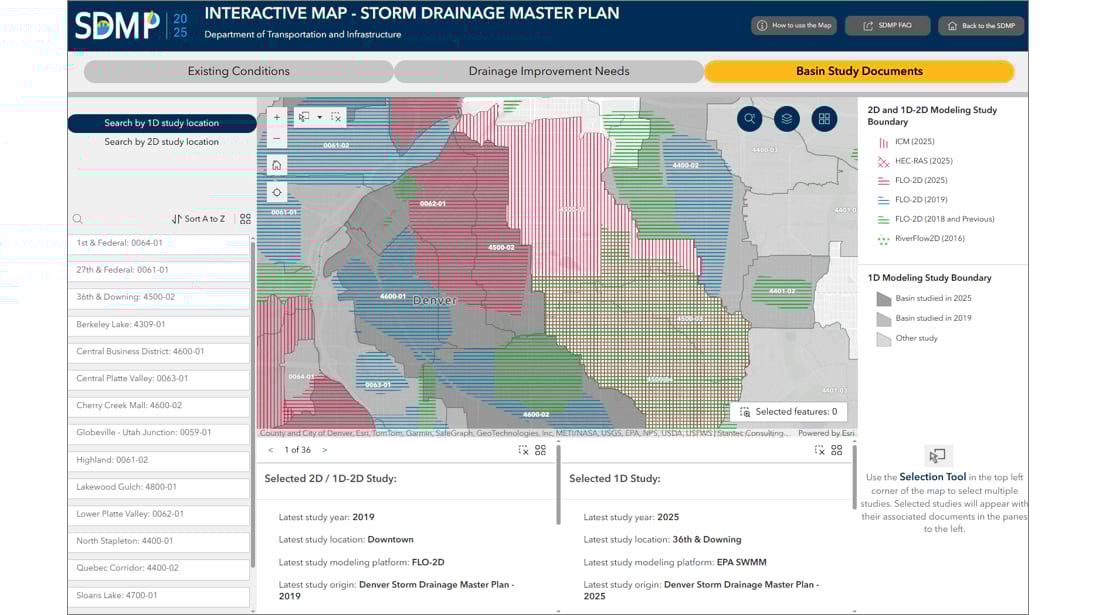
People can see existing conditions based on the likely depth of a 100-year flood event—ranging from less than three inches of rain to more than six feet. They can see existing infrastructure, including inlets and pipes as well as recommended drainage improvements and proposed storm-detention areas. If they need more technical information, they can consult the data and model behind the map for more detailed storm drainage studies.
Another key advantage: The information can be updated frequently. “Every time we complete a study, we can roll it out and update it and make it available,” Blackman said. In the future, he also hopes to have the plan translated into the multiple languages spoken in Denver.
He also wants to develop ArcGIS StoryMaps stories for the department’s projects, adding graphics and aerial imagery to give the public an enhanced view of what’s happening.
“We see this as step one out of who knows how many steps,” Blackman said. “There’s so much potential.”
Learn more about how GIS is used to map and model stormwater to mitigate flooding risks.