

When I shared the dashboards, everybody said, ‘Oh, this is like the COVID-19 dashboard’ and I said, 'Yes, except for crime.’
Crime Analysis Unit manager, SLMPD
Emily Blackburn
October 26, 2021
At times, the crimes are so brazen, so out in the open.
“They just don’t care,” said Captain Christi Marks, a commander with the St. Louis Metropolitan Police Department. “They don’t seem afraid of getting caught or of the consequences.”
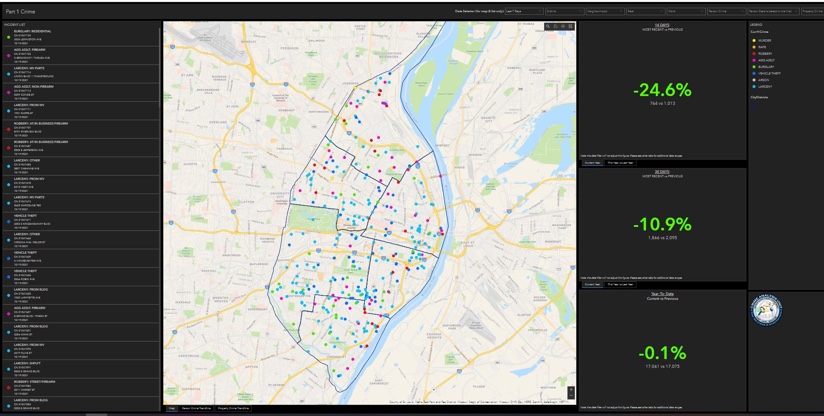
In response to what’s now a near daily occurrence of bold retail crimes in St. Louis, Marks and her team have taken a geographic approach—using maps and dashboards to locate crime patterns and allocate resources where they are needed most.
Marks has long used maps to understand crime trends in the city, beginning with a paper map and different colored pushpins she would use to mark each crime by category. This was in the early 2000s when Marks was a public affairs officer for the downtown district.
“As you can imagine, by the end of the year that map had thousands of holes in it,” she said. “I told my captain, ‘There has to be a better way.’” After investigating crime analysis and visualization tools, she took geographic information system (GIS) training to compile data and make digital maps.

“I remember how proud I was when I bound up all these crime maps in booklets,” Marks said. “Other captains were saying, ‘Where did you get that?’”
Twenty years later, and since 2007, the St. Louis Metropolitan Police Department has dedicated crime analysts who use GIS daily to inform patrol plans, aid investigations, and assist with resource allocations. The agency expanded access to GIS at the enterprise scale, giving the force of 2,000 people access to location intelligence.
Emily Blackburn, the Crime Analysis Unit manager, worked with crime and intelligence analyst Lindsay Maier to create interactive data dashboards with built-in filters anyone on the force can use to focus on specific locations or trends.
Blackburn understands what other crime analysts and researchers have learned: crime is highly concentrated, with 5 percent of the locations in a city accounting for 50 percent of that city’s crime. They also know that repeat offenders commit the most crime. These patterns inform decisions to increase police presence where it’s needed most.

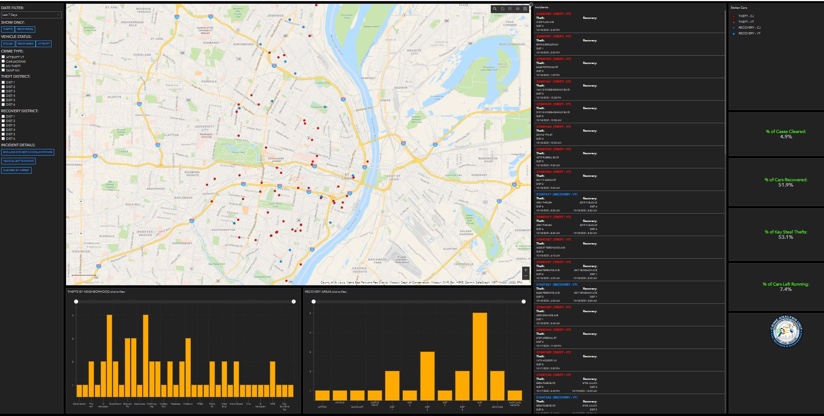
One of the GIS tools Blackburn and her team created is an application that combines data such as details from field interviews about crimes and information about the people who may have been involved. Officers can search the app when working to track down suspects and solve open investigations.
“We can look up any suspect’s street name in St. Louis, and you can use that or any alias in the app to get all frequented locations,” Blackburn said. “It really creates a good picture of a suspect, where they might be, and if they might be the person they’re looking for.”
Another app they created for police commanders shows a side-by-side map of crimes and police activity. “Now they can really see almost in real-time if officers are where the crime is,” Blackburn said.
When I shared the dashboards, everybody said, ‘Oh, this is like the COVID-19 dashboard’ and I said, 'Yes, except for crime.’
The pandemic brought new challenges to the crime analysis team, but also new opportunities to socialize their work and offer support for COVID-related shifts in crime patterns. They also used the time to improve their data consolidation and automation.
“It gave us back our commute time, so we had time to think creatively and do more with our data,” Blackburn said. “We also pulled back from police-initiated activity until we learned how to manage COVID-19.” The shift gave the department time to focus on taking GIS to every officer.
The rising popularity of public health dashboards increased awareness and adoption for police officers. Blackburn explained: “When I shared the dashboards, everybody said, ‘Oh, this is like the COVID-19 dashboard’ and I said, “Yes, except for crime.’”
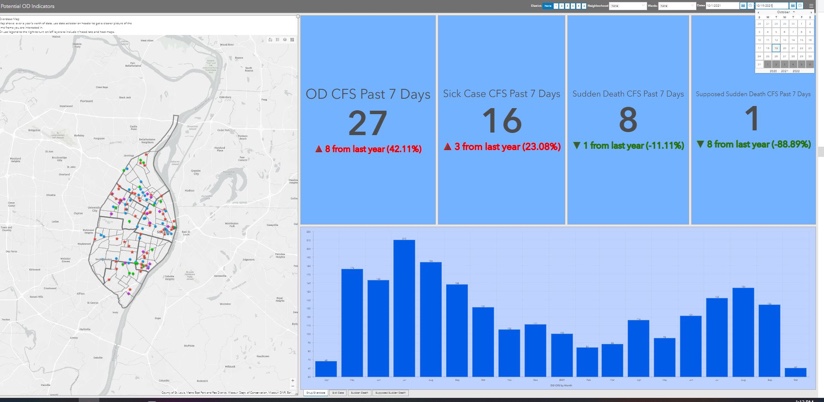
The police dashboards quickly oriented officers on how COVID-19 was impacting the areas they patrol. Maps show, for example, the number and locations of domestic violence incidents as well as suspicious deaths and overdoses—all of which became even more concerning during the pandemic.
“I get on the dashboards every morning for the daily stand-up meeting with all the commanders, captains, majors, and colonels—Monday through Saturday,” Marks said. “I can never be blindsided because every single incident that’s reported pops up, and it also tells me what’s up or down. I know exactly where everything happened, and I can click on just the dot to learn more.”
Now that many US cities are recovering from the pandemic, Marks hopes the added awareness from GIS apps and dashboards will keep residents safe and help return her city to vitality.
“You can go downtown on a night where there’s a baseball game, and you’ll see thousands and thousands of people,” Marks said. “And when I see that, it makes me so proud, because that’s my city and that’s what I want to see. I want to see the commerce. I want to see people coming to downtown. I want a thriving city.”
Learn how law enforcement uses GIS to track and understand public safety incidents.


November 1, 2018 |
August 28, 2019 |
April 9, 2018 |