March 3, 2026 |
Ryan Lanclos | Resilience
March 31, 2026
As a tropical cyclone gathered strength in the Atlantic last October, inching toward Jamaica, Francesca Williams watched from her desk in Texas, getting nervous.
“It was just creeping, just sitting there getting stronger and stronger and stronger, and Jamaica, it’s a tiny island with limited resources,” Williams said.
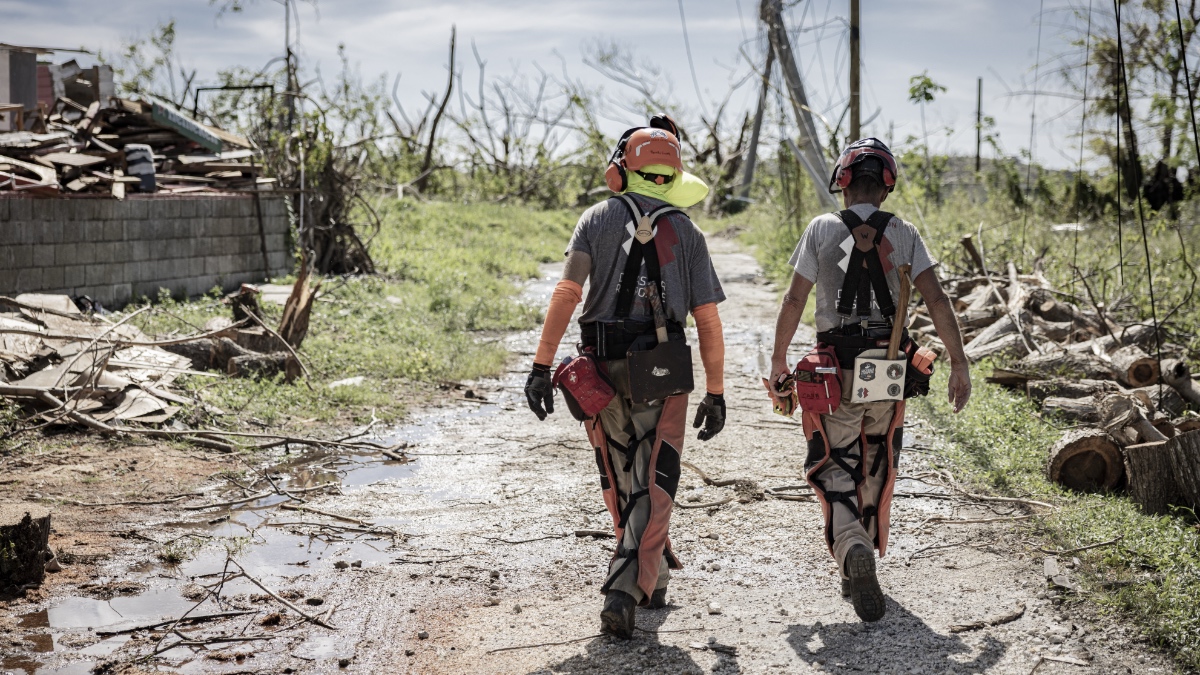
As the senior leader of mission support at Team Rubicon, a veteran-led disaster response nonprofit, Williams helps coordinate legions of volunteers across the US who jump into action on short notice after catastrophic wildfires, floods, and storms.
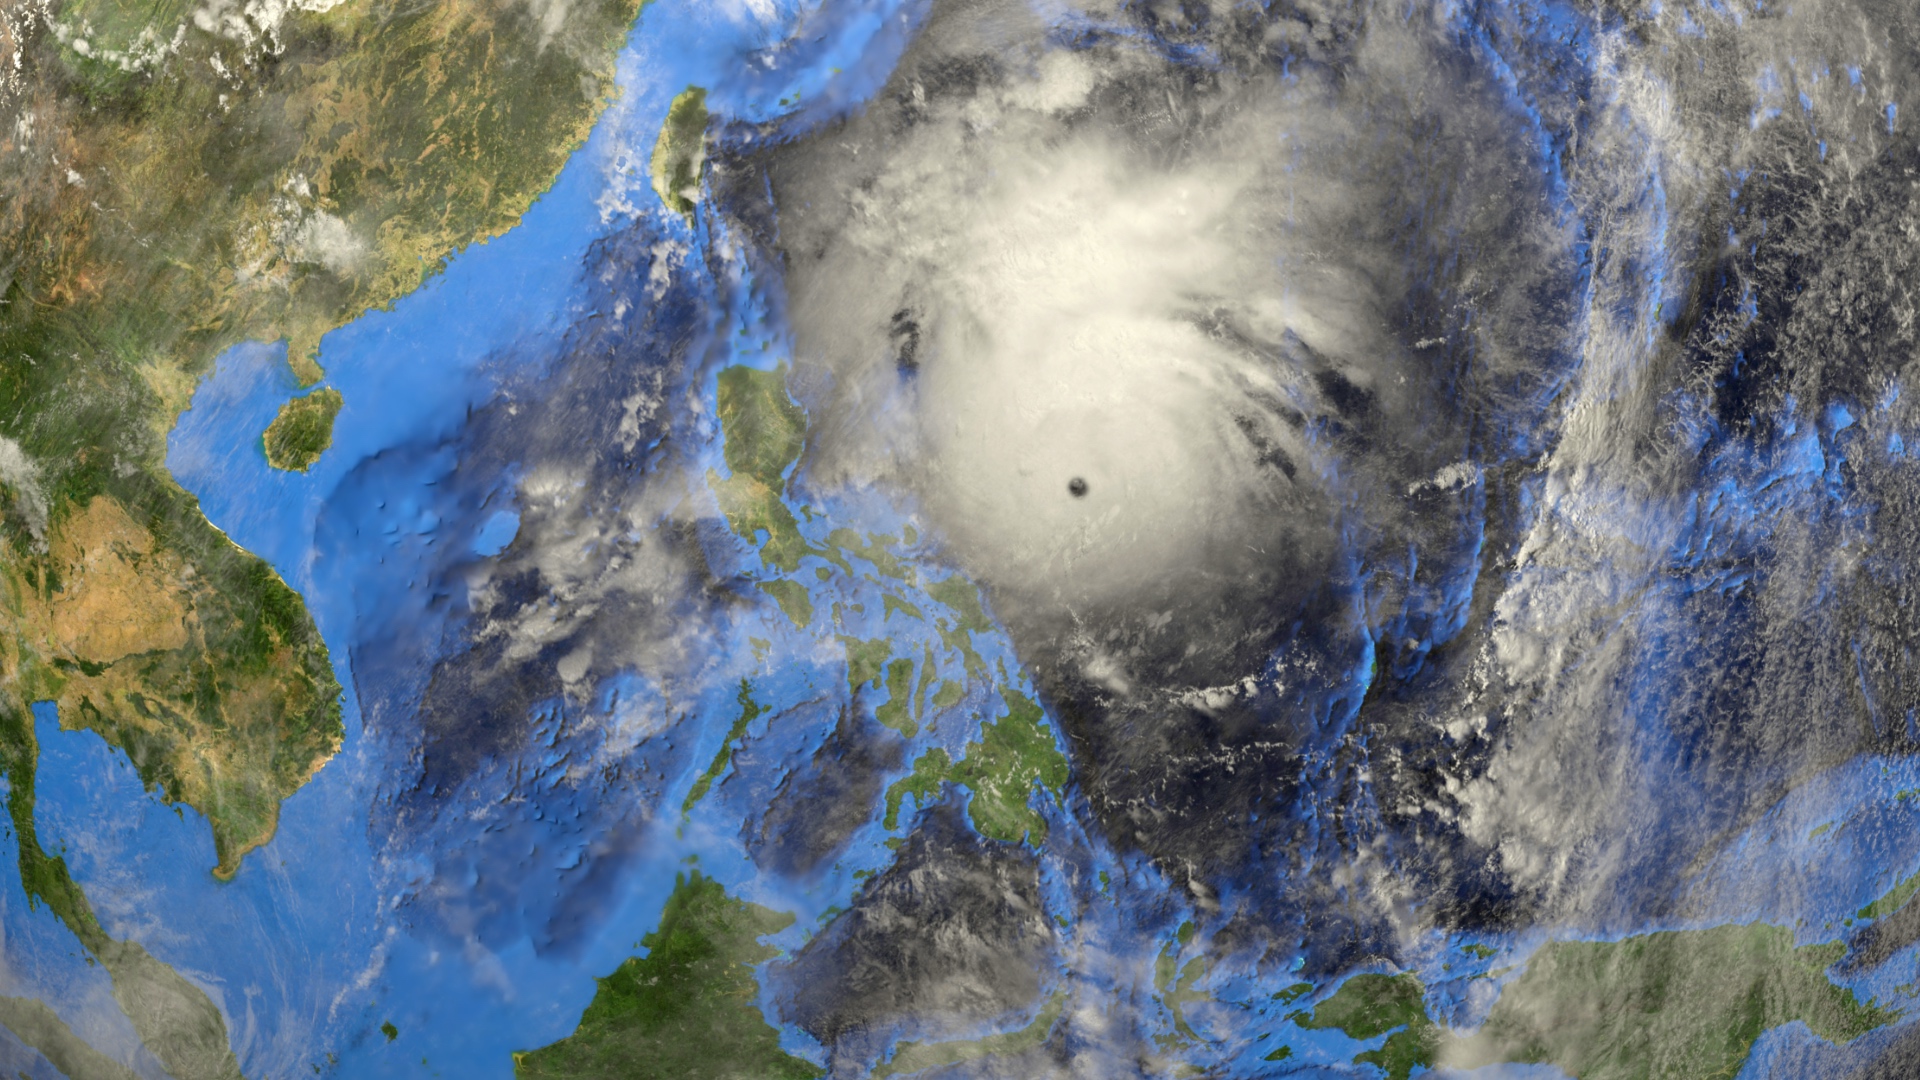
“There were just incredibly warm waters—88 degrees,” she said. The cyclone, dubbed Melissa, intensified into a Category 5 hurricane within hours. “That’s when I knew that we would try to do something,” she said. “I didn’t know that we would be responding like we did.”
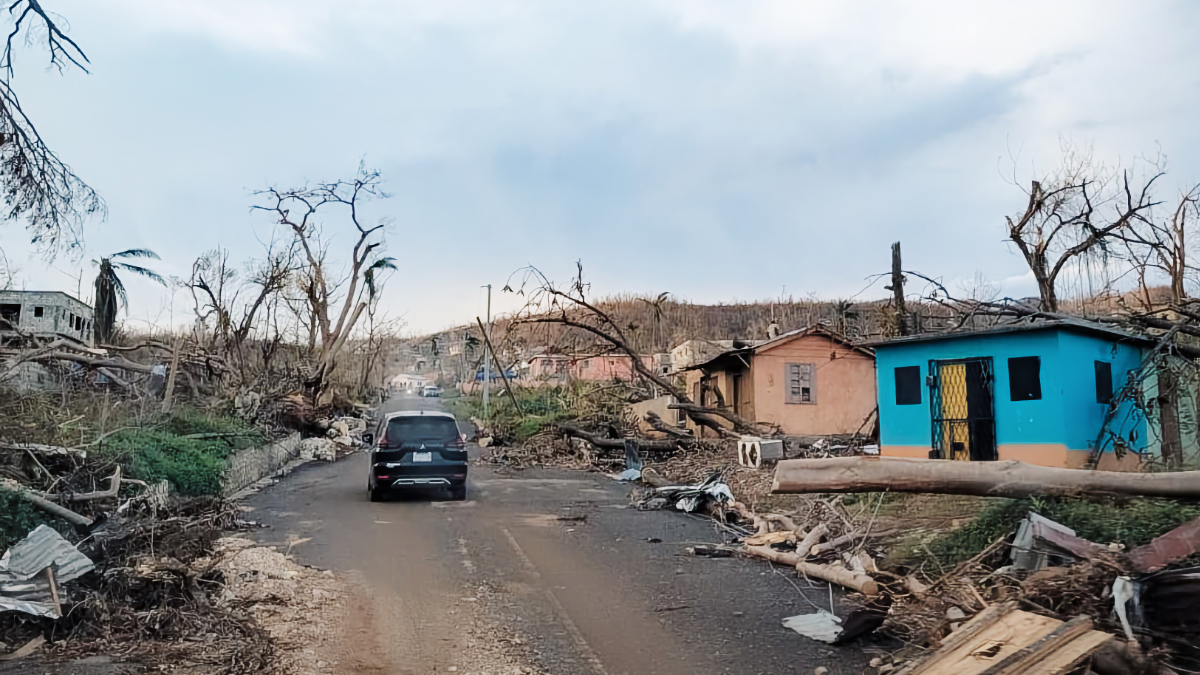
On October 28, the hurricane slammed into the western side of Jamaica as the country’s strongest on record, beating 1988’s Hurricane Gilbert and unleashing catastrophic winds and torrential rain. Forty-five people in Jamaica would die from Melissa and its aftermath, and more than 626,000 people across the country would be displaced or impacted.
In the hours after landfall, that was all still unknown. The fog of disaster was still clearing. Much of Jamaica’s electricity was out, and it would be days before basic communications were restored across the 33-mile-long swath of damage.
Williams needed to see more. She opened a website she had been developing—a cloud-based portal that incorporates flows of real-time data into a collection of maps and dashboards. Tied to shared databases and offline apps built with geographic information system (GIS) technology, the Geospatial Hub was designed to give decision-makers and volunteers a living common operating picture.
It wasn’t exactly ready (“I’m a perfectionist,” she said), but its maps were already helping decision-makers understand what was happening on the ground, and where, in real time. “We wanted people to have access to our maps for this,” she added.
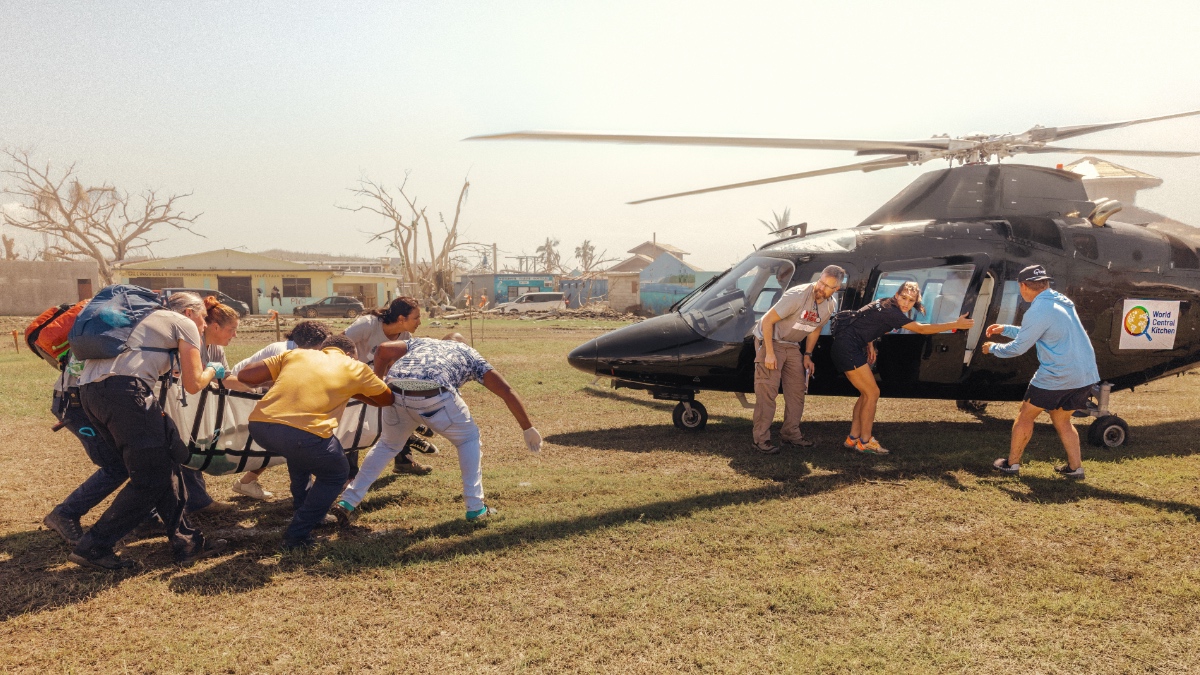
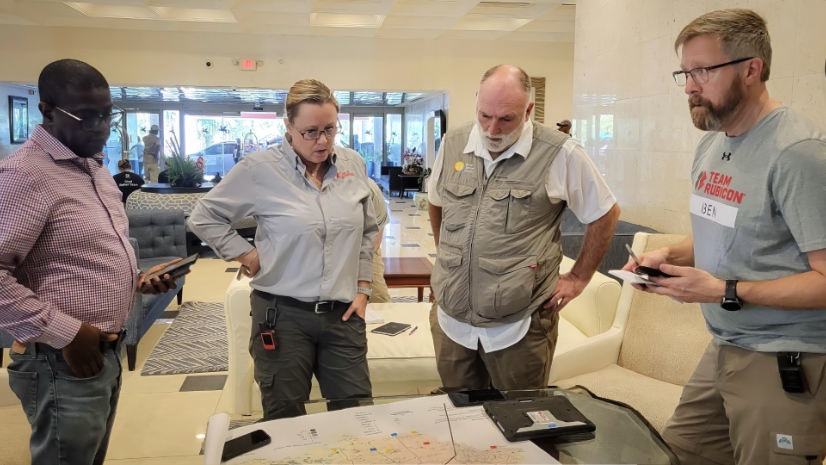
In Chicago, Traci Rankin and Justin Cronin, Team Rubicon’s deputy directors of mission support and operations, were also on the Geospatial Hub, watching the storm’s progression and preparing for a possible full-scale operation. Tracking Melissa’s enormous eye as it cut across the island, they had already decided to dispatch a small medical team. Next, they had to figure out where, and just how bad, the devastation was.
Better geospatial awareness was especially critical because this was relatively new terrain. Team Rubicon, which launched 85 operations in 2025, hadn’t mounted a large-scale international operation in a few years. The group cut its teeth responding to catastrophic earthquakes in Haiti and Chile in 2010 and has since deployed to over 30 countries. But overseas recovery efforts, involving mucking outs, roof tarping, and chainsaw work, can be incredibly expensive. “There’s a lot more planning and logistical support that goes into it,” Williams said, including careful coordination with a range of government agencies, local communities, and nongovernmental organizations (NGOs).
Those challenges can slow what Williams calls “speed to need,” a term heard often among the group’s employees and volunteers.
“It means getting boots on the ground faster, getting help to the people that need it most—as fast as possible—while still making sure that we cover all of our bases on the back end,” Williams said. “It seems obvious, but it needs to be remembered, repeated.”
The first question for Williams—and for her myriad counterparts across the Jamaican government, its partners, and a growing number of NGOs—was which places were hit hardest and who would be most impacted.
“One of our big focuses is vulnerable communities,” Williams said. “We’re trying to find those niche populations that are more vulnerable than other populations and probably don’t receive the same type of assistance that others do.”
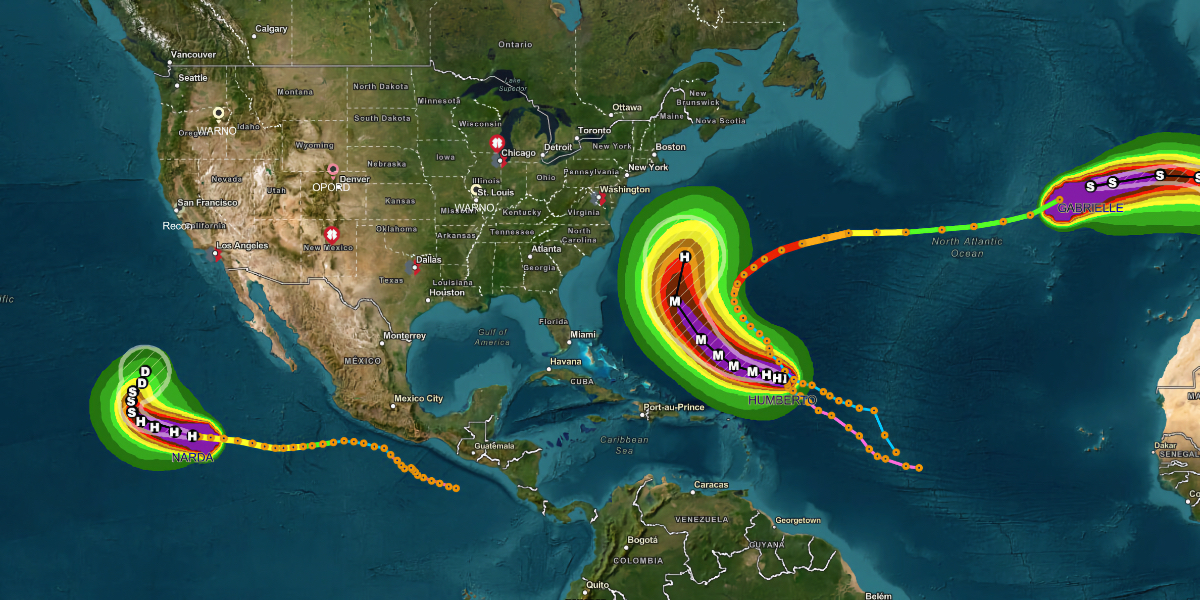
Even before landfall, she’d added layers to the map: National Hurricane Center forecasts over population density and flood-prone zones, Social Vulnerability Index data from the Centers for Disease Control and Prevention (CDC), and the Federal Emergency Management Agency’s National Risk Index. She overlaid those with forecasts for the storm’s path and areas likely to flood. “Those types of datasets really help us narrow down before we even have people on the ground,” she said.
On another tab, National Hurricane Center pages dedicated to Melissa kept refreshing to show where the storm was located, while a YouTube feed carried live multi-camera views from the island. In the Overview tab, a big-picture map showed the status of Caribbean airports, the locations of Jamaican hospitals, and Team Rubicon’s other assets, including caches of supplies and the locations of its specialized “Greyshirt” volunteers—doctors, nurses, heavy equipment operators, and chainsaw experts.
By day two, as a dissipated Hurricane Melissa moved over eastern Cuba, a new layer appeared on the basemap, with imagery from Vantor, the satellite giant formerly known as Maxar. A feed from social media platform Factal provided AI-filtered updates on ground conditions.
Meanwhile, volunteer analysts on Williams’s small GIS team collected more social media data, which they added to the map via an ArcGIS Survey123 app or dumped into a Microsoft Excel spreadsheet for later processing. “Some of the [volunteers] are super good with tech. Some of them, they’ve never had a Facebook in their life,” Williams said.
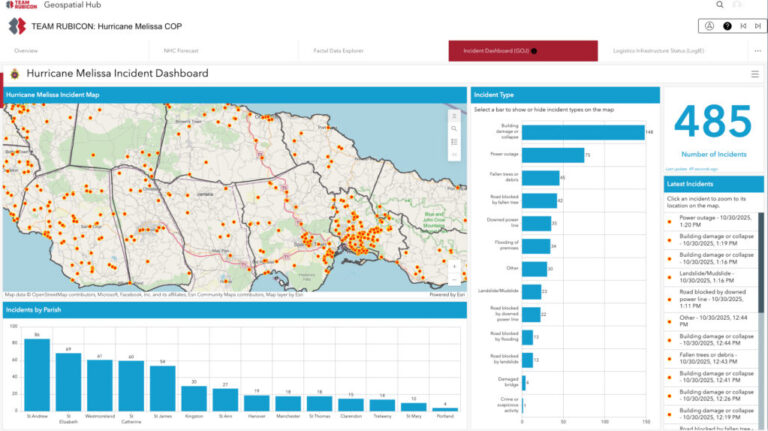
An Incident Dashboard tab, designed to display preliminary damage, drew on data from the Government of Jamaica (GOJ) and the National Alliance for Public Safety GIS Foundation (NAPSG), both of which were already processing field reports from teams of government and NGO volunteers. That data fed into the dashboard and authoritative map layers from the government’s geospatial repository. Using WhatsApp, a team of analysts also added geolocated photos of blocked roads and flooded neighborhoods sent in by residents as they began digging out. If you clicked a red dot on the map, which indicated a road blocked by flooding a photo of the damage would pop up.
With that data, “we were able to get a lay of the land across the country,” Williams said.
As Jamaicans sought supplies and temporary shelter, Williams and her team could see the numbers ticking up. The devastation was especially heavy around the Westmoreland and Saint Elizabeth parishes, where storm surge, flooding, and high wind gusts from Melissa’s eyewall destroyed infrastructure and agriculture and inundated towns. The coastal town of Black River, “was probably the hardest hit community,” she said.
In studying the grim aerial imagery—along with photos sent in by people who had just lost their homes—Williams recalled the devastation she and her colleagues had seen a year earlier in the wake of Hurricane Helene. Like Melissa, Helene struck hardest in areas that were already extremely vulnerable.
“We can’t go to everybody,” she said. “What this helps us do is narrow down pockets of areas that we should prioritize.”
When the first four Greyshirts departed for Kingston on Thursday, October 30, they carried the Geospatial Hub on their phones via ArcGIS Field Maps, with functions offline when connectivity fails.
“We have a lot of people that are very much put-a-pin-on-a-map type of people, and they don’t like pointing to a computer screen,” Williams said. In addition to printing large maps to hang up at bases, her team equipped volunteers with 8×11 pocket maps for times when they didn’t have cell service. Given the devastated telecom infrastructure and heavy demand for limited bandwidth, they often didn’t.
As the four-person team pushed into Westmoreland, Jamaica’s westernmost parish, they used the maps to avoid roadblocks and track both the devastation and the medical response as they encountered injured people. New damage assessments, made using government land and aerial surveys, along with data from the Los Angeles County Sheriff’s Department Search and Rescue team, appeared as red dots on the map.
“That helped us get a sense of what routes to take, what routes we should probably avoid, what portions of the island were most heavily impacted,” Williams said. Within days, the Office of Disaster Preparedness and Emergency Management in Jamaica had identified about 215,000 damaged buildings across the island—nearly 20 percent of Jamaica’s structures.
On day three, the team set up a small field operation next to a hospital in Westmoreland to connect with community members and a growing network of NGOs while waiting for government approval to begin cleanup operations.
“The big thing was the coordination piece,” she said. “We wanted to make sure that we were coordinating with those local officials as well as with other nonprofits.”
As dozens of local agencies, aid groups, and companies got to work, the government’s National Emergency Response GIS Team (NERGIST)—made up of experts from various government agencies, including the Office of Disaster Preparedness and Emergency Management—worked to coordinate all recovery efforts. It helped that many operations were using the ArcGIS cloud and that Esri’s disaster response team had also mobilized to ease communication and collaboration.
“Having the partnerships with Esri, it allowed us now to better understand the space in which the humanitarian groups worked and allowed them to understand who to come to for the authoritative data,” said Alicia Edwards, principal director of the National Spatial Data Management Branch of Jamaica. “It really reduced the guesswork and also helped teams act with confidence, and having that one sort of communication group allowed also for the different initiatives to have greater impact.”
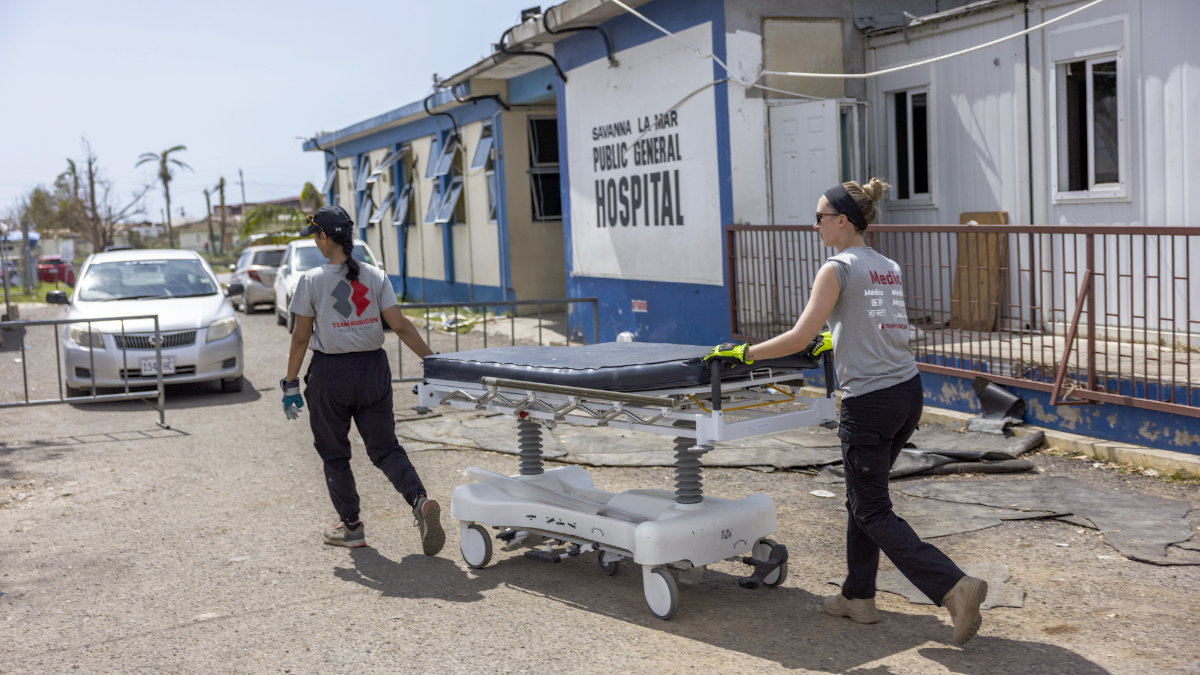
In Chicago, Rankin and Cronin were watching the damage tick up in the dashboards as they planned for a larger deployment. The maps and consultations with health officials pointed them to Savanna-la-Mar Public General Hospital—which Melissa had badly damaged—as the best staging point for a clinic.
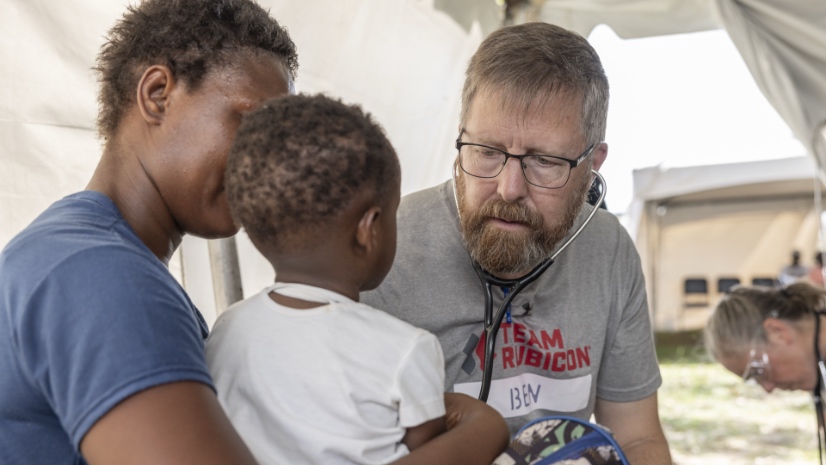
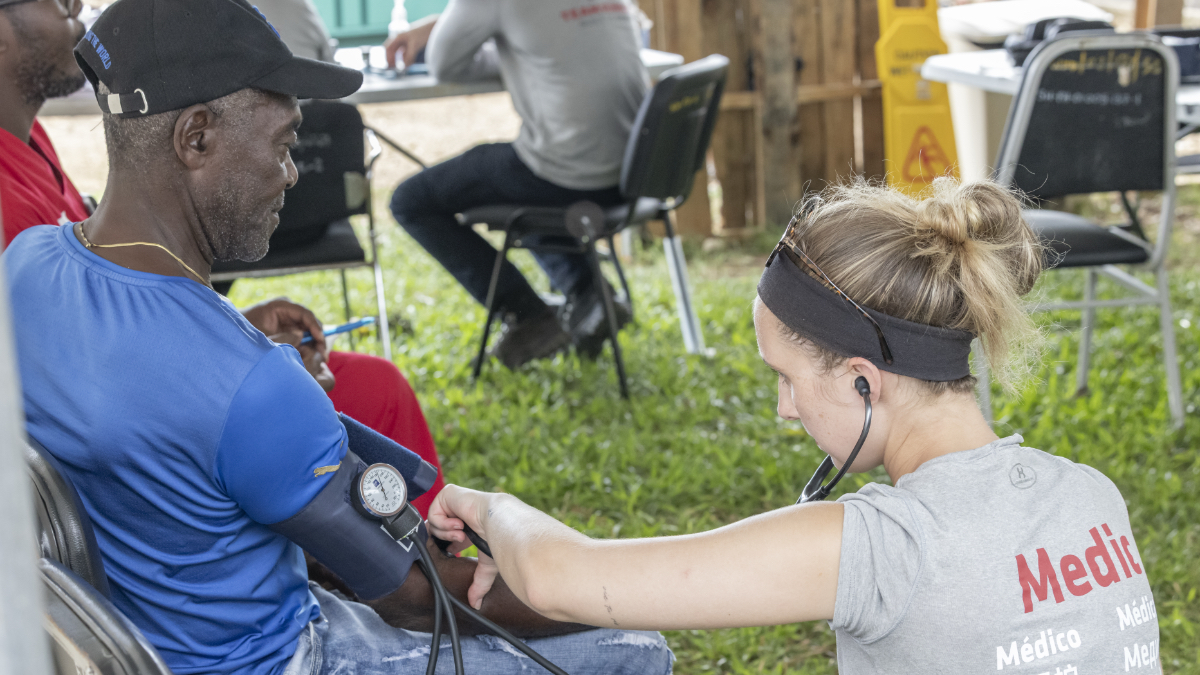
About a week after landfall, a team of 15 Team Rubicon volunteers arrived as part of an EMT Type-1 Mobile Team—registered nurses, paramedics, and logistics members—for a two-week stint. The medical operation lasted longer. Working in coordination with the Ministry of Health and the Pan American Health Organization (PAHO), 59 Greyshirts treated 2,221 patients—many of them with critical wounds—at two clinics between November 6 and December 19.
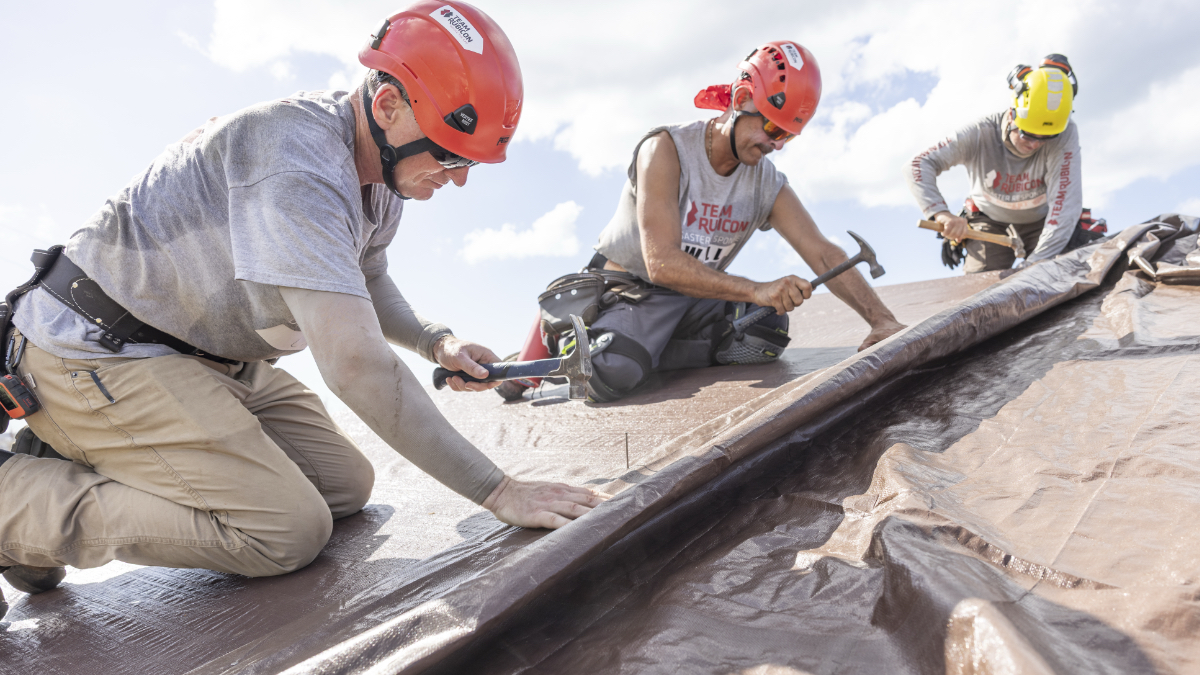
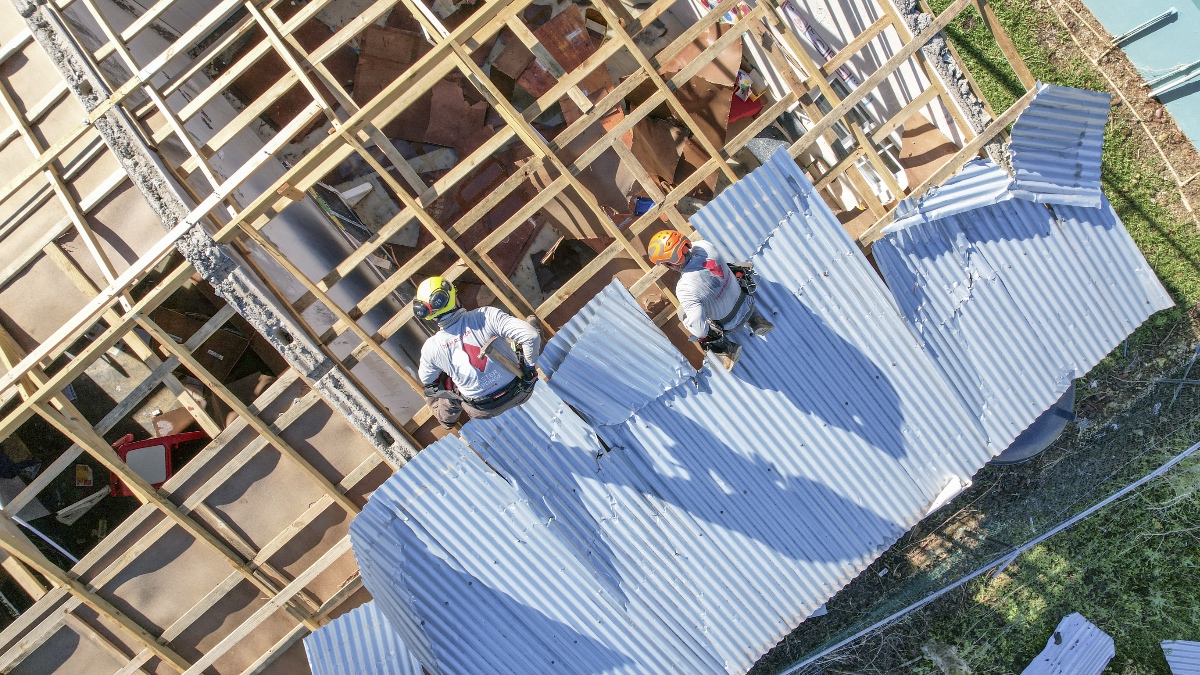
While preparing for the medical operation, mission planners recognized that the extent of the damage might necessitate a larger response. Soon, another four-person advanced team arrived, composed largely of highly skilled Greyshirt sawyers, who quickly coordinated with officials from the National Works Agency. By mid-November, the first of three teams of 30 volunteers was busy with mucking outs, roof tarping, and general debris removal. As they went, volunteers used the Survey123 app to collect data, feeding a dashboard that tracked on-the-ground work and generated reports for the Government of Jamaica, detailing where work was done and who it impacted.
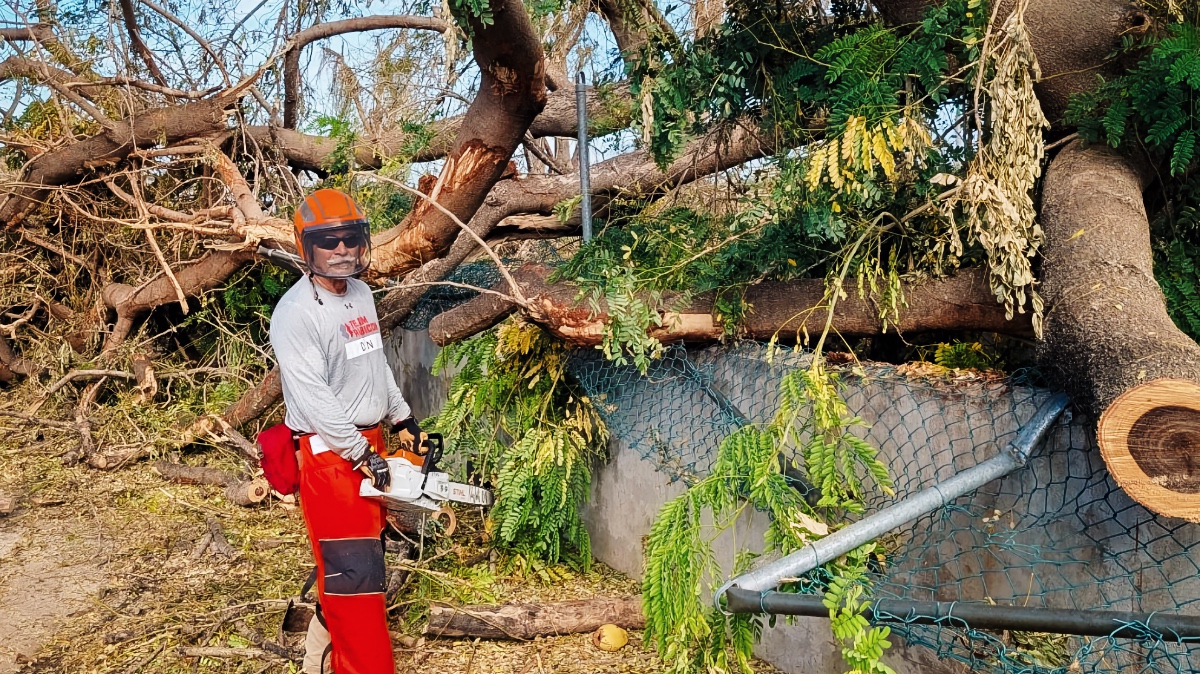
David LaRivee, a Greyshirt who also deployed to Haiti in 2010, was grateful that the death toll from Melissa was far lower by comparison.
But “in terms of physical damage, it was comparable,” he said in a Team Rubicon blog. “Entire sections of towns were reduced to rubble. All public services were gone with little hope of a quick restoration.”
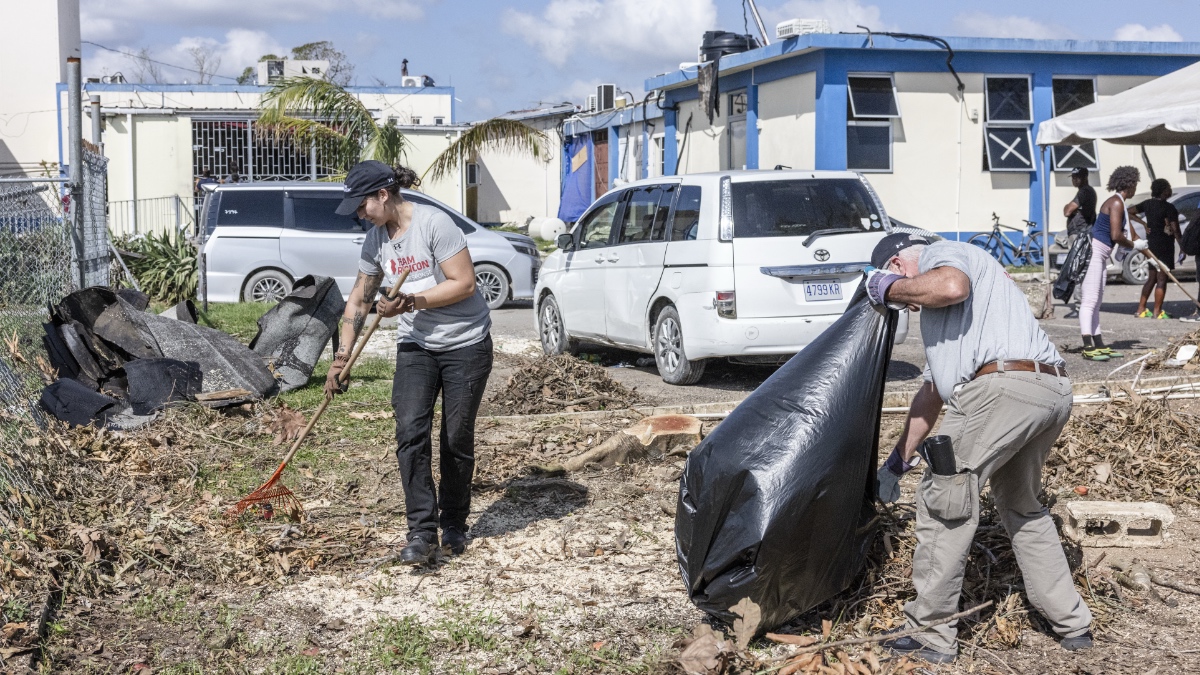
Team Rubicon volunteers worked through Thanksgiving alongside partners like José Andrés’s World Central Kitchen and Samaritan’s Purse, in addition to government workers and local volunteers, many of whom were “doing so while facing incredible disparities themselves,” recalled Megan Painter, a Team Rubicon nurse.
Three months after Melissa hit, recovery had made dramatic progress. According to government figures, approximately 280,000 people had been reached with humanitarian assistance—including food distributions, hot meals, and cash-based support—as distribution operations wound down.
Still, the costs of the catastrophe continue to mount—102 deaths were attributed to Melissa across the region, including in nearby Haiti, where 43 people died. An aid package of up to $6.7 billion over three years and an additional $150 million payout from Jamaica’s pioneering catastrophe bond will help cover part of the losses from the storm, now estimated at more than $9 billion.
Edwards credits the speed and strength of the response to an outpouring of help from overseas volunteers, informed by rapid, on-the-ground geospatial assessments that “helped us know where the destruction happened most,” she said. “I didn’t know we had so many friends, but we do.”
In advance of the next disaster, Williams is focused on building out Team Rubicon’s GIS Cadre. A GIS disaster-response volunteer can build maps, dashboards, and operational analyses about Team Rubicon’s responses, as well as related apps and ArcGIS StoryMaps stories. As she continues developing the Geospatial Hub, Williams wants to see it incorporated into planning and executing all the group’s operations.
The Geospatial Hub and its related apps already give leaders a clearer visual of where exactly teams are and the scale of their impact during disasters. Alongside “speed to need,” keeping costs low remains a constant priority, especially amid a tumultuous economic and philanthropic landscape.
“We have to be really specific with how we spend our donor dollars,” Williams said. Team Rubicon calls it the “Your Mother’s a Donor” principle—spending every dollar as carefully as if one’s own mother donated it. “There’s no guarantee that when there’s another disaster, that we can fundraise for it.”
Still, record-breaking storms will keep coming.
“In a world of climate change,” she said, “there is a guarantee.”
Explore how GIS supports emergency operations before, during, and after a storm.