
May 17, 2022 |
September 16, 2022
Finding common ground on our most complex issues—including how to collectively act on our changing climate to safeguard our common home—starts with a foundation of shared knowledge, expertise, and information.
As the US advances on its climate action goals with the passage of a massive legislative package, the White House is debuting a new tool—developed with the National Oceanic and Atmospheric Administration, the Department of Interior, and the US Global Change Research Program—that offers scientific data to help us better understand, at a local level, what’s happening with our changing climate.
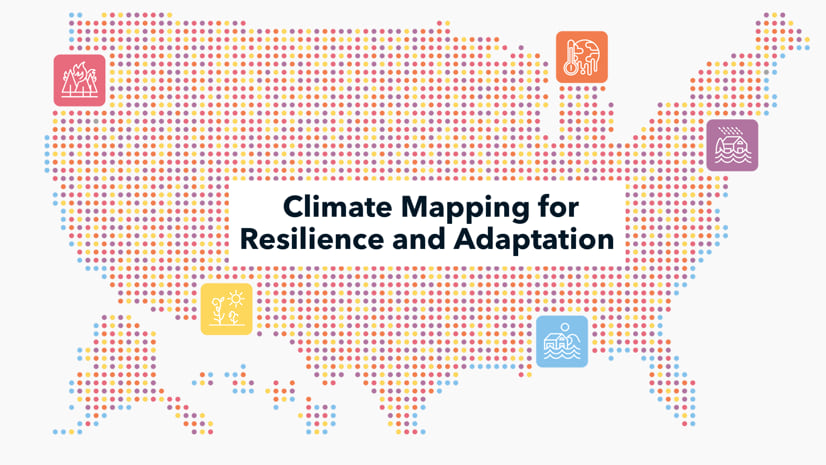
Esri is proud to collaborate with the Biden administration on the new Climate Mapping for Resilience and Adaptation (CMRA) Portal, that can help cities, counties, states, and tribes to make better decisions about where and how they need to act. Central to the portal, colloquially being called “camera” by its creators, is the CMRA Assessment Tool; with it, we can explore current and projected climate conditions where we live and work.
With the historic investment to overhaul infrastructure in the United States under way, we urgently need to make sure the roads, bridges, railroads, power grids, water systems, transit routes, airports, and ports that we build and renovate achieve climate resilience for all people in all communities. To do so, we need to understand before we act.
Much of this information isn’t new. The new portal builds on years of scientific knowledge and investments in geospatial platforms, but in the past these resources have been difficult to find and understand, particularly since they were not integrated to provide a more complete picture. That’s where geographic information system (GIS) technology plays a key role, integrating information to help us understand our complex problems in the crucial context of location.
This portal brings the data together, for everyone to see, into one place—on maps, in charts, and in reports. Environmental data, as well as the social and economic factors that shape how well we can bounce back from climate-related hazards, can be explored by anyone, including city planners, resilience officers, transportation planners, tribal leaders, and residents.
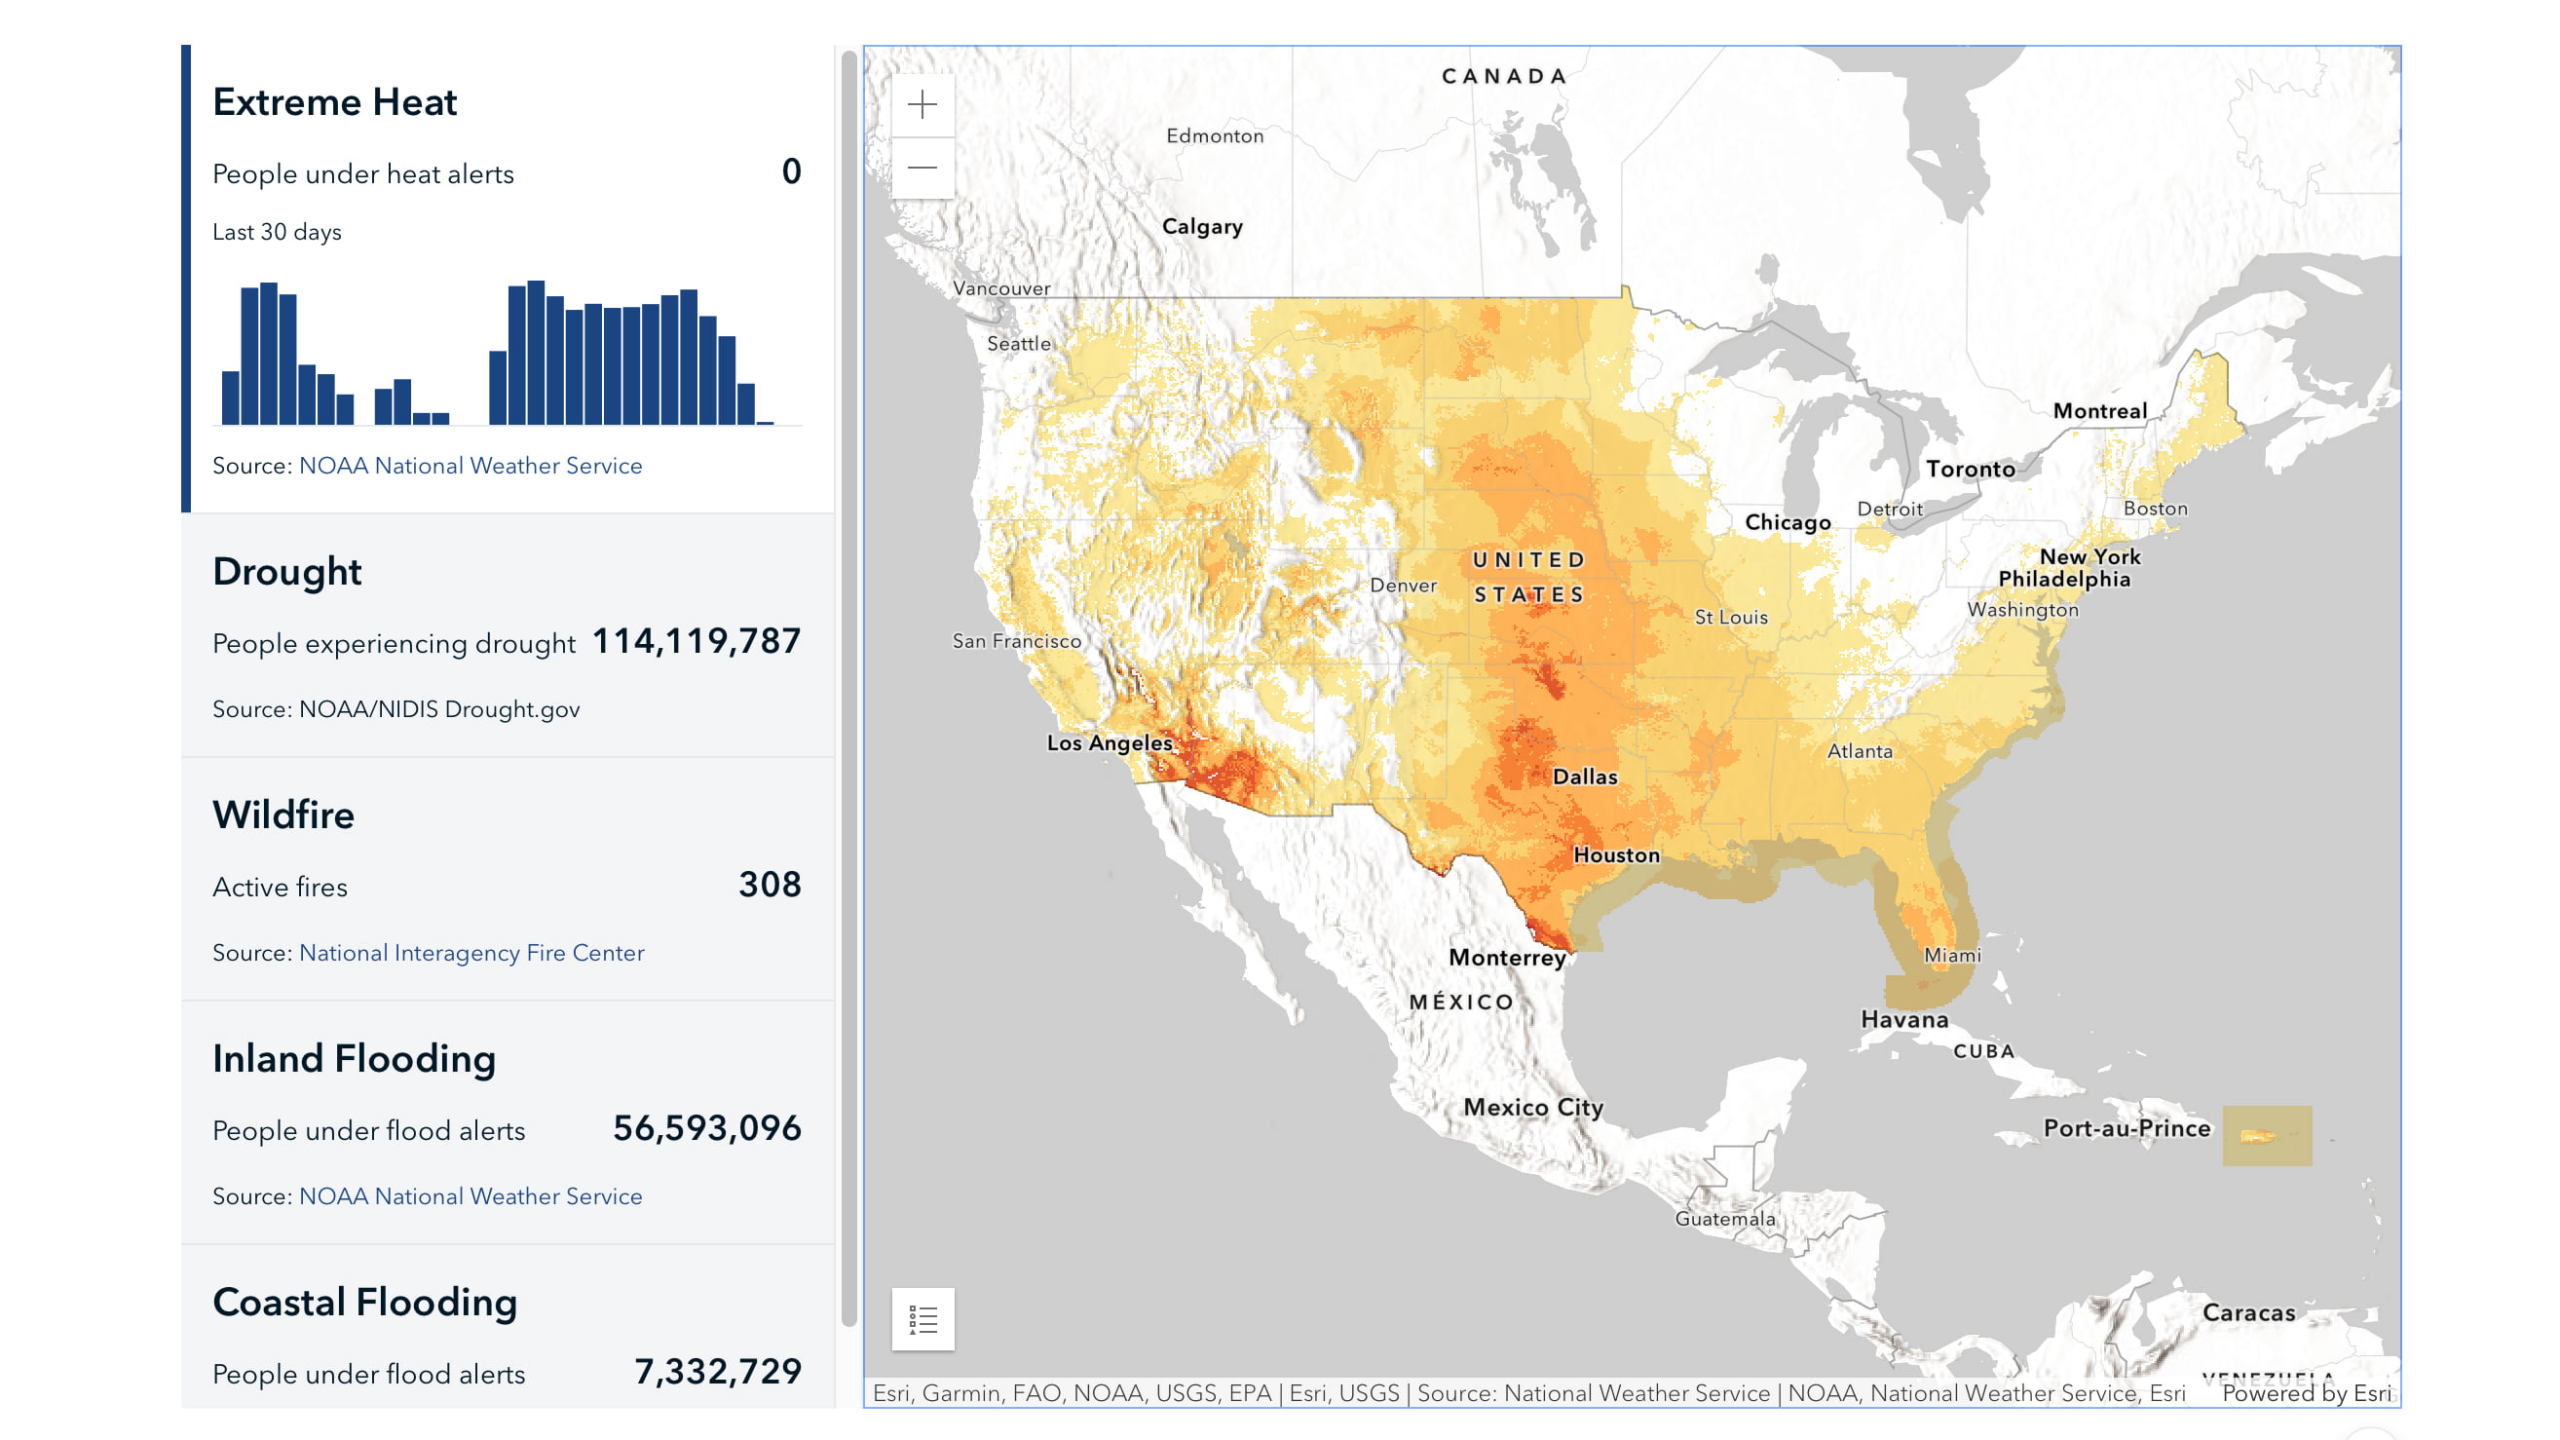
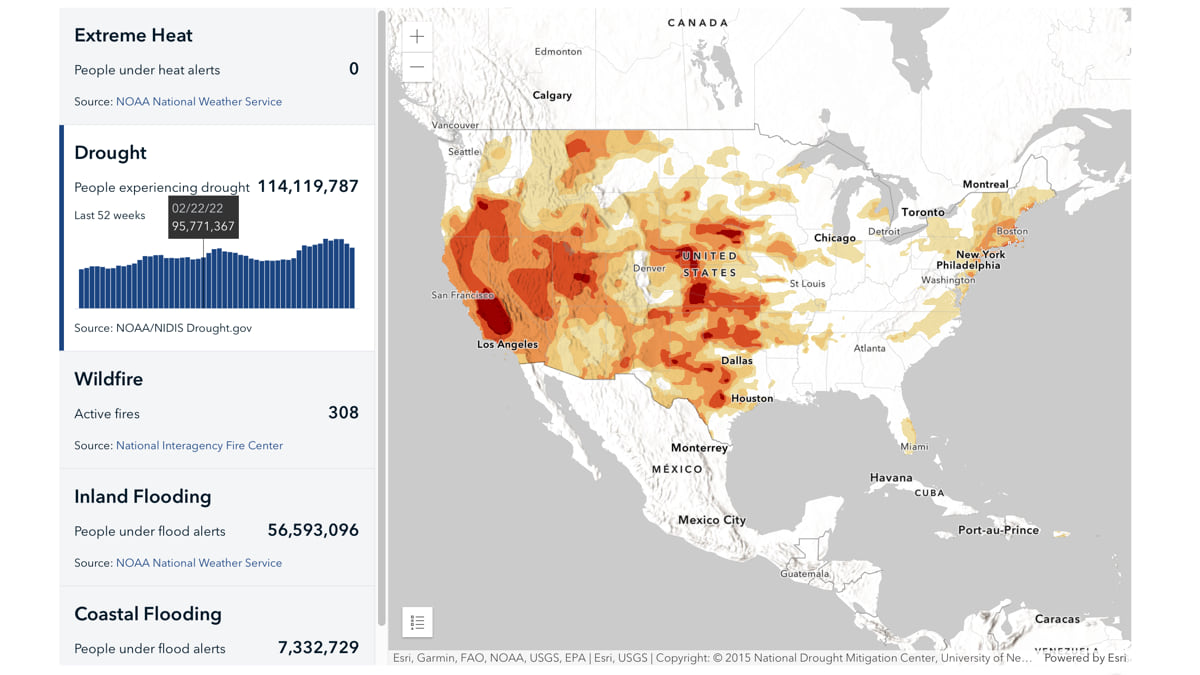
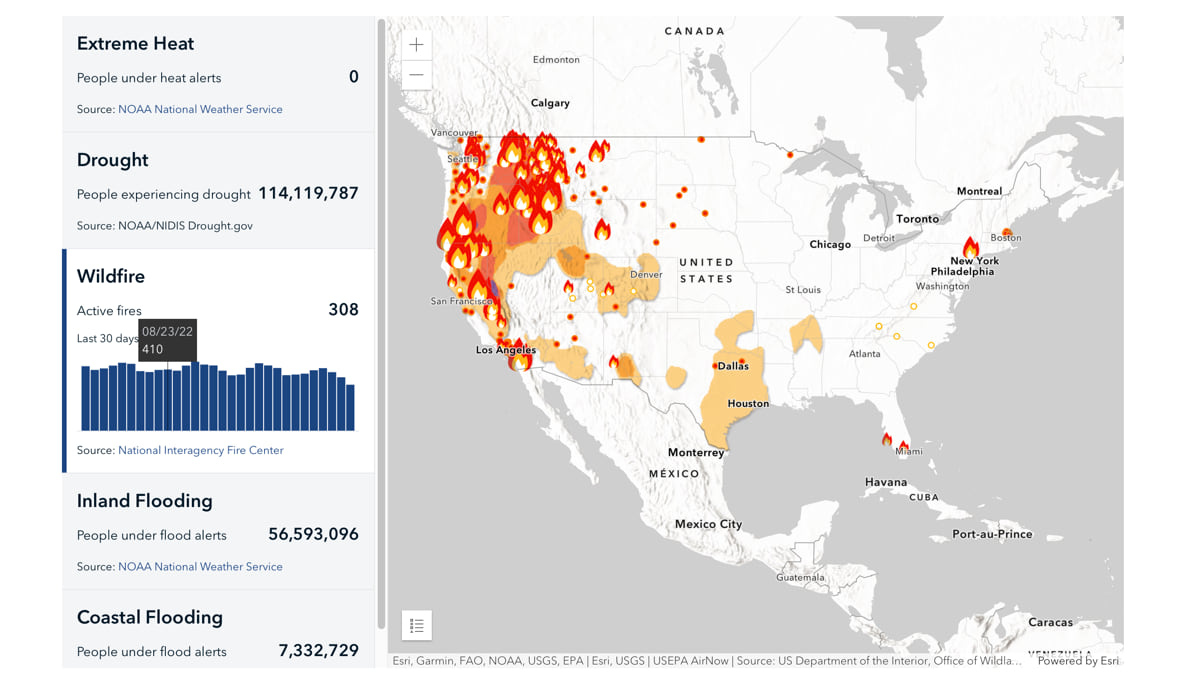
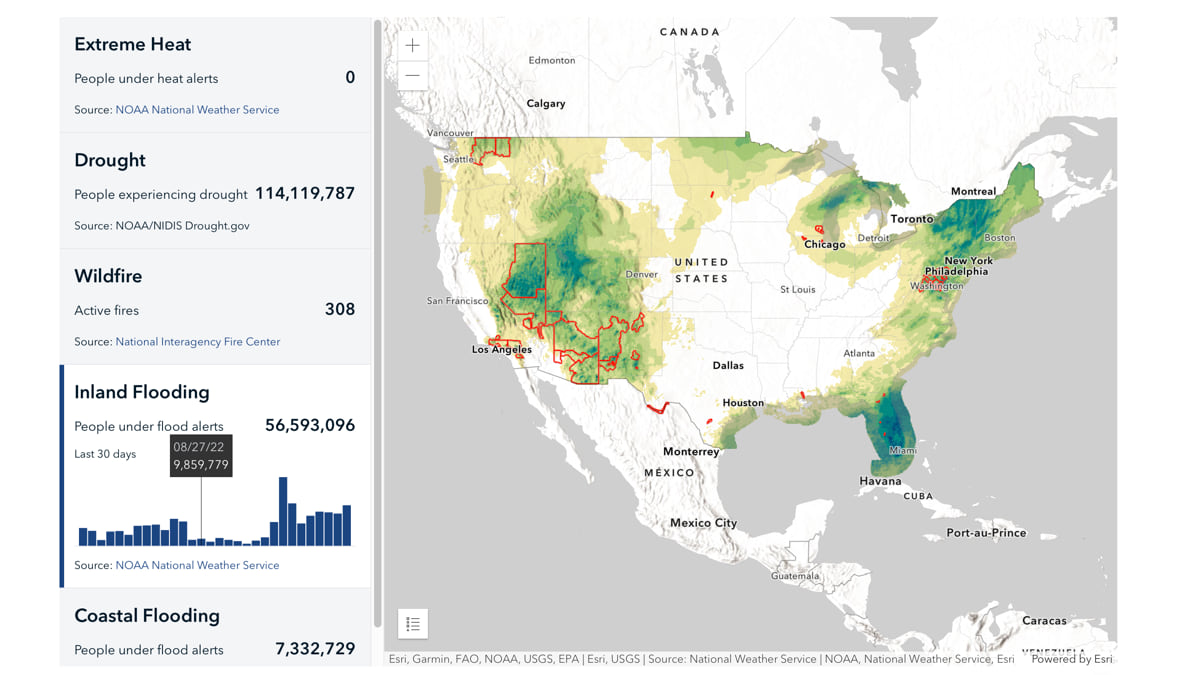
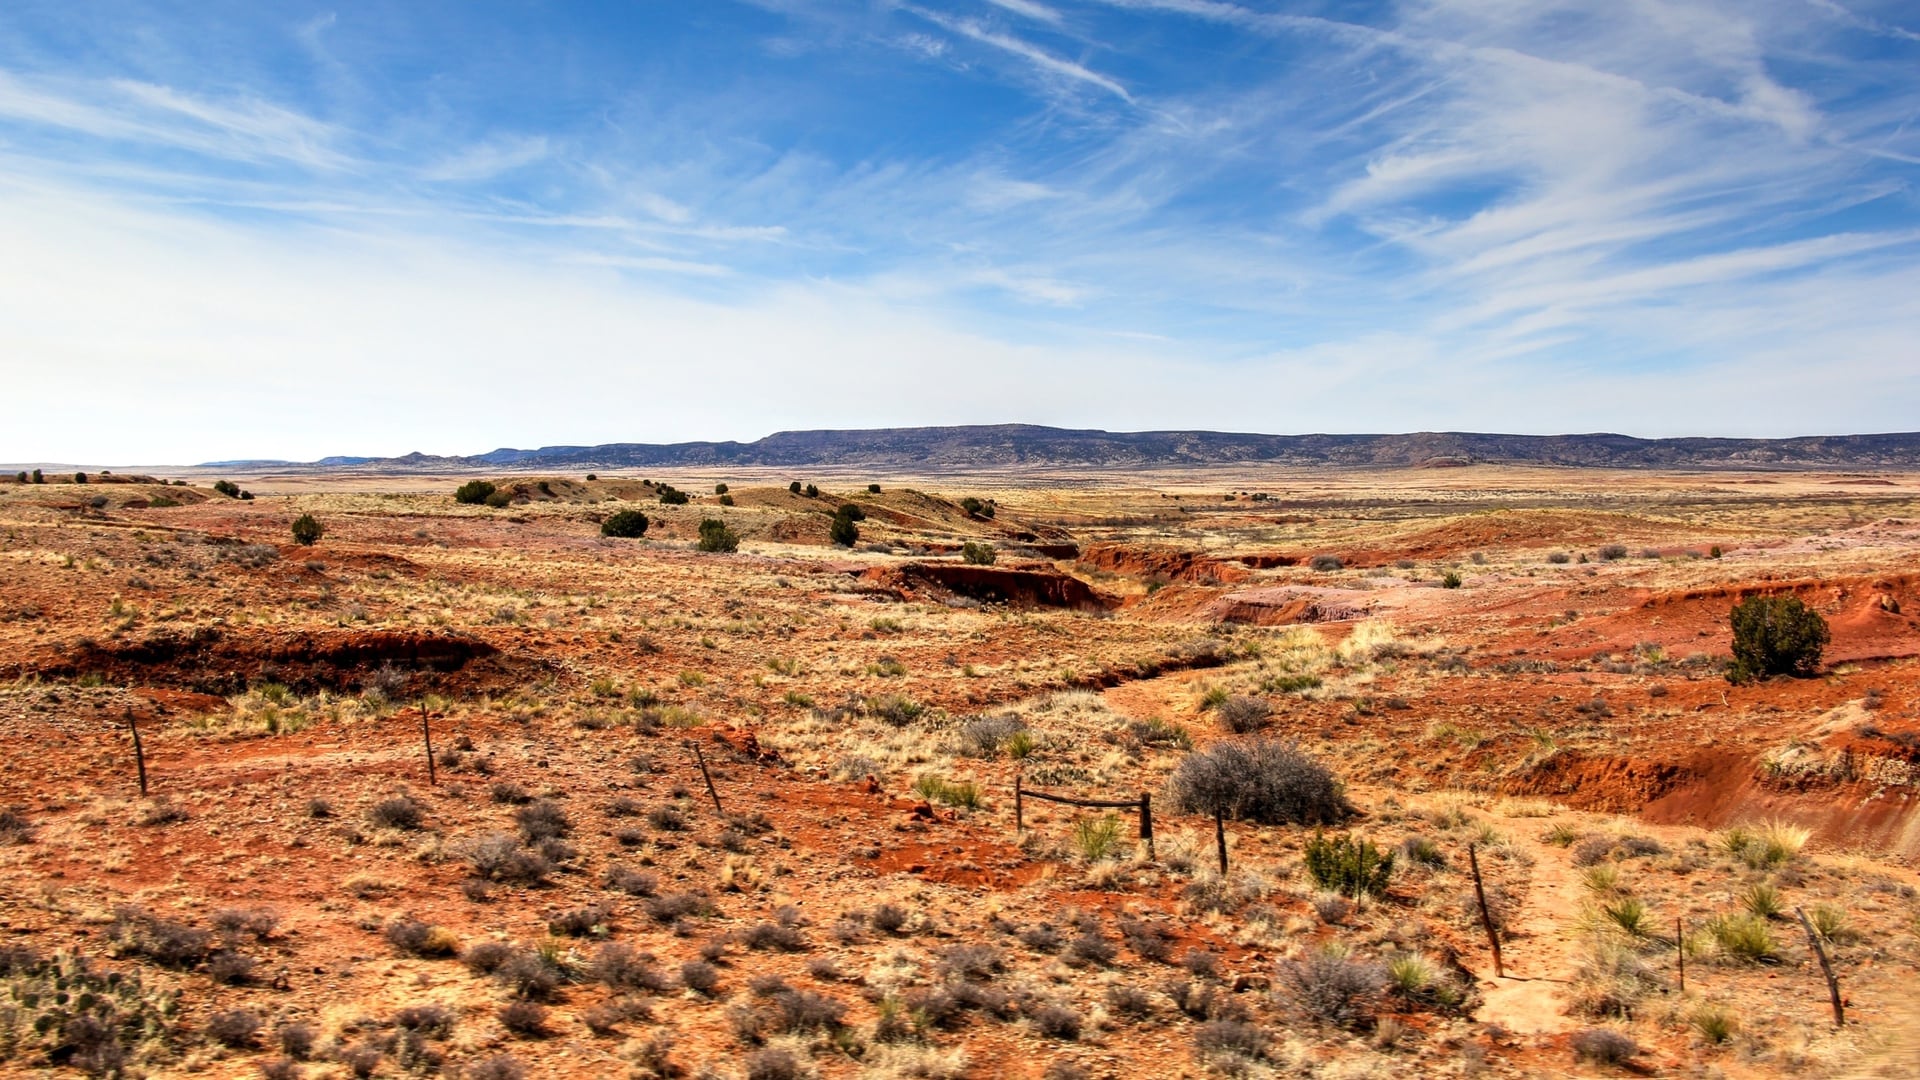
Type in an address or pick a point on a map in the new CMRA Assessment Tool and it reveals future climate projections related to extreme heat, drought, inland flooding, coastal flooding, and wildfire. The results show projections for the early years of the 21st century (2015–2044) as well as the middle (2035–2064) and late (2070–2099) years of the century, based on two climate change scenarios: one in which we reduce global emissions of heat-trapping gases to zero by about 2040, and one in which emissions increase through 2100. Among the many indicators are projections related to extreme rain or heat, number of consecutive dry days, and percent of coastal counties impacted by global sea level rise.
Extreme heat can be judged based on the annual number of days exceeding 105 degrees Fahrenheit. In the census tract that includes Esri’s Redlands, California headquarters, for example, the results reveal possibly 22–42 days per year by the late century (compared to fewer than 4 days in 1990, the year used as a baseline for emissions calculations by many international organizations). In Washington, DC, the number of days with temperatures exceeding 95 degrees Fahrenheit grows from nearly 19 days per year in the early part of the century to as many as 64 days by the last years of the century.
While climate action strategies have become commonplace in some larger metropolitan areas, including Boston, Miami, and Los Angeles, a data-driven approach may have been out of reach for others. The CMRA Portal aims to fill knowledge gaps—helping communities identify climate threats so they can prioritize resilience-building actions and discover programs offering funding to make solutions happen.

If I’m a state, local or tribal leader, I could use the tool to better understand how temperature, precipitation, and flooding conditions are projected to change locally and generate straightforward hazard reports that can be incorporated into strategies for future projects, a climate action plan, or to support a data-driven proposal seeking funding. In addition to a wealth of climate data, the tool also shows areas designated as a disadvantaged community—based on an environmental justice score—making it eligible for prioritized funding. The aim is for equity to be top of mind when government leaders design and implement resilience measures. The White House’s Justice40 initiative ensures 40 percent of an eligible program’s federal funding goes to benefit disadvantaged communities that are “marginalized, underserved, and overburdened by pollution.”
If I’m a grant officer deciding who gets funding, I can use the tool to review proposed projects by their locations, ensuring that the funds go to projects that are the most needed now and that address a community’s resilience for future generations. I can also help ensure that funding awards are distributed equitably by quickly verifying priority eligibility funding through the Justice40 initiative.
If I’m a concerned and curious citizen, I can learn more about the climate-related hazards that may impact me and and my neighbors, browse maps in the assessment tool, and create a report to share with others to inspire action.
In addition to information about projected climate conditions in the future, the portal highlights links to federal funding resources, federal climate policies, and proven solutions from other communities. The linked US Climate Resilience Toolkit offers videos and stories about what others are doing. For instance, one case study shows how a tribe in northern Wisconsin are replanting their forests to adapt to future conditions, and another shows how cities in Minnesota have modified their transportation system and extended the hours that cooling centers are open to ensure that people who need relief from the heat can get it.
Technologies such as the CMRA Portal enable the dynamic collaboration we so greatly need—gathering information from across multiple agencies to enable better decisions, expose solutions that are working for others, and create a means for supporting evidence-based funding requests for all communities.
The CMRA Portal’s collection of relevant climate data, essential for decision-making, also includes open data that can be accessed from the portal and combined with your local GIS data, or incorporated into your own assessment tools. The curated content and open data services invite you to configure new tools and maps that address your local concerns.
As David J. Hayes, special assistant to President Biden for climate policy, said during the annual Esri User Conference in July, “There is no more important service that the federal government can provide to all Americans right now than completely up-to-date information on the climate impacts, on a geographic basis, that are hitting our communities, causing the loss of lives and loss of livelihoods.”
Today we have better data, better tools, and even more appetite for climate information than in years prior.
We all need to do our part—and this portal can engage everyone and get leaders started with data-informed decision-making, leading to impactful interventions.
Maps have sparked the imagination and offered a way of communicating and navigating for centuries. We’ve used maps to see beyond where we’re standing—answering what or who is on the other side of that mountain range, across that sea, or beyond that horizon.
Now we have high-tech maps that accurately illustrate the conditions we face now as well as those we’ll be confronting in the future. My hope is that this new online portal inspires us all to see what we face in our neighborhoods, our regions, and our nation and to take on the challenges collectively.
Seeing—on a dynamic, data-rich map—brings understanding.
Together, let’s use that understanding to map a better future.
Learn more about how GIS helps address climate change impacts.

May 17, 2022 |
March 22, 2022 |

November 12, 2020 |