displaying 2211 results

GIS is unifying not just data but colleagues and teams. As top companies show, businesses are making the most of those new connections.

Explore the top 10 GIS stories of 2025 and the trends reshaping how we solve global challenges with GIS, using the geographic approach.

Archaeologists develop a digital twin of Easter Island (Rapa Nui) to research its settlements and disprove ecological collapse.
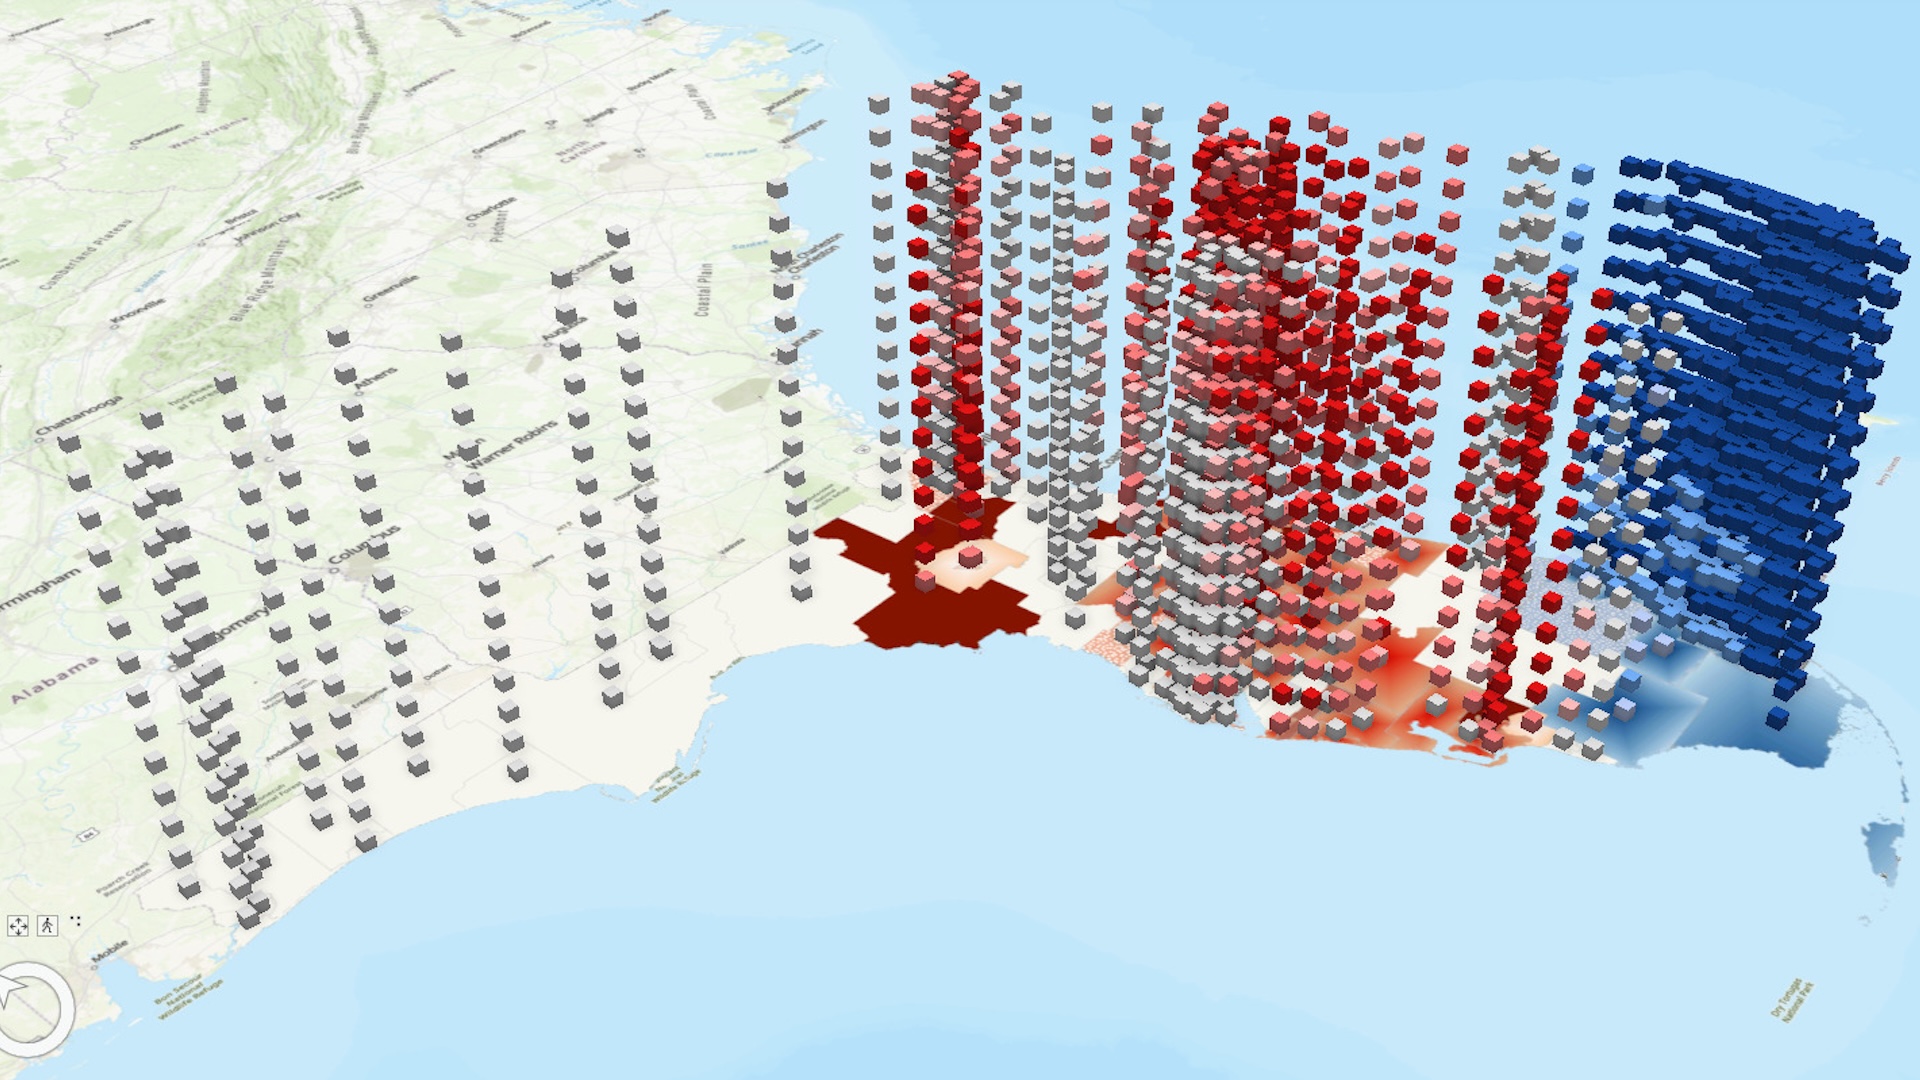
In this tutorial, learn how to analyze spatiotemporal data by visualizing changing homeownership rates over time throughout Florida.

When a park’s boundary is breached by unauthorized land use like illegal waste dumping, Summit Metro Parks tracks violation details online.

Discover the beauty of geography with this calendar featuring visually captivating maps created by Esri.

Taylor Guitars and the Congo Basin Institute use GIS and community partnerships to conserve ebony trees, mapping a critical link with elephants.

In more US cities, downtown revitalization arrives first on 2D and 3D digital maps and models that help communicate a vision of the future.
A hidden but powerful utility, geocoding enables businesses to track the locations of assets, customers, facilities, routes, and suppliers.

A new platform, built in partnership with Infosys Limited, enables staff to create apps designed to improve pipeline maintenance.
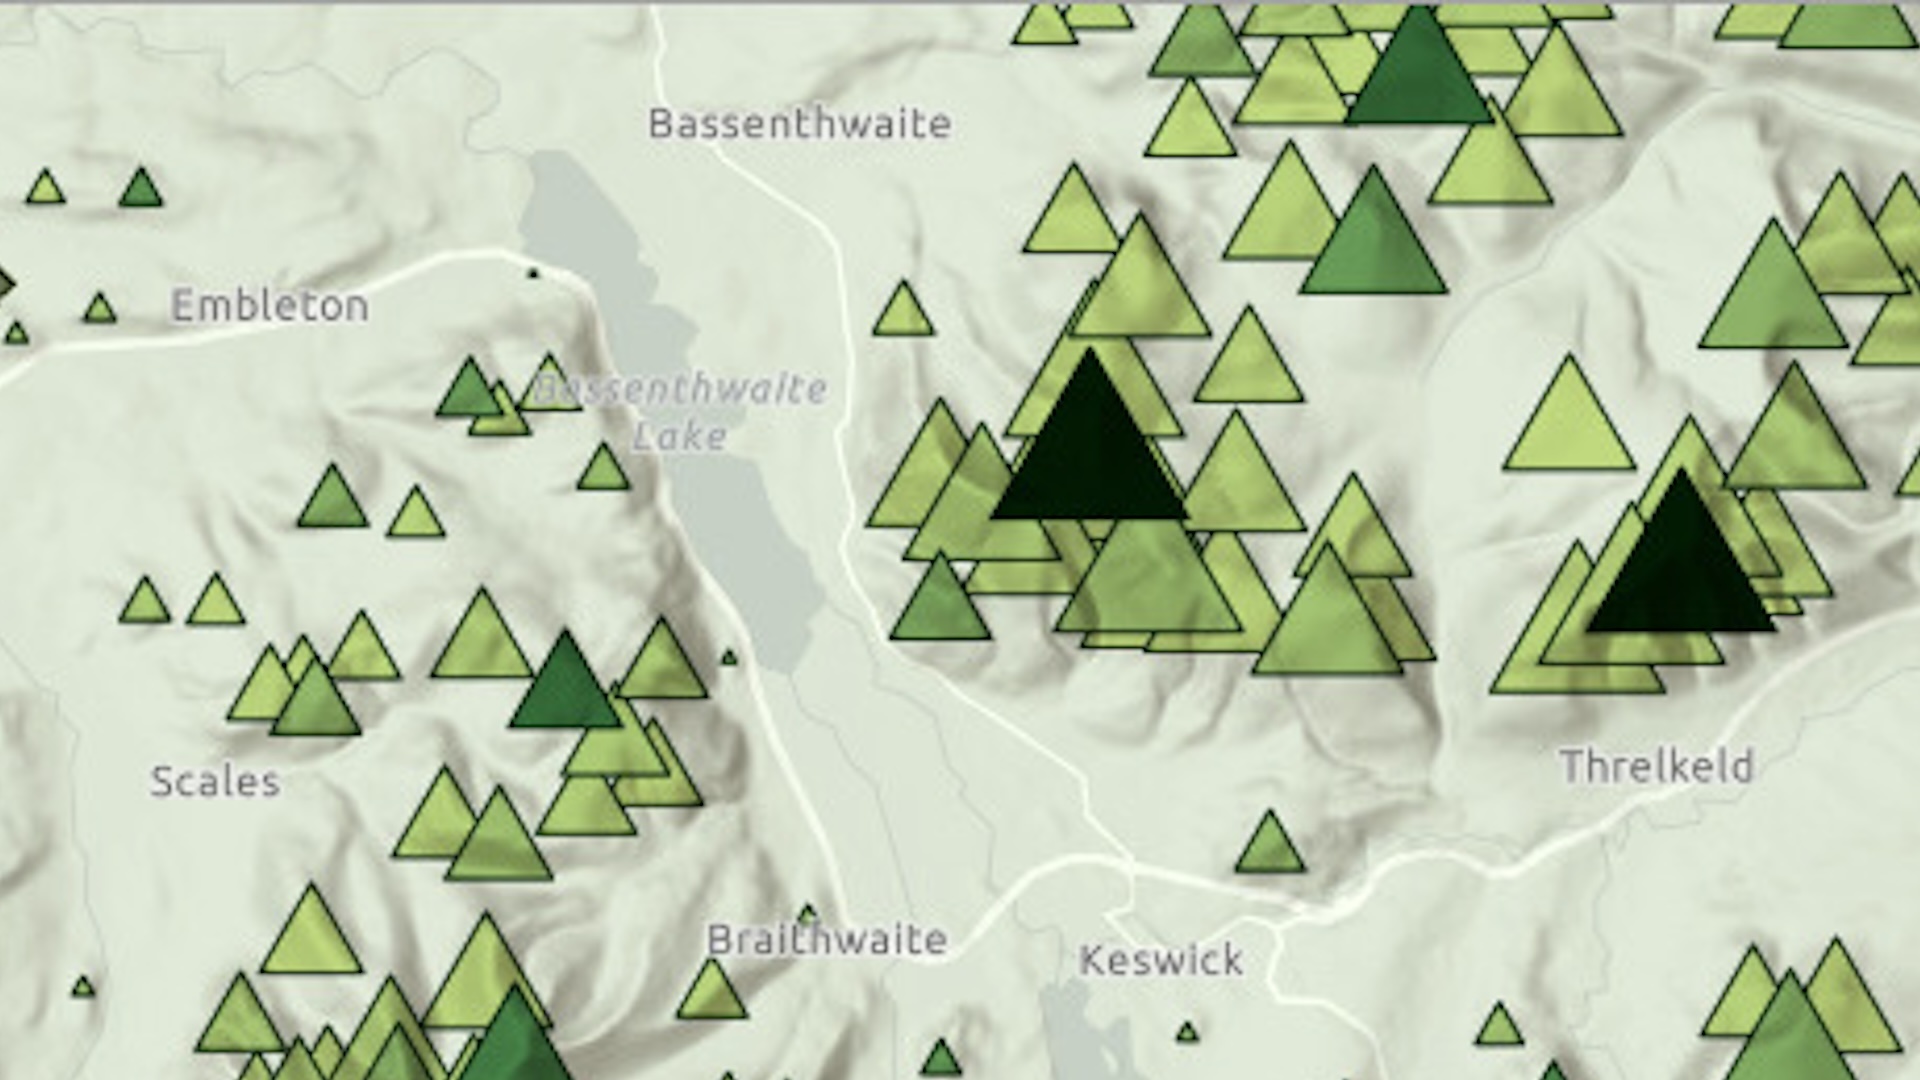
Show the mountains of England's Lake District National Park by modifying a basemap to reveal a shaded relief and display its topography.
