December 23, 2024 |
Matt Ball | Mapping
The most-read posts of 2025 share a common thread: geography and technology converging to solve humanity’s most pressing challenges. From rising seas to collapsing bridges, from housing affordability to regional revitalization, these ten stories show how geographic intelligence and GIS technology serve as the central nervous system of modern problem-solving.
Nottingham transformed urban planning by creating a virtual replica of its city center. Planners now test scenarios, visualize impacts, and engage citizens before breaking ground—turning what-ifs into concrete answers. The digital twin brought stakeholders into the same virtual room, where conflicts were resolved on screen rather than on site.

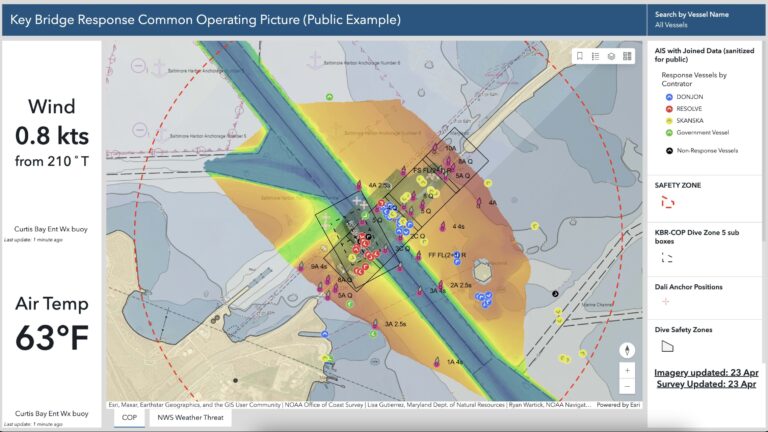
When Baltimore’s Francis Scott Key Bridge collapsed, killing six construction workers, dozens of agencies faced an urgent challenge: clearing a vital shipping channel while recovering the victims and investigating the cause. Coast Guard, Army Corps, state and local teams used shared mapping to coordinate search operations, debris removal, and port access. The common geographic framework helped responders work and coordinate simultaneously in a new pattern of cross-agency collaboration.
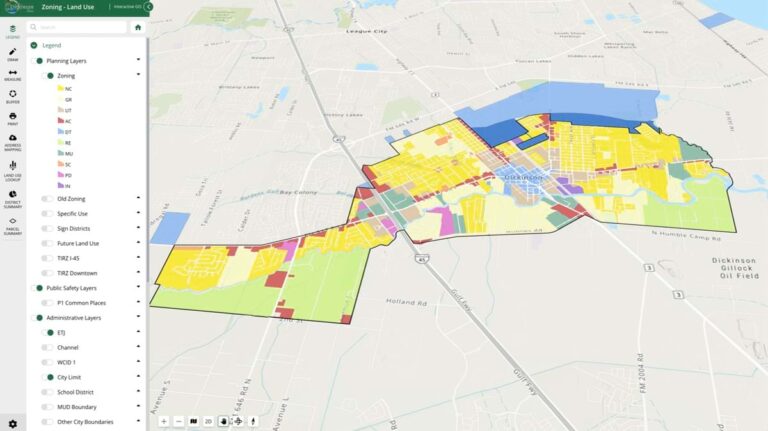
Dickinson, Texas looked at sprawl and said no. Instead, the city embraced vertical growth, using smart planning tools to visualize density done right. Small cities can think big, using location intelligence to reimagine Main Street.
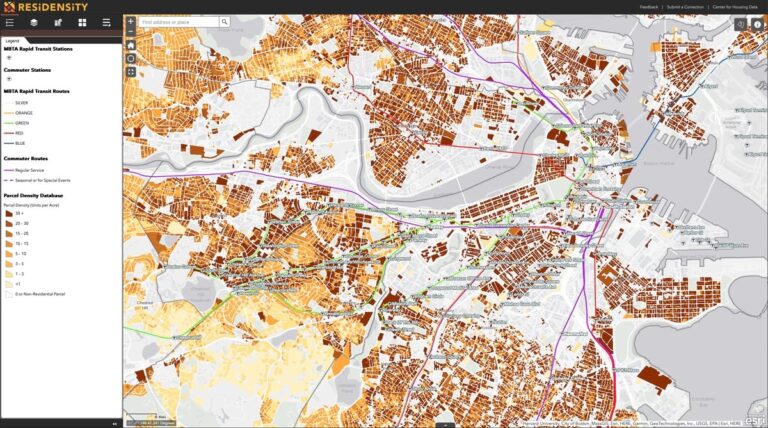
Numbers hide stories. Maps reveal them. Massachusetts confronted its housing crisis not with statistics, but with geographic analysis showing where affordability gaps hurt most. The maps didn’t document the problem—they pointed to solutions tailored to each community’s landscape.
For Tuvalu, a digital twin is more about preservation than resilience. As the Pacific nation faces the existential threat of rising seas, they’re creating a virtual homeland that will outlast the physical one. Geography as memory, technology as testament.

In one of the world’s busiest ports, Singapore created a digital mirror that tracks every vessel, every container, every square meter in real-time. The result? Operations teams who no longer wonder what’s happening—they see it, predict it, optimize it.

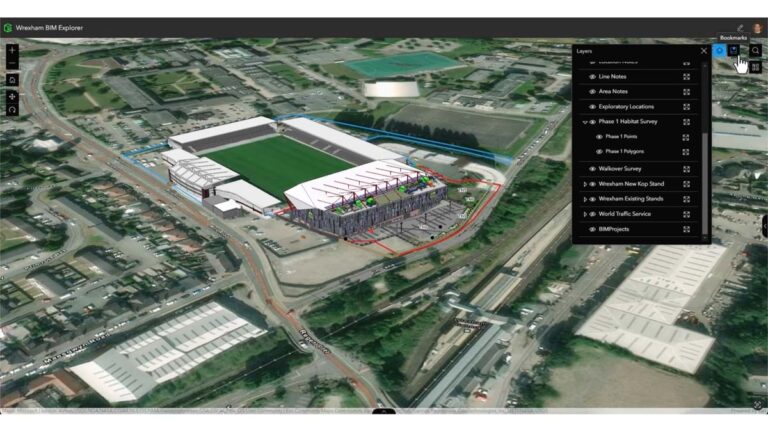
Wrexham AFC’s stadium renovation merged GIS with Building Information Modeling, proving that geographic intelligence extends from continents to construction sites. The marriage of scales created a facility that fits perfectly into its community.
Canada’s Department of Fisheries and Oceans confronted an Arctic challenge: how to count white whales against white ice in thousands of aerial images. The answer came through geospatial AI—a deep learning model that analyzes imagery with 88 percent accuracy, turning weeks of tedious work into hours of automated detection. The system saves time while strengthening conservation for species crucial to both Arctic ecosystems and Inuit communities.

Five years after the pandemic began, this retrospective showed how maps became humanity’s shared language for tracking, understanding, and responding to a global threat. From local case counts to vaccine distribution, geography organized our collective response.

A tragedy sparked transformation. After preventable deaths on the Potomac, firefighter Jeffrey Lenard partnered with Tim Hutchison, a GIS analyst with DC’s Office of the Chief Technology Officer (OCTO). Building on OCTO’s government-leading enterprise GIS capability, they created dashboards that turned coordination chaos into operational clarity—tracking everything from fireboat locations to blood supplies to firefighter welfare.

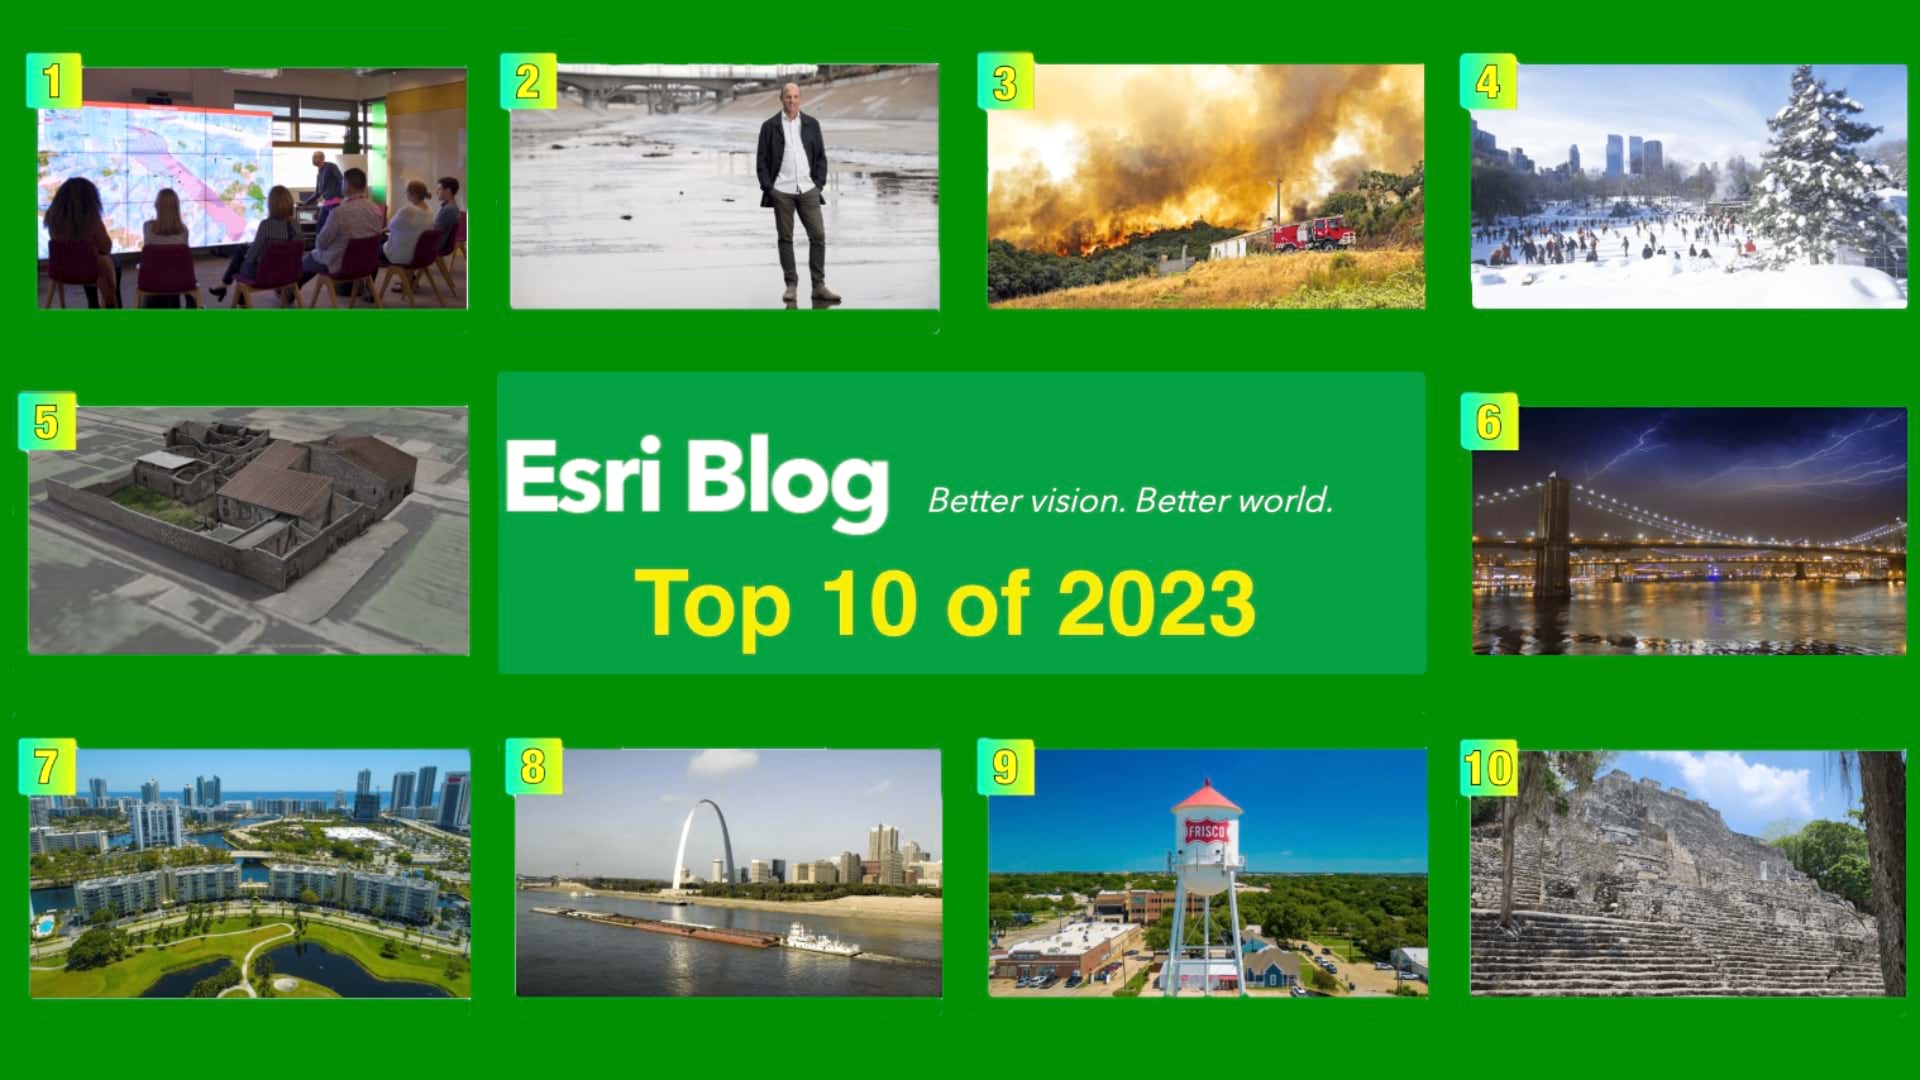
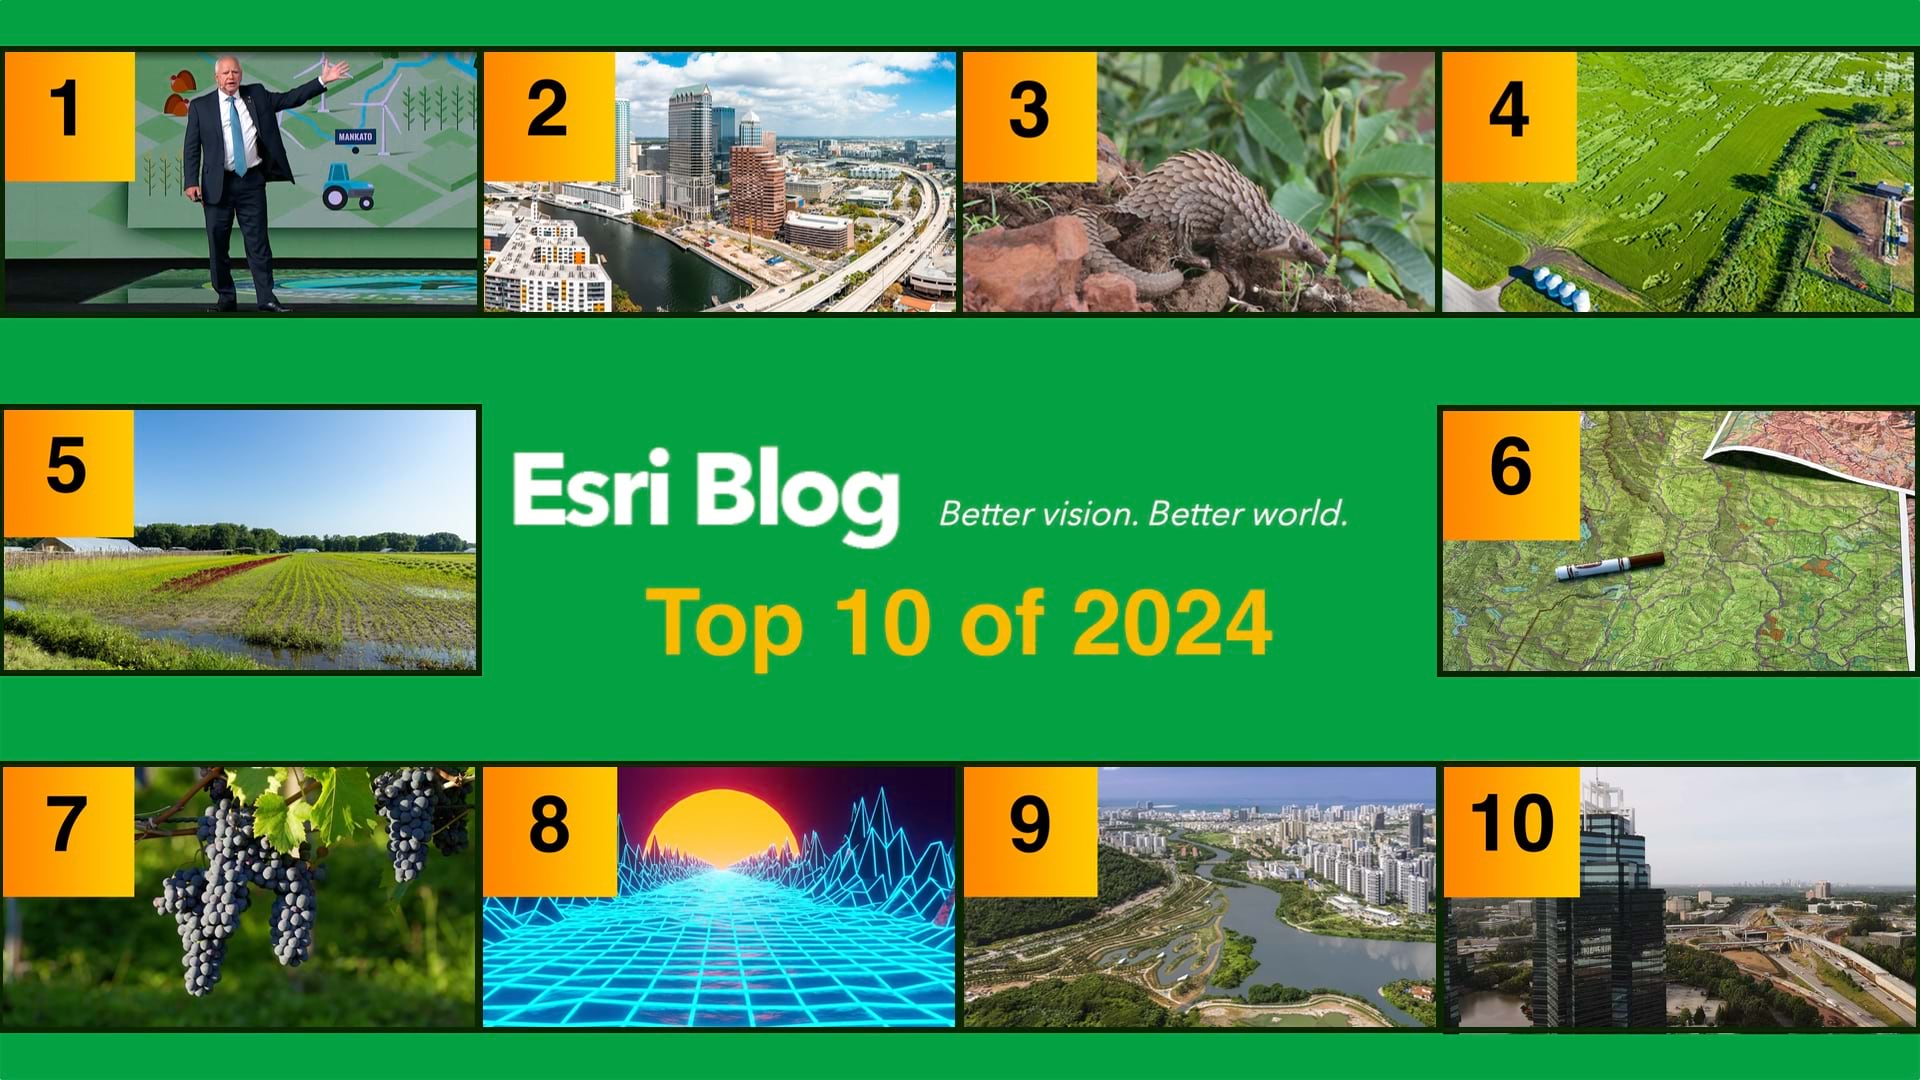
Looking back? Check out our Top 10 of 2024 and Top 10 of 2023.
Three years of reader choices reveal where the application of GIS is headed. Clear patterns emerge:
The Digital Twin Revolution
The most striking pattern of 2025? Digital twins dominated. Three of the top seven stories—Nottingham, Tuvalu, and Singapore—centered on virtual replicas of physical reality. Compare this to previous years: 2024 had no digital twin stories in the top 10, while 2023 featured three (Vodafone, Pompeii, Frisco).
What changed? Digital twins moved from concept to necessity. Organizations now see them as essential infrastructure for understanding complex systems. Whether modeling a city center, a sinking nation, or a bustling port, the pattern is clear: when complexity overwhelms, we build digital twins.
Intelligence at Scale: Geospatial AI
The beluga whale story (#8) signals a shift: AI is enhancing geospatial workflows. When Canadian scientists faced thousands of Arctic images requiring weeks of manual analysis, geospatial AI compressed that timeline to hours with 88 percent accuracy. AI amplifies human expertise and takes away the drudgery. Scientists can now focus on conservation decisions rather than image inspection.
This automation trend appears throughout the top 10: Singapore’s digital twin predicting port congestion before it happens, Massachusetts’s algorithms revealing housing patterns invisible to manual analysis. The pattern? Organizations are moving beyond visualization to automated insight.
Crisis as Catalyst: From Reactive to Proactive
The housing crisis (#4), the Key Bridge collapse (#2), Tuvalu’s existential threat (#6)—crisis forces innovation. Unlike past years, these stories show a shift from responding to disasters toward anticipating them. Massachusetts didn’t wait for housing to become unaffordable; they mapped it becoming that way. Singapore didn’t wait for port congestion; they built systems to see it forming.
This represents a maturation of geographic thinking: from “what happened?” to “what’s about to happen?” The technology has become faster and more predictive.
The Collaboration Imperative
If 2024 was about individual organizations using GIS (Minnesota’s governor, Tampa’s Vision Zero), 2025 emphasized coordination across boundaries. The Key Bridge story (#2) exemplifies this: when crisis struck, shared maps dissolved organizational silos. Coast Guard, Army Corps, state and local teams worked from the same geographic picture, coordinating their response while advancing each other’s critical work.
This continues a pattern from 2023: those stories often featured single organizations (Vodafone, Frisco), but recent years show geographic platforms becoming the connective tissue between agencies, departments, and disciplines.
Enterprise Infrastructure as Foundation
The DC responsiveness story (#10) reveals something often invisible: the infrastructure that makes innovation possible. When firefighter Jeffrey Lenard partnered with GIS analyst Tim Hutchison, their solutions didn’t emerge from scratch. They built on OCTO’s government-leading enterprise GIS capability—an existing foundation that could support rapid innovation. This pattern appears elsewhere: Singapore’s port operations, Nottingham’s city planning, Massachusetts’s housing analysis all rest on mature geographic platforms.
The lesson? Breakthrough applications require invisible infrastructure first. DC’s dashboards tracking firefighter welfare and blood supplies work because someone built the enterprise GIS years earlier. Innovation looks dramatic; the foundation enabling it does not.
Looking across 2023-2025, a meta-trend emerges: GIS has become infrastructure. It’s the operating system for:
Geographic technology has become the substrate on which modern organizations build their capacity to understand, anticipate, and act.
The Human Thread
Finally, notice what these technical stories contain: scientists, city planners, small town leaders, Indigenous communities. The most-read stories center on people using GIS to solve problems that matter. The beluga whale story (#8) captures this perfectly: the story relates the use of AI for detecting whales—but it’s more about protecting Arctic ecosystems and supporting the Inuit communities who depend on them.
That’s the through-line across all ten stories, all three years: GIS gets its power from serving human purpose.