Why every ArcGIS administrator needs a 360° strategy, and actionable guidance for how to create one
(10-minute read)
Managing an enterprise GIS without an observability strategy means reacting to system issues that are sometimes unpredictable and can be difficult to find. With the right observability strategy, you are better equipped to understand your enterprise GIS and proactively find and resolve potential issues. Enterprise systems like ArcGIS are complex and multi-functional; to run at a high level of availability and service, they must be well understood and transparently observable for the engineering and IT staff who support them.
This blog post explains what enterprise GIS observability is and shows you how to use elements from across ArcGIS to build a 360 degree observability strategy that meets your organization’s specific needs. It is designed to complement the Observability pillar of the ArcGIS Architecture Center, which provides foundational definitions, best practices, and architectural guidance for observability across enterprise systems.
This blog post is for you if:
- You manage an ArcGIS Enterprise deployment on Windows or Linux, or hybrid environments that include ArcGIS Online
- You manage a SaaS-only GIS with ArcGIS Online and want observability into content usage or user activity
- You’re a GIS administrator who needs to more deeply understand IT concepts, or an IT professional who needs to more deeply understand ArcGIS
- You’d like to avoid unexpected system downtime, and would like to build a proactive monitoring practice for your GIS
- You’re evaluating ArcGIS Monitor or other GIS observability tools
What is observability?
Observability provides ready access to consistent, detailed information about system operations, so that system changes or issues can be rapidly identified, assessed, and acted upon.
Think of observability as a “car dashboard” for your IT and GIS enterprise systems. Like any vehicle, while it’s technically possible to operate it without the dashboard (the engine will still run and the steering wheel will still steer), it’s not efficient. How can you know when you will run out of gas, how fast you’re traveling, or if your engine is overheating, without detailed information about what’s happening under the hood?
And like any driver, with metrics on how your car is running, you can make better decisions. You can predict when you’ll need to stop for gas, or if your car does break down, you may be able to figure out why it happened and respond accordingly.
To effectively manage and operate any enterprise system, IT or GIS, you must have access to information about the operational status of the system, applications, and supporting services.
On top of that, when it comes to enterprise GIS environments, the expectations for and types of work supported continue to grow. With SaaS, self-hosted, and hybrid environments, growing user bases, and tighter service level agreements (SLAs), the impact of an outage is higher than ever as GIS transitions from essential to mission critical. Every GIS administrator and IT manager working with an enterprise GIS, regardless of its size, should have a plan for understanding this complexity. Thankfully, ArcGIS offers a variety of observability capabilities that can be accessed in different ways to ensure your system is running smoothly.
Note: The approaches described here are based on ArcGIS Enterprise deployed on Windows and Linux. If you are using ArcGIS Enterprise on Kubernetes, the recommendations in this blog post will not apply to you. Kubernetes-based observability introduces additional layers (e.g., container orchestration, ephemeral workloads) that often require specialized tooling and practices.
What is a GIS observability strategy?
A GIS observability strategy is a structured approach to understanding information about your enterprise system’s behavior and health. It includes telemetry, visualizations, reporting, engagement, and notifications to enable administrators to respond to problematic events.
GIS observability strategies are made up of some combinations of these (and other) key system indicators, such as:
- Engagement: content usage and user activity
- Utilization (used vs available): system capacity usage, overall and by process
- Infrastructure Saturation (near capacity limits): percent of resources consumed (physical or virtual). Consider disk utilization, storage capacity, and disk activity (non‑SaaS). Also consider network usage (both bandwidth and transfer) and network consumption and throughput (non‑SaaS).
- Insights: dashboards, reporting, alerts, and notifications
These metrics establish a baseline for system performance, enable detection of deviations, and support correlation of system issues or outages with changes in hardware utilization. Before building an observability strategy for an enterprise GIS designed and built with ArcGIS, it’s helpful to look at all the methods that are available across ArcGIS (and third-party providers you may already be using). Elements from all these areas will contribute to your overall strategy.
Methods for observability within ArcGIS
Many modern GIS deployments follow a hybrid pattern, meaning that they include both ArcGIS Enterprise (self-hosted) and ArcGIS Online (SaaS). In this case, users will see a variety of metrics from both sources, including logs, utilization reports, user reports, and visualizations.
For systems with a public-facing GIS, administrators should pay close attention to how end users outside your organization will access and utilize your data. High usage from the public can influence performance on ArcGIS Enterprise systems, and so potentially viral workloads should be routed through ArcGIS Online.
ArcGIS Online and ArcGIS Enterprise
Because ArcGIS Online is delivered as a SaaS offering, Esri manages the underlying infrastructure and much of the platform’s operational performance. However, organizations still need visibility into how the system is being used.
Built-in telemetry provides this insight by capturing information about user activity, content usage, and access patterns. As a foundational component of observability, telemetry helps support governance efforts, helps identify unusual activity, and helps reduce the risk of improper access or data loss.
Elements of an observability strategy in ArcGIS Online include:
- Regularly reporting user log in activity and auditing built-in accounts, which are accounts added to ArcGIS Online directly and not connected to SAML (Security Assertion Markup Language, an open standard that lets secure web apps pass user identity to a centralized identity provider) or Active Directory. These should be reviewed at regular intervals to confirm that users still require access.
- Auditing public-facing datasets to ensure that they are protected, not being edited by unauthorized users, and are timely and accurate.
- Ensuring that content duplication is kept to a minimum.
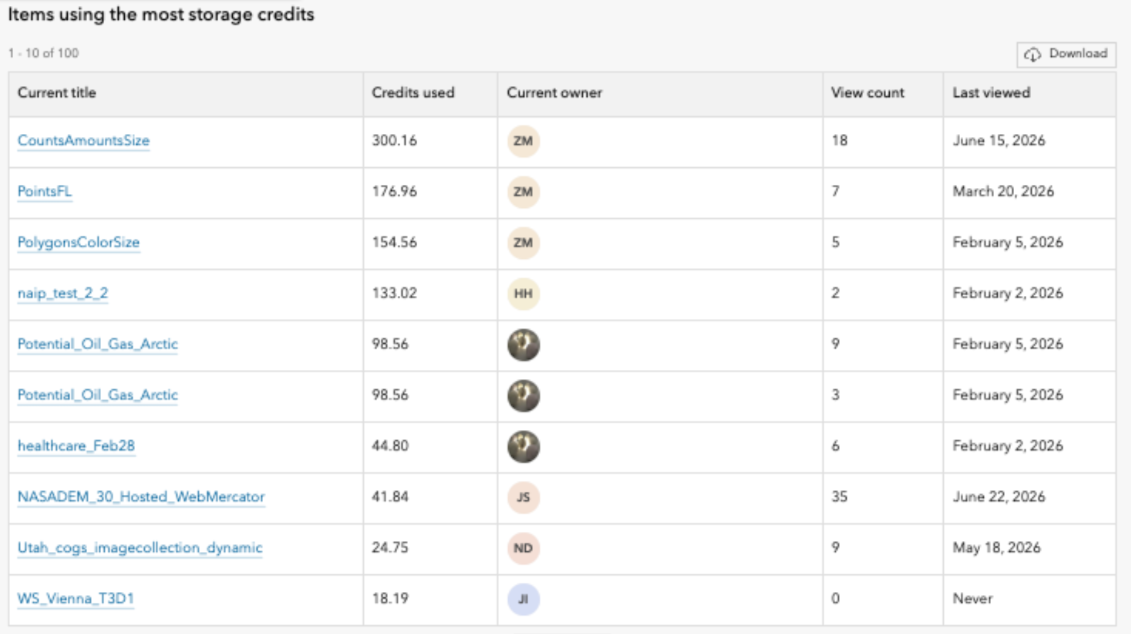
- Identifying which content, members, and workflows are driving resource consumption, to make informed decisions about governance and resource management. (For example, the Organization Status Dashboard now provides administrators with a centralized experience for monitoring organizational activity, credit consumption, and content usage.)
ArcGIS Enterprise observability tools go beyond user and content reporting by adding hardware and resource monitoring. Because ArcGIS Enterprise is deployed on self-hosted infrastructure, either on-premises or in the cloud, GIS administrators and IT managers have greater control over resource allocation, along with responsibility for monitoring system resources, network latency, and overall load.
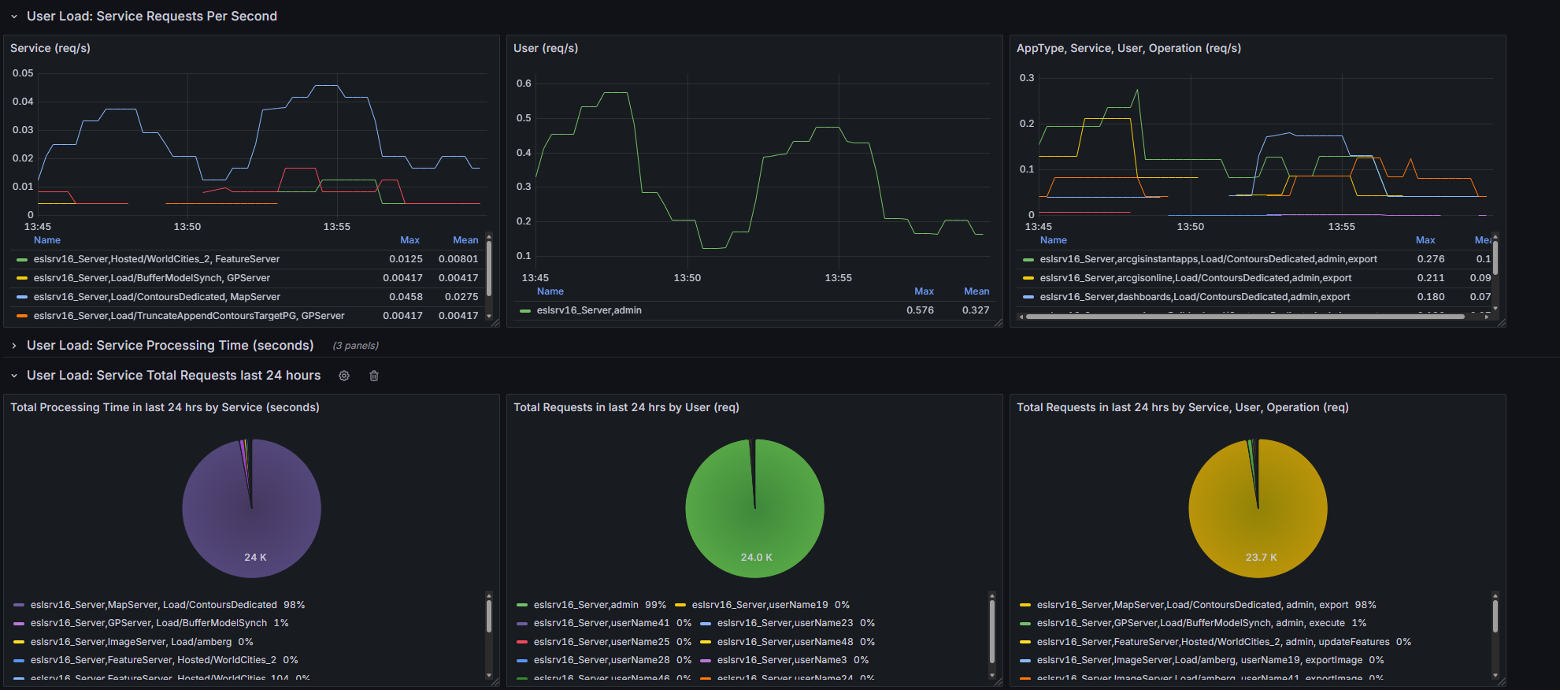
ArcGIS Enterprise provides observability into a single deployment, including the base software and any federated servers. The ArcGIS Enterprise metrics API, released in ArcGIS Enterprise 12.1 on Windows and Linux, provides enhanced observability by capturing information about your system and the machines on which your ArcGIS Enterprise components are running. The metrics API allows administrators to identify usage and activity patterns, detect and resolve system problems, and tune your deployment based on usage to right-size infrastructure resources. Grafana templates are available to visualize system health, service usage, and user engagement across the ArcGIS Enterprise portal, ArcGIS Server, and web services.
ArcGIS Monitor and holistic enterprise GIS observability
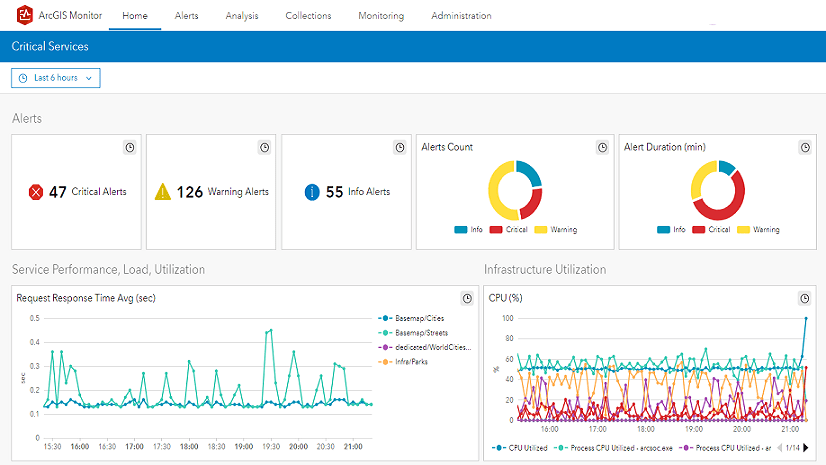
ArcGIS Monitor augments the methods that are available in ArcGIS Online and ArcGIS Enterprise, and provides another layer of comprehensive observability by collecting metrics on the health, performance, and usage of the entire enterprise GIS. For organizations that have multiple ArcGIS Enterprise deployments such as development, staging, and production environments, or are running multiple release versions of ArcGIS Enterprise, ArcGIS Monitor provides a single console where you can view key performance indicators (KPIs) across deployments. This holistic view helps you manage and optimize the entire ArcGIS platform and its underlying infrastructure.
ArcGIS Monitor provides visibility into:
- All ArcGIS Enterprise components (including ArcGIS Data Store relational data store)
- Web services
- Databases, geodatabases, and host machines
- Other GIS resources such as ArcGIS Online services, and third-party systems like FME Flow and Trimble Unity Maintain
In addition to visibility into system components, ArcGIS Monitor offers the ability to set alerts and generate email notifications, so that you are contacted directly if and when a service or server goes down. You can locate it immediately and assign more resources accordingly (or notify other stakeholders). Going back to our car analogy, this enables not just the ability to pop the hood and look inside, but provides a warning light to communicate a mechanical failure. In other words, you are able to proactively manage the system.
ArcGIS Monitor can bring related metrics together into a single view, even when they don’t natively exist side by side. For example, you can display CPU and memory metrics alongside utilization and performance metrics (such as request response times and ArcSOC saturation). Because it provides a holistic view of the system, GIS observability with ArcGIS Monitor helps reduce and prevent system downtime, cut down on operational costs, and improve end-user experiences.

Another important point in understanding ArcGIS Monitor is that it’s designed to scale with your enterprise GIS implementation and can accommodate a range of situations, from a few machines in a single network environment to multiple globally distributed data centers and cloud providers.
ArcGIS Monitor component relationship graphing also allows GIS administrators to visualize how hardware and software components in a GIS deployment are related. This provides greater insight into how degraded performance and offline systems affect other parts of the GIS deployment and helps administrators plan system maintenance windows and perform trace and root cause analysis.

Observability from third-party tools
For administrators using a mix of on-premises and cloud services, there are additional products and tools that can help you manage and monitor your operations. For example, observability tools are available within Azure, AWS, or Google Cloud Platform (GCP) to help understand and maintain your GIS.
Azure Monitor. Microsoft Azure offers Azure Monitor to collect and analyze performance data from various Azure resources, including virtual machines, databases, and Azure Kubernetes Service (AKS) clusters if used in your ArcGIS Enterprise deployment. You can also integrate third-party monitoring solutions like Dynatrace or SolarWinds for enhanced infrastructure monitoring.
Amazon CloudWatch. Administrators deploying their GIS in AWS can make use of Amazon-specific monitoring tools, such as Amazon CloudWatch, to monitor the performance of EC2 instances, RDS databases, and other AWS resources that are part of your ArcGIS Enterprise deployment. You can also integrate third-party monitoring solutions like New Relic, Datadog, or AppDynamics to gain comprehensive performance or infrastructure insights.
Cloud Monitoring. GCP provides Cloud Monitoring (formerly Stackdriver) to monitor virtual machines, databases, and other components used in your ArcGIS Enterprise deployment on GCP. GCP also allows integration with third-party monitoring tools like Prometheus and Grafana.
Additionally, Oracle Enterprise Manager or Microsoft SQL Server Management Studio can monitor and optimize database performance. These tools are applicable when managing enterprise geodatabases.
As you can see, there are several tools at your disposal to create an enterprise GIS observability strategy that is unique to your needs. You can build on your existing investment in these offerings by engaging with your IT staff or DevOps teams who may be using these tools already, rather than starting over completely.
Three steps for making your strategy actionable
Step 1: Define the scope of your enterprise GIS observability strategy
Building an ArcGIS observability strategy starts with understanding your environment. The tiers of all enterprise systems are infrastructure, data, services, apps & APIs and workflows. Here’s what to consider for each of them.

In this example, we are using a hybrid environment with ArcGIS Enterprise deployed on AWS, and ArcGIS Online.
Apps and services. At this level, users will expect performant, reliable and stable services. Depending on the system supporting these services, we will make different choices. If most of your apps and services are in ArcGIS Enterprise, you will need to understand the underlying resource availability and service settings. ArcGIS Monitor can show you these settings and allow you to make changes. ArcGIS Monitor also tracks how those changes improve performance over time.
Infrastructure. Here, the focus shifts to how hardware and software resources work together. At this tier, we are using principles of IT to support complex digital systems. Best practices in this space include using ArcGIS Monitor to track memory, disk, and CPU resources, and Amazon CloudWatch to optimize resources if a problem arises (since in this example, ArcGIS Enterprise is deployed on AWS).
Your strategy might include ArcGIS Monitor for infrastructure management and data-level awareness, ArcGIS Online metrics dashboards for public-facing services and apps, and AWS route monitoring to ensure that traffic to your cloud-based system is healthy and understood. Adding regular reviews of ArcGIS logs and audits of accounts and content helps complete your observability strategy.
To develop the first part of your strategy, ask yourself these questions:
- How are internal staff and end users accessing the GIS apps and data in our system? Are we creating public or private apps? Are we using a hybrid environment?
- Where are my failure risks? Consider infrastructure (CPU, memory, and disk), services (latency, errors), and content (sharing, duplication).
- What do my users expect? Consider SLAs and performance thresholds.
Step 2: Establish a monitoring cadence for your ArcGIS environment
Consistency is the foundation of proactive monitoring. Without a defined cadence for reviews, issues can accumulate and cause performance problems or outages.
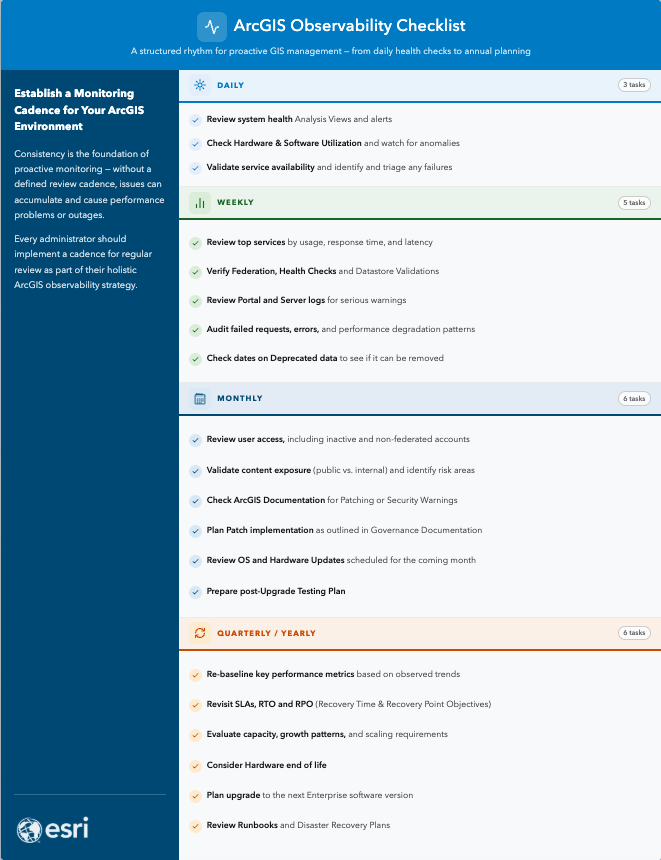
As a best practice, Esri recommends that every administrator implement a cadence for regular review of their enterprise GIS that makes sense for their organization. It should include daily, weekly, monthly and yearly tasks, such as:
Daily:
- Review system health analysis views and alerts to ensure there are no errors with the system. (One way to do this is by using ArcGIS Monitor – check out this Getting Started with ArcGIS Monitor blog post to see how it works.)
- Check hardware and software utilization and watch for anomalies. (You can learn more about this in documentation here).
- Validate service availability from ArcGIS Enterprise (You can do this by using the Check-Service Observer in ArcGIS Monitor.) Identify and triage any failures.
Weekly:
- Review top services by usage, response time, and latency to ensure expected performance.
- Verify federation, health checks, and datastore validations to ensure that software components are functioning as expected. (This can be done with ArcGIS Monitor through component status and alerts, as it provides comprehensive status information for all registered assets in the enterprise GIS.)
- Review ArcGIS Enterprise portal and server logs for serious warnings. ( Logs can be reviewed in ArcGIS Enterprise, or you can troubleshoot with the help of ArcGIS Monitor.)
- Audit failed requests, errors, and performance degradation patterns to head off larger issues.
- Check the dates on deprecated data to see if it can be removed.
Monthly:
- Review user access, including inactive and non-federated (built-in) accounts to understand user engagement and remove users who no longer need access.
- Validate content exposure (public vs. internal) and identify potential risk areas.
- Check ArcGIS documentation for patching or security warnings.
- Plan implementation of patches as outlined in governance documentation.
- Review OS and hardware updates scheduled for the coming month.
- Prepare your post upgrade testing plan.
Quarterly (or longer):
- Re-baseline key performance metrics based on observed trends and make hardware and software adjustments.
- Revisit SLAs, RTO and RPO (Recovery Time Objective/Recovery Point Objective).
- Evaluate capacity, growth patterns, and scaling requirements.
- Consider hardware end of life.
- Plan for upgrading to the next version of ArcGIS Enterprise software. Refer to the product lifecycle to ensure your plans account for consistently staying on a supported version.
- Review runbooks and disaster recovery plans.
This operational cadence ensures that observability is not reactive or event-driven, but instead becomes a structured and proactive part of system management. Over time, you can move beyond troubleshooting individual issues and toward understanding system behavior, identifying trends, and improving overall system reliability.
Step 3: Create a culture of GIS observability
- Document your strategy. Your ArcGIS observability strategy should be documented and available for review by stakeholders. Administrators should identify the tactics that they use to maintain their system, identify accountability for these, and meet regularly to assess. This ensures that institutional knowledge is formalized and consistently applied.
- Design around user workflows. Observability strategies rely on understanding user workflows. By defining user needs and building systems around them, organizations can create more effective and resilient solutions. Applying principles of least privilege further enables users while maintaining clear and controlled access.
- Leverage tools that your organization has already invested in. Observability does not need to be an expensive endeavor. Several of the products listed in this blog post include complimentary tools for understanding users, content, and load. Administrators with budget concerns should start with no-cost approaches like log reviewers, ArcGIS Enterprise and ArcGIS Online reporting outputs, and hardware management tools which might be available through their IT departments. As systems become more mission critical, however, you may need to advocate for comprehensive monitoring and holistic system reporting and notifications.
- Everyone plays a role. Make your strategy sustainable over the long haul by defining response protocols, assigning accountability clearly, and revisiting annually. A strong observability strategy is an operational model built on repeatable, actionable, clearly defined activities. Ensure your team has a clear understanding of how to respond when metrics deviate from expected baselines. When observability is actionable, responders can interpret alerts and notifications and take action to repair or investigate the system. In addition to GIS administrators and IT managers, data stewards and GIS power users each have a role to play. These roles should be aligned to specific responsibilities, with a defined cadence for reviewing system health, usage, and risk.
An observability strategy is only as strong as your commitment to acting on what it tells you. Start with the steps discussed in this blog post, build your cadence and response plan to create a GIS environment your users can rely on, and a team that gets ahead of problems before they become outages.
For the architectural principles and best practices that underpin everything covered in this blog, including how telemetry, monitoring, and observability relate to one another and how to apply them across ArcGIS software, visit the Observability pillar on the ArcGIS Architecture Center.
Downloadable checklist and additional resources
- We’ve created a downloadable, printable checklist to help you keep your GIS observability strategy actionable.
- For tailored guidance on observability tools for your environment, Esri Professional Services offers system health checks. Visit the Esri Professional Services page to learn more.
- For Esri’s library of resources on GIS observability, ArcGIS infrastructure, and other IT concepts, visit the ArcGIS Architecture Center. For foundational concepts, best practices, and architectural guidance specific to observability, explore the Observability pillar.
- For more KPIs, tips, and tricks from Esri Professional Services Technical Consultants, check out this webinar recording: ArcGIS Monitor User Group Meeting #5: Key Performance Indicators for an Enterprise GIS or our library of recorded user group meetings, now available in Esri Community.



Article Discussion: