How it works
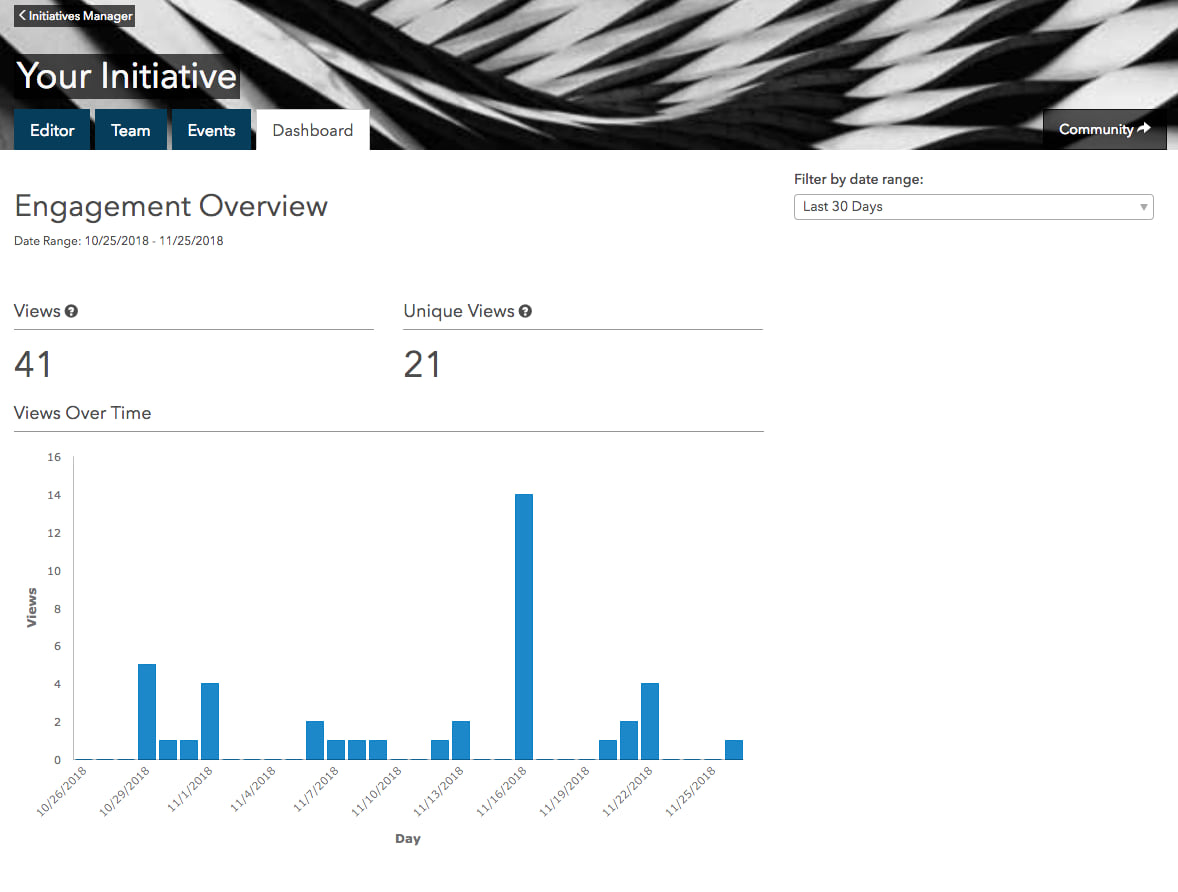
The dashboard uses telemetry to show you your site’s number of views and unique views as well as a bar graph of those views over time. All you have to do is pick the time. Filter views as recently as today to as far back as last year.

No need to worry about skewed counts. Even if someone viewed your site multiple times within the last week (or whatever date range you’ve selected), they are only counted once in unique views.
Monitor engagement
Get started
Ready to check out your site’s new dashboard? Follow these steps:
- Access the Hub app (either by signing in at hub.arcgis.com or by
clicking on the app within your ArcGIS online organization). - Click the Sites tab.
- Find your site, then click Capabilities.
- Click the Dashboard tab.
- Click the Filter by date range drop-down menu to choose a time frame.
If you’ve licensed the premium features of ArcGIS Hub, and have created one or more initiative sites, you can access individual engagement dashboards for each of these sites from within the initiative. Find your initiative under the Initiatives tab, click its title, then choose the Dashboard tab to view metrics for that site.
If you’re new to ArcGIS Hub sites, you can get started by enabling open data, a capability you already have if you’ve got a subscription to ArcGIS Online. Or take the Hub readiness assessment to learn more about what ArcGIS Hub can do for your community.
Don’t forget to stay connected with us on GeoNet, and check out our change log and follow us on Twitter for more updates.


Commenting is not enabled for this article.