ArcGIS Living Atlas of the World is the foremost collection of geographic information from around the globe. It includes curated maps, apps, and data layers from Esri and the global GIS user community that support your work. Living Atlas also includes analysis-ready layers and tools that work across the ArcGIS System. Visit the ArcGIS Living Atlas of the World website where you can browse content, view the blog, and learn how you can contribute.
Here’s what’s new since the last ArcGIS Living Atlas News (February 2021).
Quick links
Use the links below to jump to sections of interest. Use your browser back arrow to return.
- Living Atlas apps
- Basemaps
- World elevation
- Imagery
- Environment
- Policy Maps
- Analysis tools
- Community Maps
- More information
Living Atlas Apps
Content from ArcGIS Living Atlas of the World is used to make valuable apps for visualization and analysis. These apps can be found under the apps tab at the Living Atlas website or via search at the browse tab.
U.S. High Tide Flooding
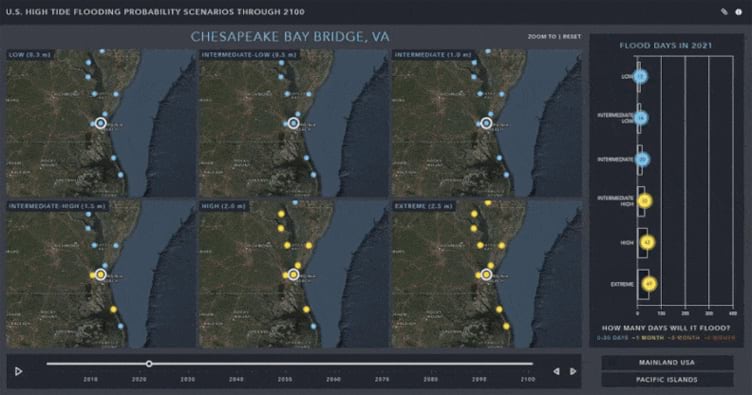
The High Tide Flooding App allows quick visualization and understanding of U.S. high tide flooding probability scenarios through 2100.
Users can quickly assess how many flooding days are expected to occur within coastal communities each year for the different flooding scenarios ranging from low to extreme. The application also allows sharing of a location and impact year so you can share links with colleagues or quickly compare outlooks.

Top 50 Counties Receiving Agriculture Federal Payments
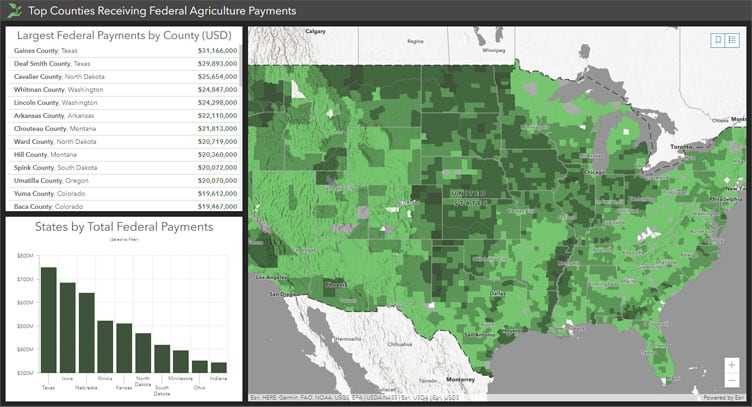
This dashboard shows the top counties receiving payments made to producers by the Federal government from the 2017 Census of Agriculture. The census is conducted every five years, most recently in 2017, and provides a in-depth look at the agricultural industry.
To learn how to build build this dashboard, see How to make that app: Census Agriculture Dashboard.

A look at Housing Stock in the US
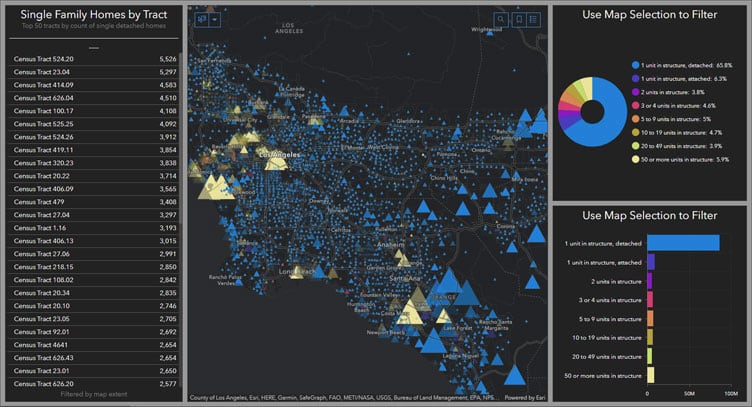
This dashboard displays a map of predominant housing stock (the number of units within a housing structure) and uses widgets for statistics by category. The source data is from the U.S. Census Bureau’s American Community Survey (ACS).

No Terrestrial Broadband of 25/3 Mbps
This dashboard examines the lack of broadband internet at speeds of 25 Mbps download and 3 Mbps upload (25/3), the minimum standard as defined by the Federal Communication Commission (FCC).

Basemaps
Esri basemaps are updated regularly with data from commercial, open, and community sources. All vector basemaps have been updated using data from Here, SafeGraph Places, and content contributed to the Community Maps Program. In addition to content updates, basemaps supporting six additional languages have been released. For more information on recent updates, see What’s new in Esri vector basemaps (March 2021). View all vector basemaps by browsing Living Atlas.
Some hosted raster basemaps have entered mature support, with others scheduled to move to mature support later this year. For more information, see Esri’s hosted raster basemap services moving to Mature Support.
Texture layers
New paper texture vector tile layers have been published, letting you add a creative touch and tactile quality to your basemaps. Available textures are crinkled paper, watercolor paper, poster paper, folded paper, and parchment.

The effect can be used without a blend mode, but to retain the vibrancy of the map’s color use the luminosity blend mode in Map Viewer or ArcGIS Pro. For more information see Texture tiles and Use blend modes to make web apps stand out.
Watermark layers
Use new Living Atlas watermark layers to mark your maps for special purposes, such as draft, prototype, preview, or internal.

These vector tile layers can be added to any ArcGIS Online web map or app, or any ArcGIS Pro map (in any projection), and appears at all scales. For more information, see When your map isn’t ready for primetime.
World Elevation
Living Atlas provides foundation elevation layers and tools to support analysis and visualization across the ArcGIS platform. These layers are updated quarterly with high-resolution elevation data from various sources and the Community Maps Program.

Recent updates to Terrain and TopoBathy have added high-resolution elevation data sets for Latvia, Lithuania, Slovakia and Salzburg (Austria), supporting visualization and analysis. In this release, elevation analysis tools (Profile, Viewshed, and Summarize Elevation) are also updated with 10 meter resolution data for Latvia, Lithuania, and Slovakia.
For more information, see High resolution data updates to world elevation layers (March 2021) and the Elevation Coverage map.
Imagery
Landsat
Important changes are underway, representing a period of transition for Landsat content. In December 2020, the USGS released Landsat Collection 2, marking the second major reprocessing campaign on the Landsat archive. Collection 2 processing delivers several data product improvements that harness recent advancements in data processing, algorithm development, and data access and distribution capabilities.

Over time, through June 2021, these new Landsat image services will be introduced in Living Atlas and existing services will be retired. For more information, see Introducing Landsat Collection 2.
Environment
U.S. High Tide Flooding Projection Scenarios
High tide flooding today mostly effects low-lying and exposed assets or infrastructure, such as roads, harbors, beaches, and public storm, waste and fresh-water systems, as well as private and commercial properties. Due to rising relative sea level (RSL), more and more cities are becoming increasingly exposed and more vulnerable to high tide flooding, which is rapidly increasing in frequency, depth and extent along many U.S. coastlines.
This new feature layer shows the number of days flooded per year from 2000 to 2100 for low, intermediate-low, intermediate, intermediate-high, high, and extreme scenarios.

The source data is from NOAA Technical Report NOS CO-OPS 086: Patterns and Projections of High Tide Flooding Along the U.S. Coastline Using a Common Impact Threshold.
Protected areas updates
PAD-US is America’s official national inventory of U.S. terrestrial and marine protected areas intended for the preservation of biological diversity and to other natural, recreational, and cultural uses. PAD-US also includes the best available aggregation of federal land and marine areas provided directly by managing agencies, coordinated through the Federal Geographic Data Committee (FGDC) Federal Lands Working Group.
The following have been updated using the latest PAD-US 2.1 data:
USA Protected Areas – Gap Status Code
For more information, see the item details above and the PAD-US data overview.
USDA Census of Agriculture
The Census of Agriculture, produced by the USDA National Agricultural Statistics Service (USDA), provides a complete count of America’s farms, ranches and the people who grow our food. The census is conducted every five years, most recently in 2017, and provides an in-depth look at the agricultural industry. Various layers have been previously published, with two recent additions: Winter Wheat Production and Hay Production.

For more information, see Explore the U.S. Census of Agriculture.
USA Wetlands
USA Wetlands content has been updated, including the feature layer, map image layer, and imagery layer.

The data is published from the National Wetlands Inventory (NWI) produced by the US Fish and Wildlife Service. NWI is designed to assist land managers in wetland conservation efforts and is managed by the US Fish and Wildlife Service.
Global Water Provinces
This new layer displays global water provinces, a hydrologic area unit that merges major river basins from hydroSHEDS with political boundaries for use in water planning.

WorldClim Global Mean Precipitation
This multidimensional layer displays global mean precipitation estimates from WorldClim, providing monthly and annual precipitation estimates. Various rendering choices in Map Viewer and processing templates in ArcGIS Pro can be used to view data for each month and the annual mean separately.

Policy Maps
Federal Payments toward Conservation/Wetlands vs Farming
This new map shows the relationship between Federal payments toward conservation and wetlands and payments toward producers not including conservation/wetlands. The map was made from the USDA Census of Agriculture layers, specifically USDA Census of Agriculture 2017 – Federal Payments. To learn how to replicate this policy mapping technique, see How to make that map: Census Agriculture Relationship Map.

American Community Survey (ACS)
The Living Atlas Policy Maps team maintains a collection of 104 layers containing a wealth of data from U.S. Census Bureau’s American Community Survey (ACS). ACS is an ongoing survey by the U.S. Census Bureau that provides vital information on a yearly basis about our nation and its people.
New maps and apps based on ACS data have been recently published and are available in Living Atlas with maps available in Esri Maps for Public Policy. These include:
What is the Average Household Size?
Renter Occupied Housing and Home Value
Owner Occupied Housing and Home Value
What is the predominant number of units per housing structure in the area?
A Look at Housing Stock in the US
How the Age of Housing Impacts Affordability
Relationship between Median Housing Age and Cost-burden Housing
Homeownership among Hispanic and Latino vs. non-Hispanic White Households

A new blog article has been published that offers insight and examples of how to use ACS margins of error within your maps.
Broadband Accessibility
New maps and apps highlight access to broadband using the latest FCC Form 477 Fixed Broadband Deployment layer.

The following maps and apps highlight where different populations are underserved and align them with patterns such as proximity to schools and libraries.
Where are schools that fall within areas of poor broadband/internet?
Broadband Near Public Libraries
No Terrestrial Broadband Service Dashboard
Esri Maps for Public Policy
Policy maps clearly show where there is an opportunity to intervene. Esri Maps for Public Policy provides instant access to useful maps that illuminate areas where your work can make a difference. Free to the public to view and use, these policy maps give your team a head start understanding the people, organizations and issues in your community.
The Esri Maps for Public Policy website has been updated with additional resources, including links to documents, Learn GIS lessons, and best practices to help you get the most out of Policy Maps.
Analysis tools
Deep learning models
Ready-to-use deep learning models are now available via ArcGIS Living Atlas. These models have been trained on data from a variety of geographies, you no longer have to invest time and energy into manually extracting features or training your own deep learning model. As new imagery comes in, you can readily extract features at the click of a button and produce layers for mapping, visualization and analysis.

New and updated pre-trained geospatial deep learning models can be found by browsing Living Atlas. These include:
Building Footprint Extraction – USA
Human Settlements Classification (Landsat 8)
Human Settlements Classification (Sentinel-2)
Land Cover Classification (Landsat 8)
Land Cover Classification (Sentinel-2)
Road Extraction – North America
To learn more about the deep learning packages and how used, view the item details.
For more information, see Introducing pre-trained geospatial deep learning models and Pre-trained depp learning models update (February 2021). You can also view all raster function templates in Living Atlas.
Community Maps
The Community Maps Program enables community contributions of authoritative data to help build the ArcGIS Living Atlas. You can provide feedback, create detailed features, and share data layers and services, contributing to Esri basemaps that anyone can use.
If you don’t have a collection of data layers to provide, but still want to contribute, consider adding content through the Community Maps Editor app. Edit parts of the Esri Community Maps basemap to add detailed features for universities, schools, parks, landmarks, and other special areas of interest. Recent contributions and releases include over 100 new and updated communities in basemaps and World Imagery.
For more information, see Community contributions (March 2021).
More information
For more information, see the following:


Commenting is not enabled for this article.