ArcGIS Living Atlas of the World is the foremost collection of geographic information from around the globe. It includes curated maps, apps, and data layers from Esri and the global GIS user community that support your work. Visit the ArcGIS Living Atlas of the World website where you can browse content, view the blog, and learn how you can contribute. Here’s what’s new since the last Living Atlas News.
ArcGIS Living Atlas Indicators of the Planet (Beta)
From climate change to equality, we are faced with a variety of challenges. Indicators of the Planet is a new application from ArcGIS Living Atlas of the World, bringing together the latest information from across the community of contributors to Living Atlas. Each GeoCard provides an updating summary statistic along with maps and resources to allow you to explore and keep you updated on a variety of topics.
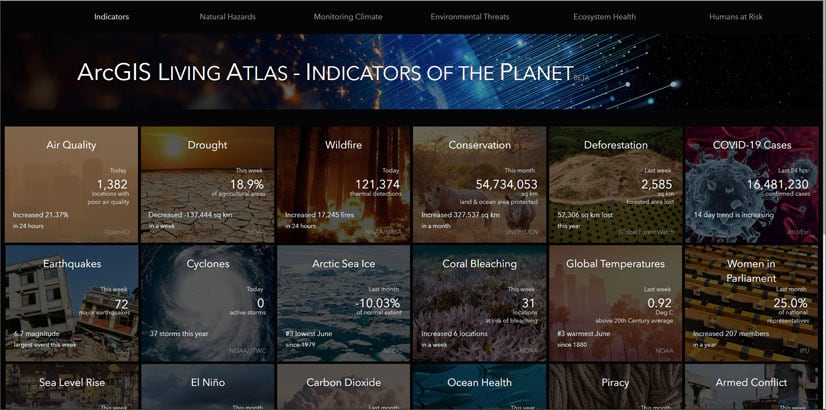
Living Atlas Indicators of the Planet was developed using ArcGIS Experience Builder and is in its Beta release while additional capabilities are being implemented. See Introducing ArcGIS Living Atlas of the Planet for more information.
Basemaps
Esri vector basemaps are updated regularly with data from commercial, open, and community sources. The following summarizes recent changes and additions.
The localized vector basemap galleries are expanded and include creative styles with translated map content. Danish, Portuguese (Portugal), Norwegian, and Romanian have been added, bringing the total to 24 localized language basemaps. Localized basemaps automatically appear depending upon your organization’s language and locale setting. See all localized content.

Places, such as restaurants, stores, businesses, and other points of interest, are now included in Esri vector basemaps. These include several million places in the United States using SafeGraph Places as the source. Millions of HERE Places were added in many countries outside the United States.
The Places layer will be available in many of the styles available for the Esri Vector Basemaps and has first been added to beta styles of Streets and Imagery Hybrid maps. For more information, see New places in Esri vector basemaps.

View more creative vector basemaps in the Creative Vector Tile Layers and Maps group, or search the Living Atlas website.
OpenStreetMap
OpenStreetMap (OSM) vector basemaps continue to be updated regularly and are available in a variety of styles. A new OSM Dark Gray Canvas style is also now available, and is designed to match Esri’s Dark Gray Canvas using thinned content from the full OSM data.
A number of OpenStreetMap layers (beta) are now hosted in ArcGIS Online and available in the Living Atlas. Each layer is a feature layer view which references the OSM data in ArcGIS Online. The layers are updated at frequent intervals ranging from 1 to 15 minutes.
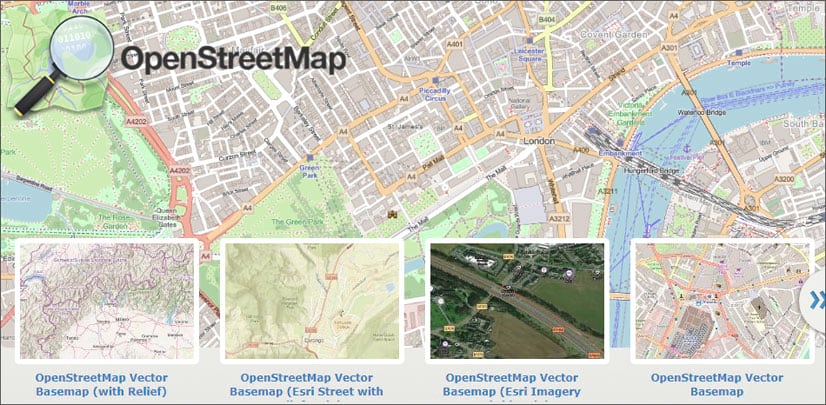
These feature layers allow you to access the latest OpenStreetMap data, such as buildings, highways, and amenities, created and edited by OpenStreetMap contributors. OSM layers can be used with any basemap, can be combined with other layers, and can be used for both visualization and analysis.
Recently the set of layers have expanded to include North America, Africa, Central America and Caribbean, Australia and Oceania, with additional layers and regions to be added soon. You can view the entire collection of OSM content at the OpenStreetMap home or the OpenStreetMap Layers group.
Imagery
World Imagery content is continually updated, with many improvements and enhancements. To learn more about the latest updates, see What’s new in World Imagery (June 2020).
World Imagery Firefly has been enhanced using bumpification – a technique and style that includes terrain to accentuate and add elevation context to imagery. Bumpification applies a topographic texture to imagery at broad scales to convey the tactile surface of the earth that isn’t necessarily apparent in imagery alone.
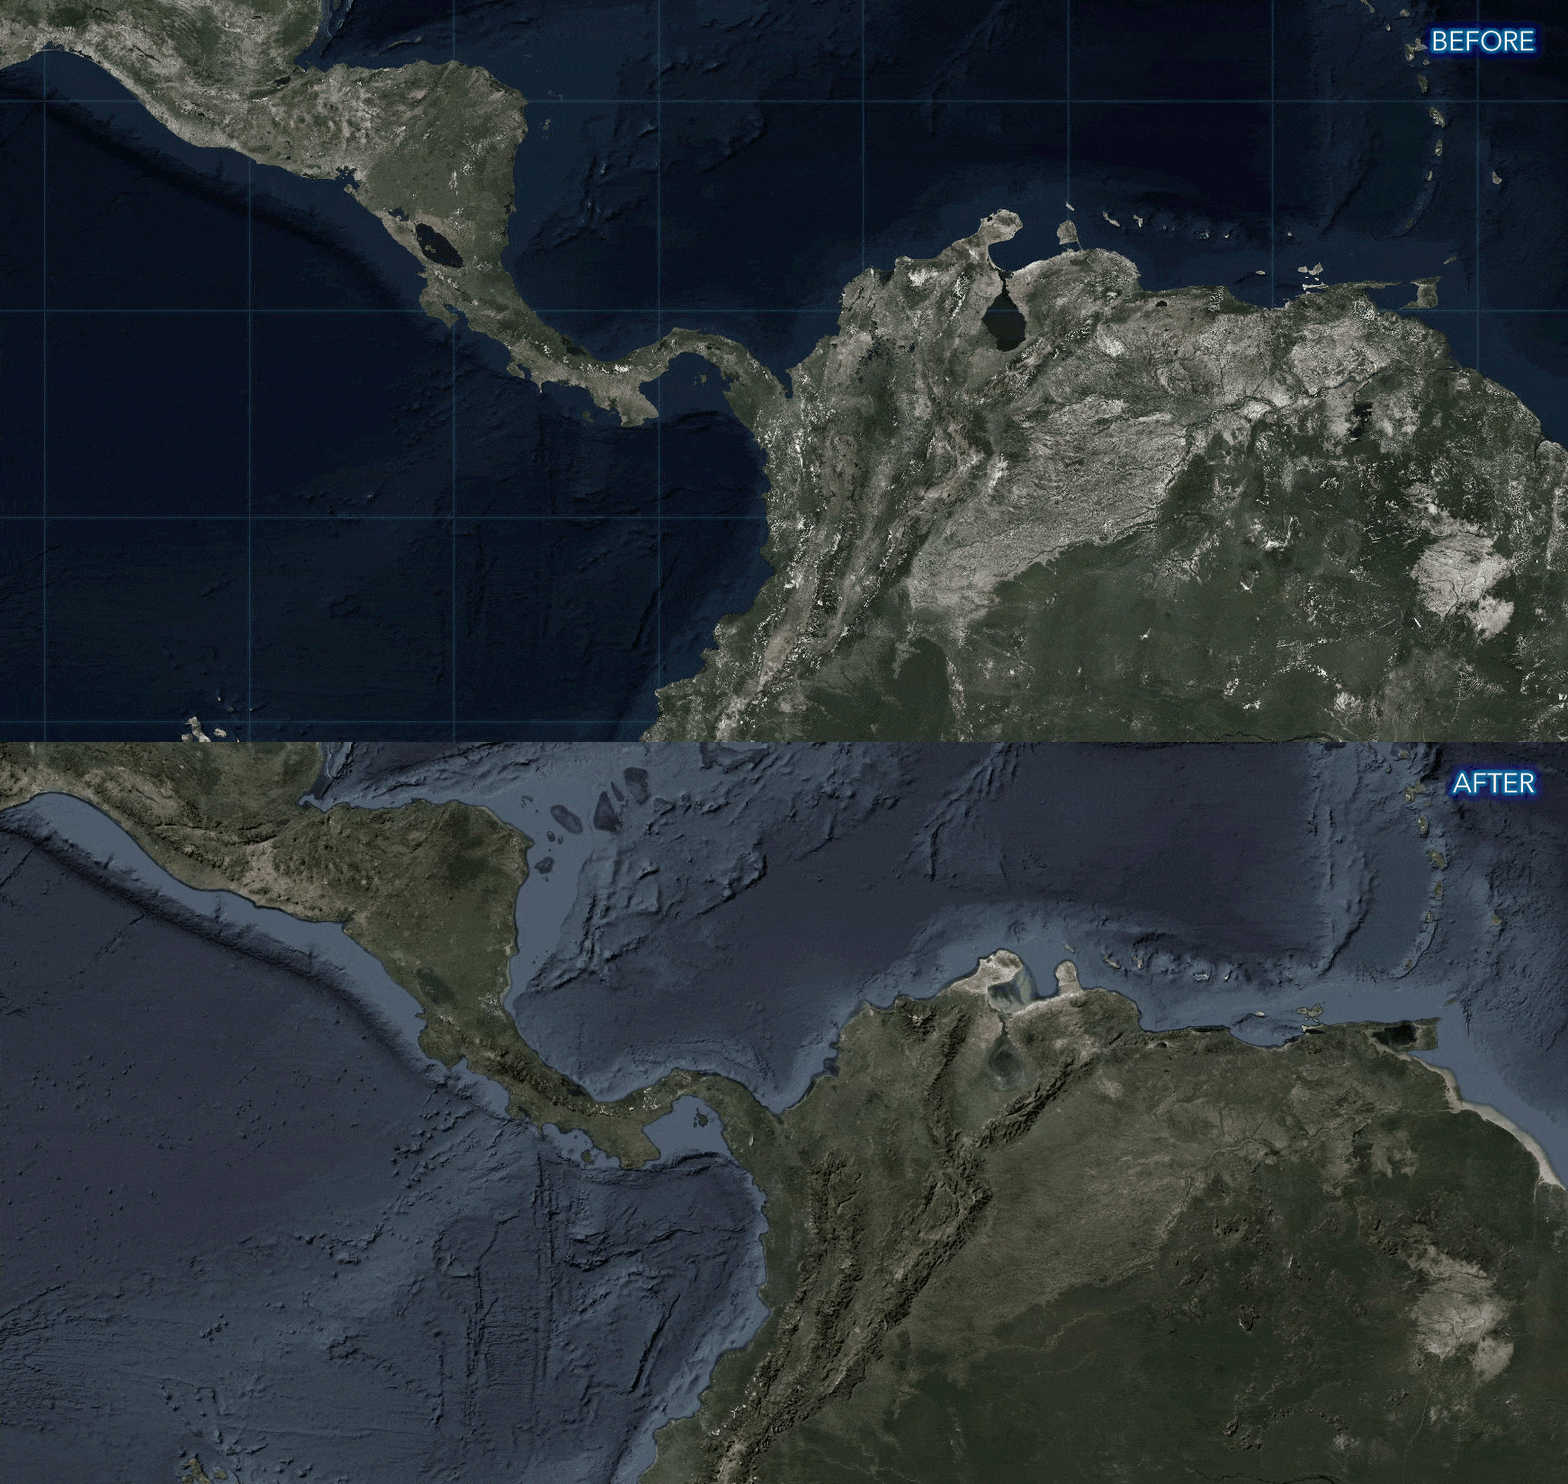
In addition, the graticules that used to appear as part of the Firefly basemap are now independently controlled, providing additional options in configuring the appearance of the Firefly basemap. For more information, see Firefly imagery updates.
Imagery metadata has been improved. When World Imagery is loaded as a layer in your map, as you pan across different geographic locations, and zoom in and out through different levels of World Imagery, you will encounter different sources of imagery.
Previously, when clicking a location in the map, the pop-up returned multiple records, including information about imagery above and below your current zoom level. Now, the pop-up will only return the metadata for the imagery currently visible at your geographic location of interest. See Learning more about the World Imagery basemap for more information.
National Agriculture Imagery Program (NAIP), featuring recent high-resolution imagery from the USDA Farm Services Agency, is now available as a tile layer the Living Atlas. Living Atlas NAIP imagery has been visually enhanced and published for optimal display performance. See the NAIP imagery before and after enhancement animation below:
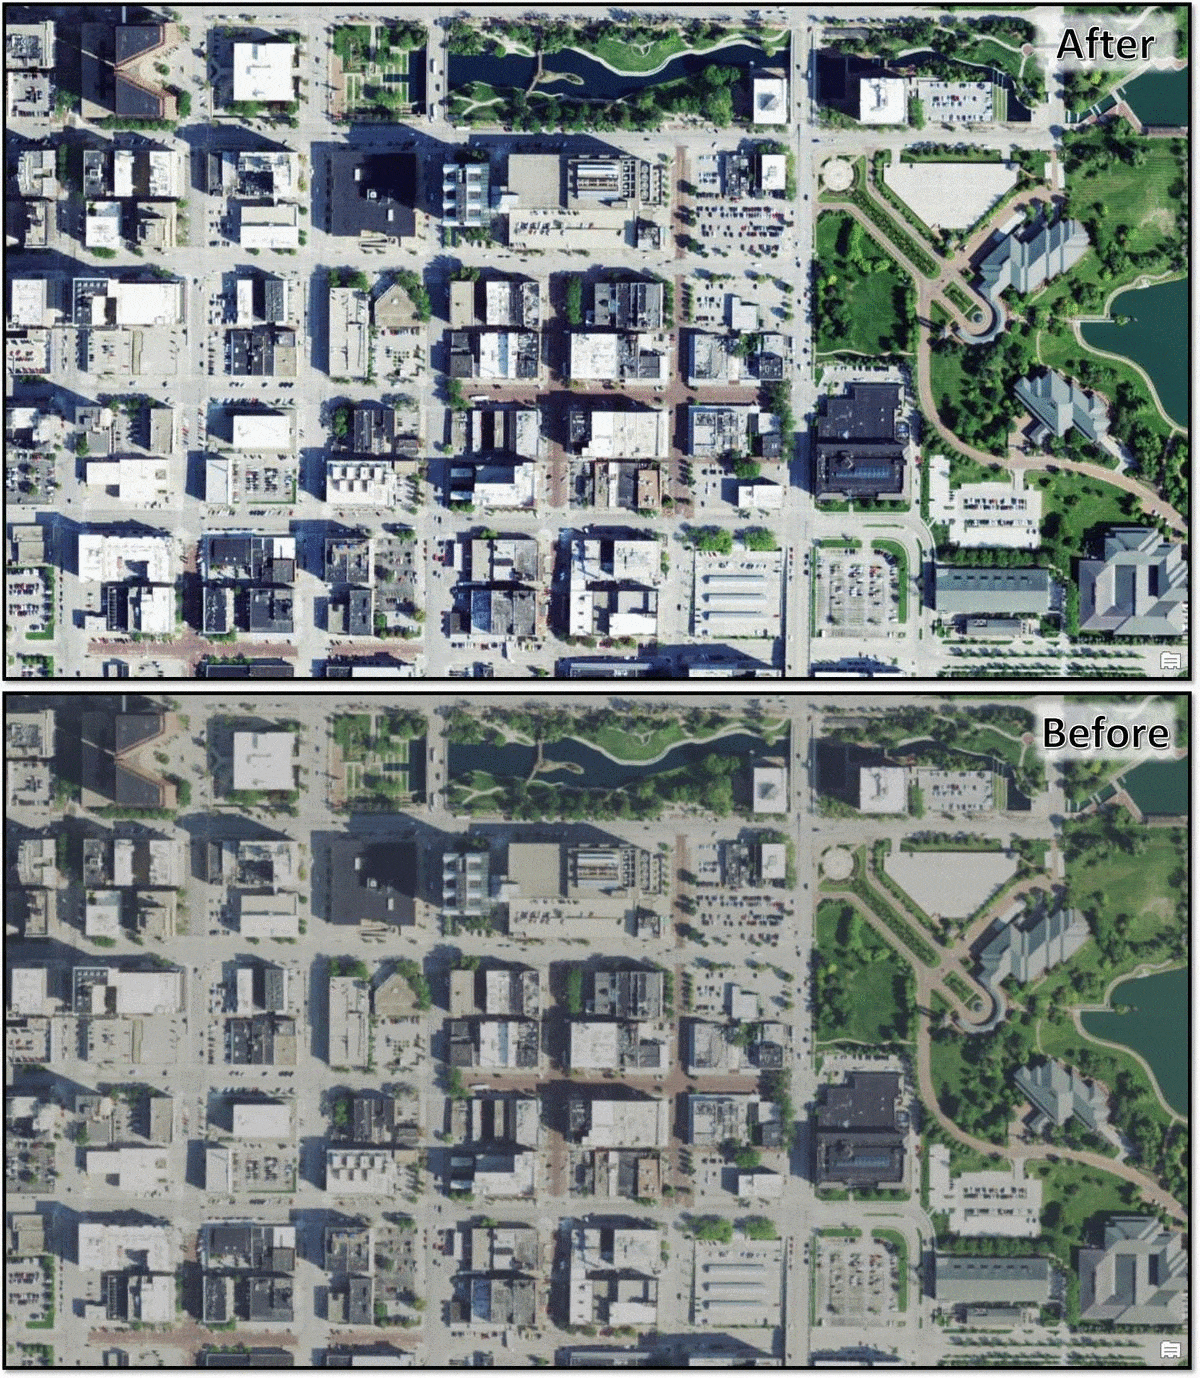
See Fast and simple NAIP imagery for more details. The NAIP Image Service will continue to be maintained for anyone needing image analysis. Look for more information on the new tile layer in the coming weeks.
Environment
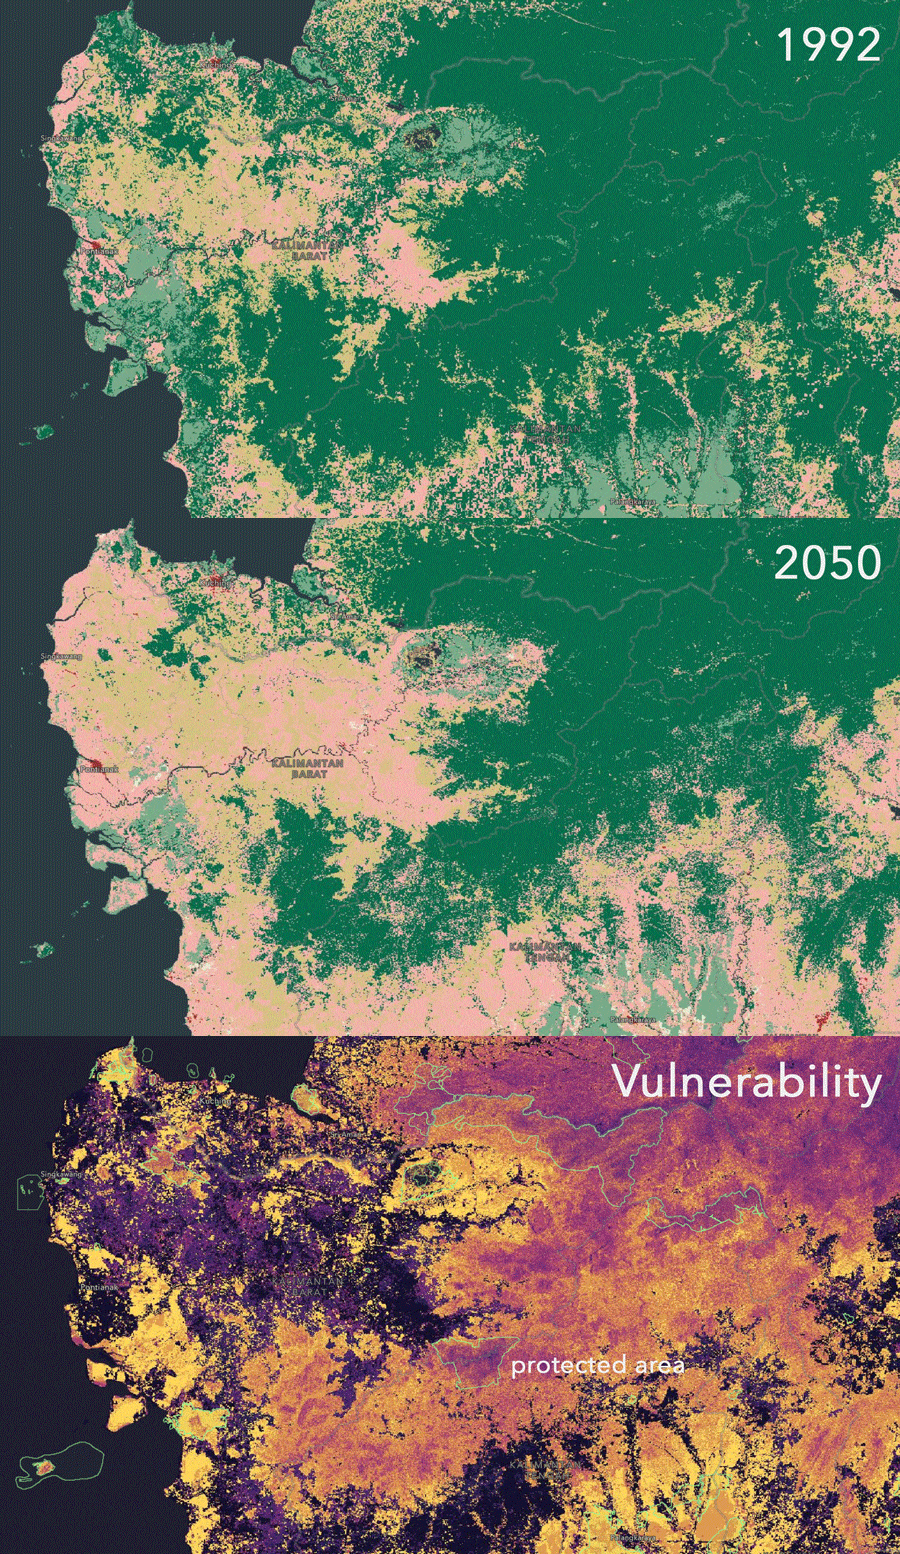
A series of new analytical layers are available in ArcGIS Living Atlas of the World that show predicted land cover in the year 2050 along with the vulnerability to change from a natural to human modified class. Since Clark Labs modeled these layers based on the same 2010 and 2018 European Space Agency’s Climate Change Initiative land cover already in Living Atlas, these layers can be used together.
For the last 22 years, Yale Environmental Law and Policy Center along with The Center for International Earth Science Information Network at Columbia University’s Earth Institute have been compiling the best-available data from organizations around the world to create an Environmental Performance Index (EPI). The 2020 version of the EPI was just released and is now available in ArcGIS Living Atlas of the World.
You can add the EPI layer to your map for visualization and analysis, or download the data to use offline or in other applications. See A global sustainability report card for more information.

Satellite (VIIRS) Thermal Hotspots and Fire Activity is a new layer which presents the most frequently updated and most detailed global remotely sensed wildfire information from VIIRS satellites for the last seven days. This layer is updated hourly using the aggregated live feed methodology. The layer shows the location of thermal hotspots as a time-enabled service so that the progress of fires can be reproduced as an animation. Fire points in the layer are generally available within 3 ¼ hours after detection by the VIIRS satellite.

USA Current Wildfires is a new layer presenting the best-known point and perimeter locations of wildfire occurrences within the United States over the past seven days sourced from Integrated Reporting of Wildland-Fire Information (IRWIN) and National Interagency Fire Center (NIFC). Points mark a location within the wildfire area and provide current information about that wildfire. Perimeters are the lines surrounding land that has been impacted by a wildfire. This layer is updated every 15 minutes using the aggregated live feed methodology. This layer is also accessible through the USA Wildfire Activity App.

Recent Conditions in Air Quality (PM25) is a new layer that shows the latest PM2.5 value from the OpenAQ Community. PM2.5 represents particles of 2.5 micrometers or less which are a health hazard because they can get deep into respiratory system and damage delicate tissues. Activities such as driving, burning coal for electricity, wildfires, and running factories release such particles into the air. The exposure of populations to high levels of PM2.5 increases the risk of respiratory and cardiovascular illnesses. This layer is updated every hour using the aggregated live feed methodology.

USA Crop Frequency layer has been updated with 2019 data.
USA Cropland time-enabled imagery layer has been updated with 2019 data for the default view and all of its processing templates.
USA Federal Lands image layers and feature layers have all been updated. Each of the six agencies in the collection have various data vintages. See individual layers for more information.
Image Layers: USA Federal Lands, USA Bureau of Land Management Lands, USA Bureau of Reclamation Lands, USA Department of Defense Lands, USA National Park Service Lands, USA Fish and Wildlife Service Lands, USA Forest Service Lands
Feature Layers: USA Federal Lands, USA Bureau of Land Mangement Lands, USA Bureau of Reclamation Lands, USA Department of Defense Lands, USA National Park Service Lands, USA Fish and Wildlife Service Lands, USA Forest Service Lands
USA Historic Sites image layer and feature layer have been updated with PADUS 2.0 data, from September 2018.
Elevation
Living Atlas provides foundation elevation layers and tools to support analysis and visualization across the ArcGIS platform. These layers are updated quarterly with high-resolution elevation data from various sources and the Community Maps Program. Recent updates include the following:
World Elevation tiled layers (World Hillshade, World Hillshade (Dark), Terrain 3D, and TopoBathy 3D) are enhanced with high resolution elevation datasets from the USGS 3D Elevation Program (3DEP) at 1-meter resolution, Madrid 1-meter data, and Vienna 1-meter data.
World Elevation dynamic image service layers (Terrain and TopoBathy ) received 1-meter updates from the USGS 3D Elevation Program (3DEP), 5-meter updates from 3DEP for Alaska, and 1-meter updates for Australia (from Geoscience Australia and Moreton Bay regional council). These layers are suitable for analysis and visualization.

Esri Maps for Public Policy
Esri Maps for Public Policy is a collection of expertly crafted and expressive Living Atlas maps that have been chosen because they reveal important community facts. Use the Policy Maps web app to browse and view the collection of maps that combine a variety of topics to help gain insight about demographics and more. Use the app to view and share single maps, or create collections of content that can be shared with anyone.
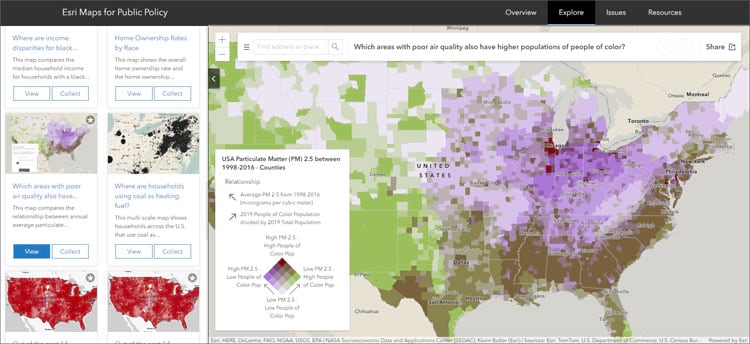
Esri Maps for Public Policy is continually updated and now includes maps crafted from the latest data, including U.S. Census Bureau’s American Community Survey (ACS) and U.S. Bureau of Labor Statics (BLS). Esri Maps for Public Policy now includes more environmental content, such as air quality and solar potential, as well as other topics important for policy discussions.
Some collection examples of newly added maps can be explored below:
- Unemployment
- Air quality and demographics
- Race and ethnicity maps for your community
- COVID-19 trends
These collections are only a sample of the available policy maps. To learn more, and explore and create your own collections, visit Esri Maps for Public Policy.
Other additions
U.S. Bureau of Labor Statistics (BLS) unemployment figures spanning the most recent 14 months is updated monthly, and is offered at the nationwide, state, and county levels. Layer attributes specify which month is associated with each statistic. This layer is used to author a collection of Living Atlas web maps for those wanting ready-to-use content for dashboards and StoryMaps. For more information, see County-level unemployment layer updated monthly now in ArcGIS Living Atlas.

You can now investigate annual air quality patterns in the United States with new maps and layers that have been recently added to Living Atlas. Topics include trends over time and impacts on populations.
USA Particulate Matter (PM) 2.5 between 1998-2016 is a recently added layer that shows particulate matter in the air sized 2.5 micrometers of smaller (PM 2.5). The data is aggregated from NASA Socioeconomic Data and Applications Center (SEDAC) gridded data into state, county, congressional district (116th) and 50 km hex bins. Each layer has been enriched with a set of 2019 US demographic attributes (excluding Puerto Rico) apportioned to the geography in order to map patterns alongside each other. For more information, see Explore Air Quality with New Layers and Maps in ArcGIS Living Atlas.
Over 100 race and ethnicity layers and maps are available, using current and past data, to help understand your community. Visit the Racial Equity GIS Hub for resources, content, and help in getting started.

Anti-Shipping Activity Messages is a new layer presenting the locations and descriptive accounts of specific hostile acts against ships and mariners, also known as Piracy. These reports are useful for recognition, prevention and avoidance of potential hostile activity. This layer is updated weekly using the Living Atlas aggregated live feed methodology.
Living Atlas continues to include daily updates to layers, maps and related StoryMaps on COVID-19 trends by country and by US county, sourced from Johns Hopkins University. Related maps, apps, and layers can also be viewed at the Urban Observatory’s COVID-19 Trends Gallery.
Community Maps
Esri maintains a Community Maps Program through which the user community can share their local, authoritative data with Esri to be used in maps and services. Esri is now offering a new Community Maps Data Sharing option for contributors to have Esri share their data with selected Esri partners and other organizations (e.g. OpenStreetMap) that maintain popular mapping platforms.
In addition, you can enhance the geocoding experience by contributing your most recent, accurate, and comprehensive point or polygon address data to the ArcGIS World Geocoding service. New and existing Community Map contributors have already added over 3 million unique address points (view map). For more information, see Esri’s Community Addresses. You can contact the Community Maps team directly at communitymaps@esri.com.
More information
For more information about ArcGIS Living Atlas of the World, see the Living Atlas blog or Living Atlas website.


Article Discussion: