Every 10 years, the U.S. Census Bureau conducts a count of the U.S. population. They strive to count everyone once, only once, and in the right place.
This count is constitutionally mandated to determine the number of people living in the United States. The 2020 Census marked the 24th time that the country has counted its population. This year was the first time that responding online was an option, and each home received an invitation to respond to a short questionnaire—online, by phone, or by mail. Census then conducted a large non-response follow-up effort to account for addresses that did not respond.
Census results have several high-profile applications: the data collected determines the number of seats each state has in the U.S. House of Representatives and is also used to adjust or redraw electoral districts based on how the population changed – a process known as redistricting. Public Law 94-171 data files used in redistricting were released in August 2021 and is currently available in ArcGIS Living Atlas.
Census data also informs decisions about allocating hundreds of billions of dollars in federal funding to communities across the country—for hospitals, fire departments, schools, roads, and other critical programs and services.
Demographic and Housing Characteristics (DHC)
While the redistricting data provides a first look at population counts, it is only the first of many data products from the Decennial Census. The most recent one to be released is the Demographic and Housing Characteristics File (DHC). This release includes comprehensive information such as age, sex, race and ethnicity, household type, family type, occupancy and vacancy type, and more. The Living Atlas Policy Maps Team is excited to announce that it has released the first set of DHC tables as hosted feature layers in ArcGIS Living Atlas for Census and GIS users alike.

Working with these layers
The DHC contains 249 tables with nearly 10,000 attributes, available at varying geographies with many tables available to census blocks. Due to the size, level of detail, and complexity of the DHC, we have organized our census layers based on popular topics into smaller, easier to digest subsets of the whole. We are pleased to share the first batch of 2020 Census DHC layers:
- USA 2020 Census Population Characteristics
- USA 2020 Census Population Characteristics – Legislative Geographies
- USA 2020 Census Population Characteristics – Place Geographies
- USA 2020 Census Population Characteristics – Metro Geographies
- USA 2020 Census Population Characteristics – School Geographies
- USA 2020 Census Population Characteristics – Tribal Geographies
These hosted feature layers in ArcGIS Online contain multiple levels of geography. For example, this one includes nation, state, county, tract, and block group geographies. All contain 10 DHC tables (P1, H1, H3, P2, P3, P5, P12, P13, P17, PCT12). Attributes include:
- Total population
- Urban and rural population
- Household population
- Group quarters population
- Relationship to householder
- Non-Hispanic race & ethnicity
- Male and female population by 5-year age groups
- Single-year age groups for tracts and higher levels of geography
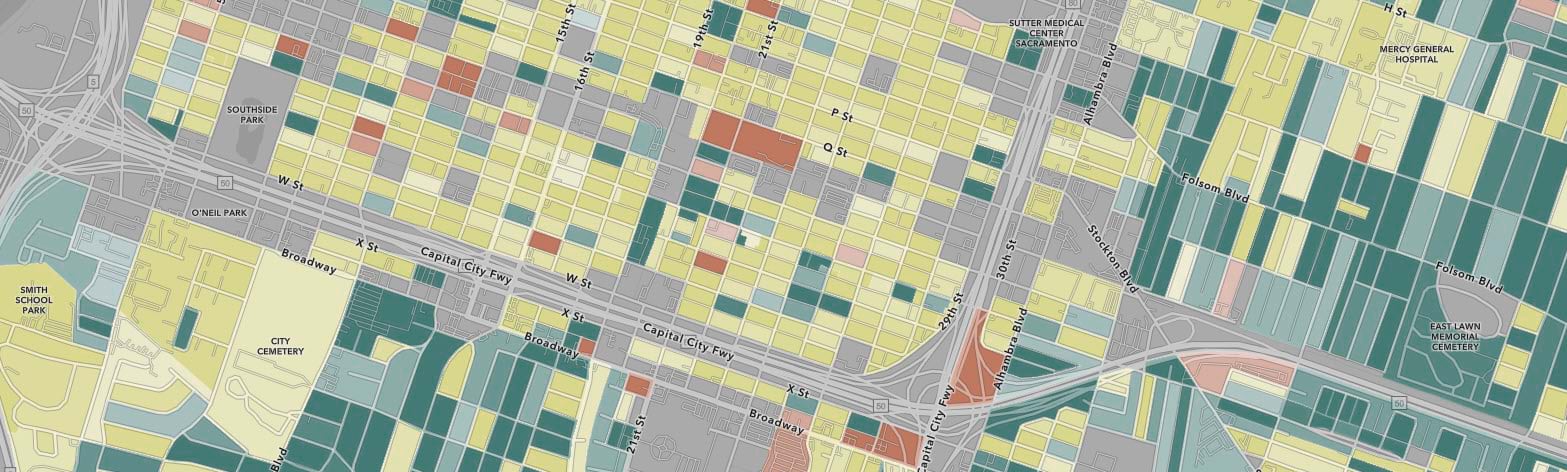
The tables have been joined to 2020 Census TIGER boundaries, neatly trimmed along coastlines, lakes, and major rivers to enable cartographically pleasing maps and apps of Census data. We have also pre-calculated additional counts and percentages for your convenience such as working-age population. Each field has a readable field alias and detailed field descriptions sourced from Census metadata documents. With essential metadata built into the layer, all GIS users have access to it from within ArcGIS products saving time from searching through the technical documentation.
Block Characteristics layer
If you read the last section and thought, Where are the census blocks in this list? We’ve got you covered with a layer with a small set of essential attributes: USA 2020 Census Block Characteristics that contains all 8 million blocks (8,174,955 to be exact). We’ve also included the national figures in a nation-level layer for your reference.
What about differential privacy?
To protect the privacy and confidentiality of Census respondents, Census protected the data using differential privacy techniques. It works by adding statistical noise—small, random additions or subtractions—to every published statistic so that no one can reidentify a specific person or household with certainty using any combination of the published data. Census encourages data users to aggregate small populations and geographies to improve accuracy and diminish implausible results.
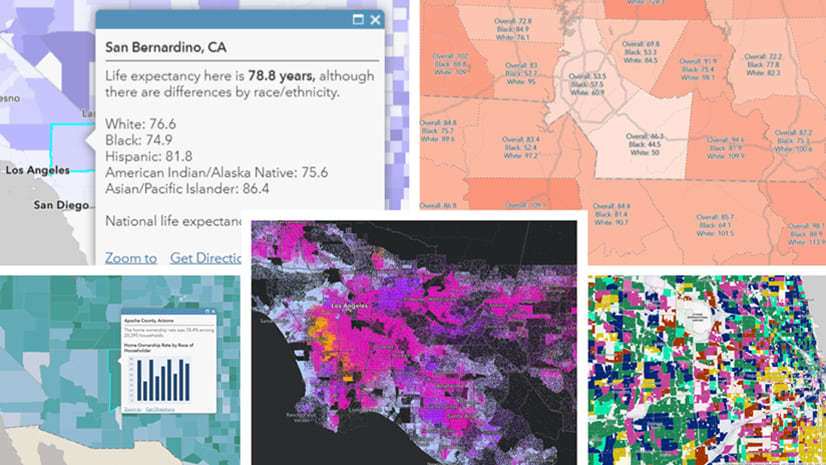
You’ll notice the pop-up on this layer uses Arcade to display aggregated values for the surrounding area in addition to the individual values for the blocks, block groups, and tracts.

This aggregation is done on-the-fly via a few of Arcade’s geometry functions, specifically Buffer and Intersects. If you want to create aggregations that will persist, or to create your own aggregations, the Summarize Within tool in ArcGIS Online can be helpful if you have your own polygon layer you are interested in overlaying. Also, this layer can be opened in ArcGIS Pro for further aggregating and analysis. For example, ArcGIS Pro’s Build Balanced Zones tool creates spatially contiguous zones based on criteria that you specify.
Ready-to-use maps
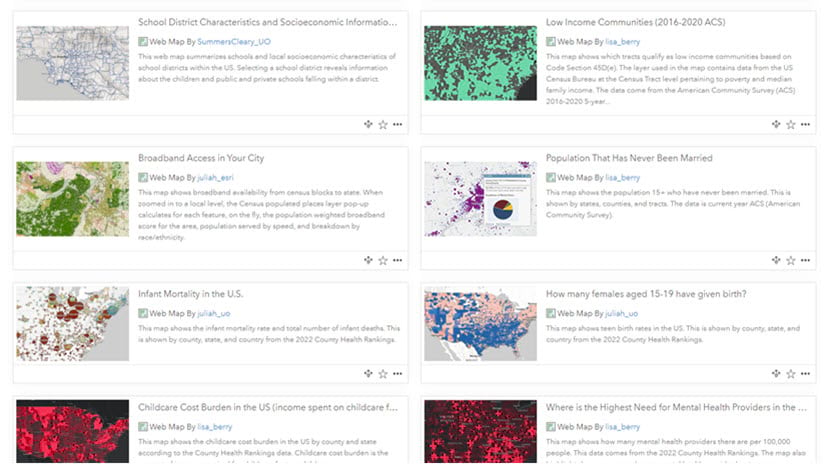
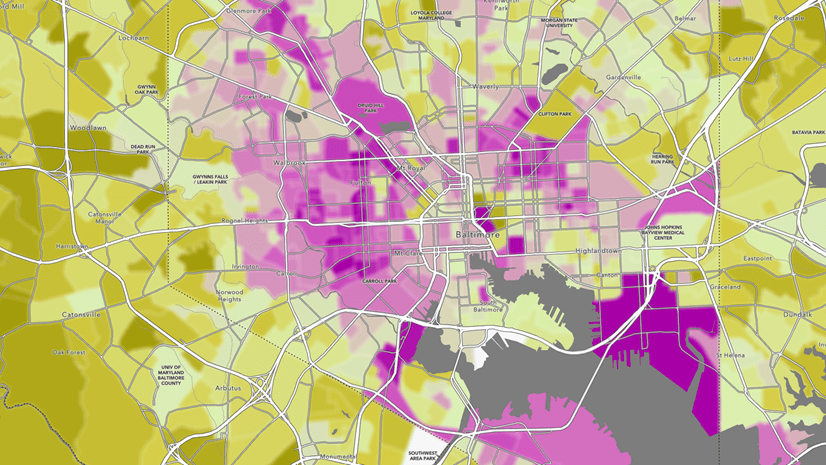
The Policy Maps team has also created a portfolio of maps from this data to get you started. Each map uses the Inset App to show Alaska, Hawaii, and Puerto Rico next to the continental U.S. Add these maps from Living Atlas right into stories, dashboards, hub sites, and Instant Apps.

These maps are just part of our growing set of maps and apps from 2020 Census data, many of which were created during the redistricting release. Compare these to the maps in Living Atlas that visualize 2010 Census data and see how the nation’s population has changed.
You can find a growing list of web maps and apps in the Decennial 2020 Census Map and App Examples group. These are suitable for immediate use in dashboards and ArcGIS Instant Apps such as Atlas, Portfolio and others.
Way More to Come
Additional layers will be released on all kinds of exciting topics: housing, age and sex, race and ethnicity, household population, group quarters population, and households. We are producing these layers and additional content as a “rolling-release” as we add more Living Atlas content every week. Here’s a preview of what you can expect:
Population: population density, urban/rural status, total population, and other high-level population characteristics for age, race/ethnicity, and relationship to householder.
Housing: vacancy status, type of vacancy, available housing, owner/renter status by race, owner/renter status by age, owner/renter status by presence of children in household, and more.
Age and Sex: 5-year age groups by sex by race, median age by sex by race, dependency ratios, and more.
Race and Ethnicity: detailed race combinations for multiracial populations.
Households: household and family type, coupled households, multigenerational households, household size.
Group quarters population: population in college/university housing, military housing, skilled nursing facilities, and correctional facilities by age, race, and sex.
Household population: living arrangements and relationships.
We plan to update this blog post with links here when they are released, so check back here in the coming weeks. Feel free to bookmark this group of all Decennial 2020 layers if you find yourself searching for these on a regular basis, or bookmark this group of web maps as this collection will continue to grow.
Of course you can also check by searching Living Atlas when working in ArcGIS Online or in ArcGIS Pro. ArcGIS Living Atlas is designed to support GIS analysts by having the content you need to jumpstart your workflows. If there is a specific DHC table or attribute you need for your work, let us know on Esri Community’s Living Atlas space. Post/answer questions and share with other GIS analysts how you’re mapping this once-in-a-decade dataset.
We also invite you to join us in San Diego next month and attend the Living Atlas: 2020 Census Content Tour session to learn more and connect with others.
Note: Blog last updated on 9/26/23 to add link for the Household Population Characteristics layers.


Article Discussion: