Need help finding the right colors for your layer or project? It can be easier than you think when you use nature as your guide.
In this blog we will create sunset themed solar energy palettes using design tools and then apply them to a raster layer using ArcGIS Pro raster functions. This is a GIS approach that is one part art and one part technique.
Global Solar Energy Potential Available in ArcGIS Living Atlas
As a cartographer for Esri’s Environment Team I created the color palettes for the Global Solar Atlas in ArcGIS Living Atlas. This layer allows you to see solar potential for where you live as well as other variables to understand your situation more specifically.
When coming up with the color palettes there were several things to consider:
- The raster layer has six different solar variables.
- This version will display the six variables as processing templates so that users can switch between different renderers. Each one needs their own palette with 10-13 color classes.
- They must all look good together as a set.
- Each palette needs to work on both a light or dark basemap (quite tricky).
- Should have yellow as the highest or most optimum value (natural intuitive color for the sun) so the viewer understands that yellow = most favorable/best in all templates.
- All colors should be sequential and discernible while not appearing to be more important than the other and yet highlighting the highest potential.
Did I just say six yellows? Quite a challenge and if you have worked with yellow you will understand this.

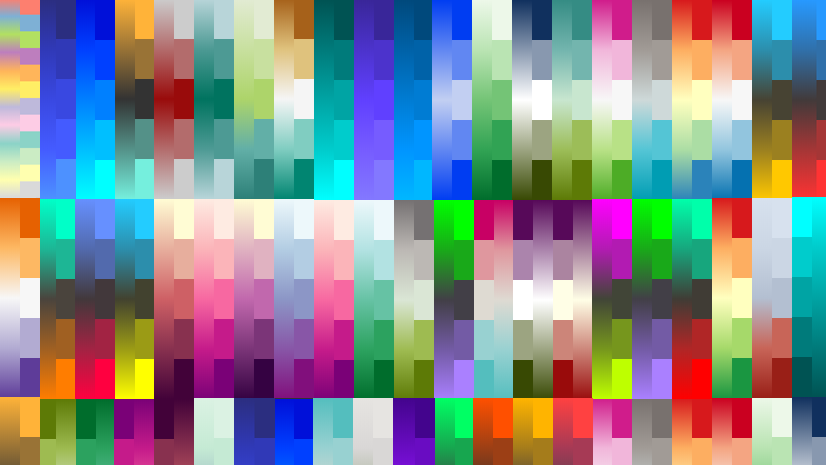
Nature’s Palettes
Nature is the best place to find perfect arrangements of color. There are endless possibilities from the iridescent and bold patterns found on animals to the subtle hues of wide open landscapes. The color palettes for our maps are naturally all around us – now to try and tap into them.

While pondering a sunset I realized that I didn’t need to look any further for ideas for these six solar templates. It’s all right there. The solar layer would mimic those dazzling gradients and magnificent cloud colors that sweep across the sky. What a perfect way to represent the solar data in its most true and fundamental form.
Creating the Palette
Here’s a wonderful new friend – the ColorPic tool. This allows you to EASILY sample colors from anywhere on your computer!

Another tool that’s available online is Adobe Color and it’s just spectacular. Here you can upload a photo, toggle around the image for the colors desired, and then export the palette directly into your Adobe library. How handy! It also makes gradients!

Artistic Process
For this project I photographed sunsets and sunrises over the course of several weeks and using the tools above sampled the images until I found the perfect color that represented each of the unique solar variables. Next I created the six palettes by blending the colors together in Adobe Illustrator.

Now let’s take one of those color palettes and apply it to one of the solar variables.
Use a Raster Function Template to Assign the Palette
This will be a two step process:
- Develop the two source files needed – one .csv table that contains the data classes and one .clr table of RGB colors for each of those classes.
- Build, save, and run the Raster Function Template (RFT) that contains two functions that will pull the information from the two tables.
RFT’s are incredible and behave like models. They contain one or more raster functions that are chained together to produce a workflow. The function can then process pixels on-the-fly which no longer means saving to disk or recreating another version of the raster…and it gets even better because these templates can than be exported and shared.
For this example we will leverage two functions that are part of an abundant function library available in Pro:
Remap – This allows you to change or reclassify the pixel values of your raster data through specifying a range of pixel values to map to an output pixel value or by using a table to map the pixel values to output pixel values
Colormap – This function is a type of raster data renderer. It transforms the pixel values to display the raster data as either a grayscale or a color (RGB) image based on specific colors in a color map file, or based on a color ramp.
Create your Source Files
Begin in Excel by entering in your classes and assigning a minimum (Min) and maximum (Max) range for each cell (Column B & C in the graphic below) as well as a class value called ClasVal (Column D). Make sure your ranges are back to back. Save as a .csv file type.
Second take those classes into a program like Notepad++ and individually add in your color’s RGB value. Separate each item by only one space (double check your formatting) and enter the same ClasVal. Save as a .clr file type.

Build the Raster Function
In ArcGIS Pro add in your raster layer and from the ribbon select Analysis – Function Editor.

Here’s a video showing how to add the raster layer along with the Remap and Colormap functions to the RFT:

Now that we have everything in the builder, double-click on each of the functions to open up their settings and please set them like this:
Remap Function

Colormap Function

Now that everything is configured SAVE and run the Raster Function Template.

There is a Pro Package here of a sample solar variable (OPTA) and the .clr and .csv files if you would like to walk through the steps above.
Now that we have built our different palettes and created all of the files necessary to apply them to our Raster Function, let’s see how they look as finished products.
Results


Switching between Renderers
Check out the finished products in Online or Pro by adding in the Global Solar Atlas from ArcGIS Living Atlas. Show below are the processes for switching between the different renderers:
ArcGIS Online

ArcGIS Pro

Palettes also work with Dark…
Remember the original criteria? It had to work on a dark basemap? Check out this post on Esri’s Instagram page:

Other Palette Building Resources
PhotoChrome.io – A wonderfully wicked creation by Esri’s own Jinnan Zhang and John Nelson. Type in a word and it sources photographs with that tag and then creates a palette.

Chroma.js Color Palette Helper where you can easily build palettes by taking your known HEX values, number of classes, and if you want a sequential or diverging palette.

Thank you and please reach out to me for comments or questions.
Geography matters! All sunset and sunrise photos were taken from a spot at the end of a quiet and dusty dirt road in Mariposa, California.


Article Discussion: