2018 has been a big year for ArcGIS Online and related products, with many enhancements and additions that help you administer your organization, support and enable workflows, engage and empower others in your organization, and communicate publicly. Whether you are making maps to monitor lava flows, fight fires, plan cities, protect ecosystems, improve your business, or tell stories, ArcGIS Online continues to evolve to better support your needs and activities.
Many of the improvements and additions are the result of community feedback, obtained from many sources. These include Esri Technical Support, Esri Training participants, MOOC program students, Esri Professional Services and Enterprise Advantage Program subscribers, Esri partners, GeoNet, ArcGIS Ideas, conferences and meetings, account managers and solution engineers, emails you’ve sent, and just about everywhere else. Your feedback is continually compiled, and frames each release and the road ahead.
It’s easy to overlook some of the changes and improvements in a release, especially when you’re busy or don’t have time to explore new capabilities. As a refresher, here’s an overview of what has been delivered, with links to all the details. The Top pick and Other picks are subjective, so view the entire release blog post to make your own picks, and discover new features that you may have missed.
April 2018
Top pick
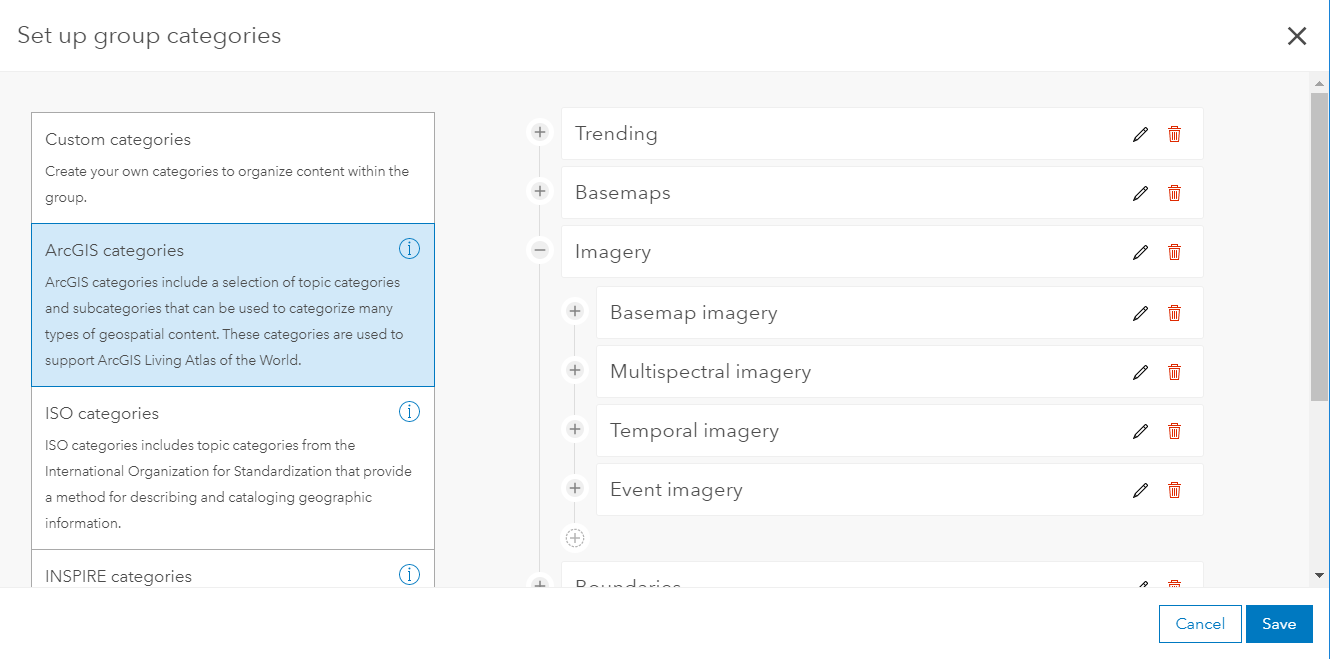
Content categories are introduced, a new way to organize content across your organization. You can establish hierarchical categories for your organization or group content by choosing from standard category templates, such as ArcGIS, ISO, or INSPIRE, or by creating custom categories that make sense within your organization, or support projects and workflows.
Other picks
Scene Viewer is now supported on mobile devices. Edge rendering accentuates the outlines of your 3D buildings, including exterior walls, balconies, or roof structures. Enabling the Edges option also increases the contrast and depth perception of your scene. The new Measure area tool lets you interactively measure areas in 3D scenes.
Story Map Tour has a fresh, new side panel layout with an optional cover page.
Media Map is a new addition to the configurable apps, presenting a simple UI that is suited for embedding in web media.
Operations Dashboard introduces several new features. You can now use serial charts and pie charts as the source of dashboard actions, and use the new embedded content element to embed documents, images, and videos into your dashboard. The map element now includes a scale bar and search feature, and you can specify new options for dashboards that contain subscriber content.
All the details
What’s New in ArcGIS Online (April 2018)
June 2018
Top pick
Using new Relationship styles you can explore and visualize two topics within a single map. These styles help you see if two attributes from your data might be related by using bivariate choropleth mapping. Relationship styles apply a combination of two distinct color ramps to the attribute data, letting you see where patterns converge (or not). For more information see the How to Smart Map: Relationships Story Map.

Other picks
Hosted feature layer performance is improved, enabling you to display large amounts of data at once. When visualizing large numbers of features in a map, the size of the data delivered to your browser has been reduced, meaning they display much faster. Coupled with previous improvements, this allows you add, visualize, and query large amounts of data quickly.
Go back in time with World Imagery (Wayback), a digital archive of the World Imagery basemap that enables you to access archived imagery. Use the World Imagery Wayback app to select any vintage you like from over 80 versions of World Imagery captured over the past 5 years, and create layers and basemaps for your use. Wayback can be used for general comparison, to obtain better alignment with existing GIS layers, or omit clouds or other undesirable image characteristics.
Administration of the site became easier, with a redesign of the organization page designed to help manage members, and access information quickly. Administrators can see the status and latest content of the organization at a glance, including description details and credits, and toggle through different organization views. Members can be found quickly to review their items and activity, filter them by role and level, and disable and enable membership for multiple members at once. See The organization page has a new look for more information.
It’s even easier to access your organization from your mobile device. In addition to the mobile browser option (just use your URL), you can now access your organization using ArcGIS Companion, a new mobile app for iOS and Android. Access your organization anytime, anywhere to explore content, view groups, edit your profile, and more. Find the app in the Apple App Store, Google Play, or Amazon.
All the details
What’s New In ArcGIS Online (June 2018)
September 2018
Top pick
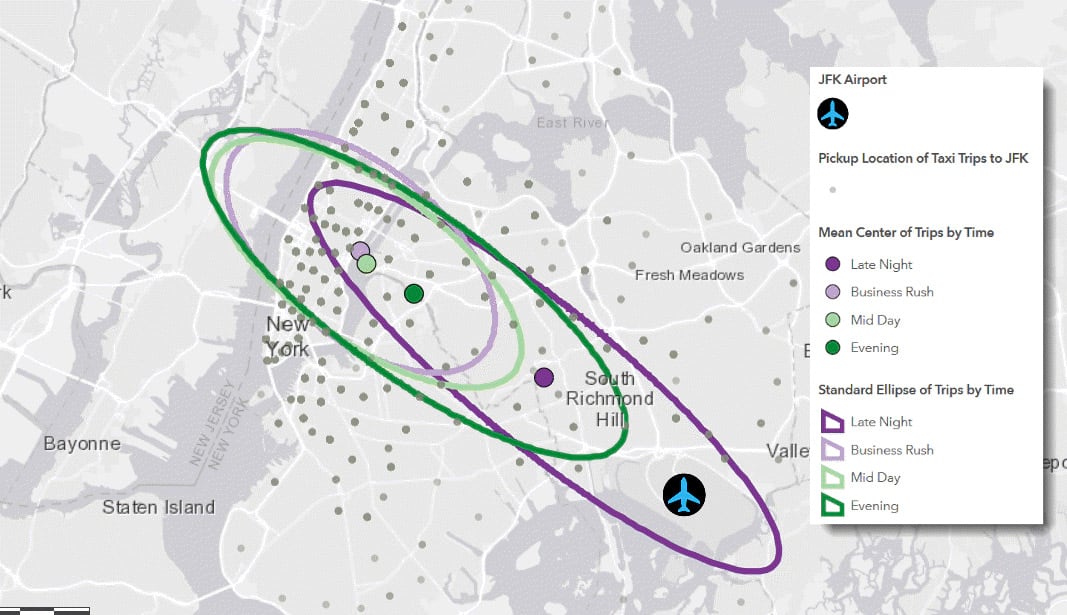
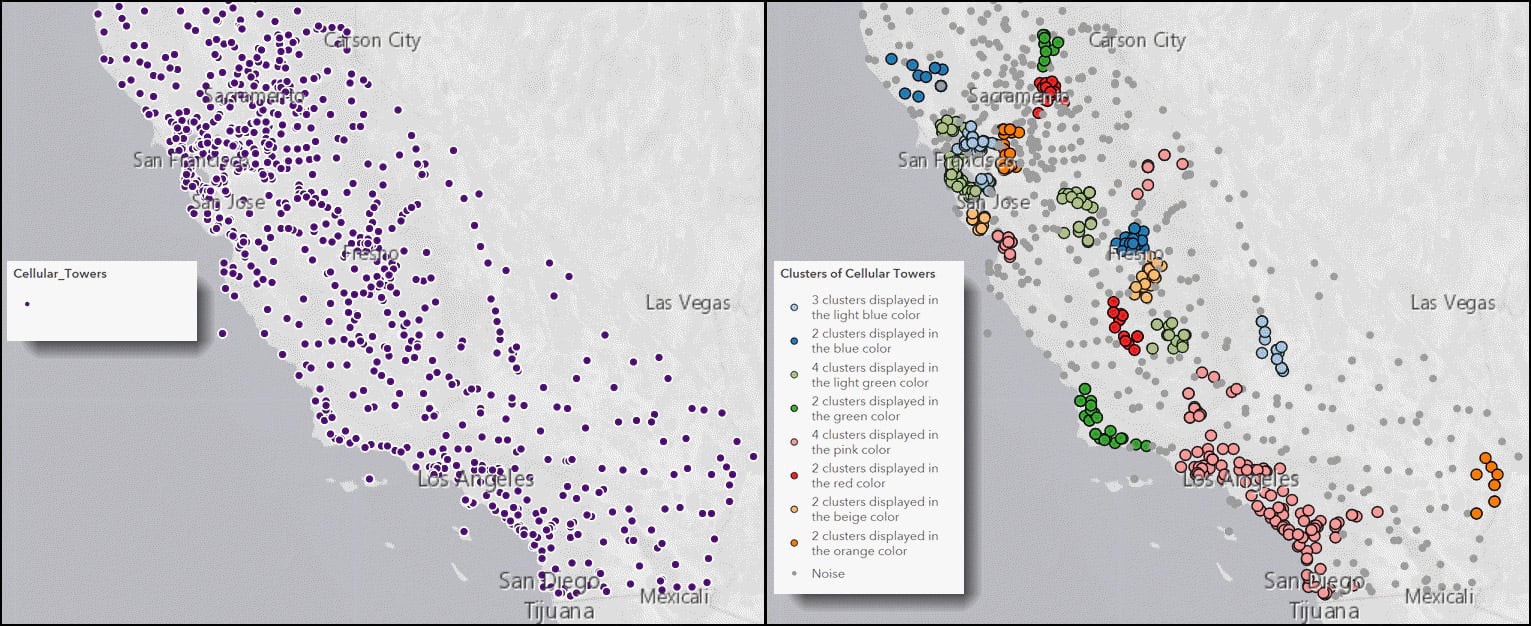
New spatial analysis tools are introduced; Summarize Center and Dispersion measures the distribution of a set of point features to calculate the central feature, mean center, median center, or ellipse (distribution). This tool can be used to track changes over time or compare distributions of different features. Find Point Clusters locates clusters of point features in surrounding noise based on their spatial distribution. This tool detects areas where points or events are concentrated and where they are separated by areas that are empty or sparse.
Other picks
Configurable apps are templates that you can configure easily, without any coding. They help you publish apps quickly for a variety of users and workflows. Configurable apps are the fastest and easiest way to go from a map to a shareable app. Image Visit, Scene with Inset Map, and Layer Showcase are new additions.
The ArcGIS API for Python provides simple and efficient tools for automating tasks in your ArcGIS organization, as well as performing GIS analysis and visualizing your spatial data. ArcGIS API for Python integrates smoothly with the open-source Python ecosystem, including the popular Jupyter Notebooks and now supports the JupyterLab framework, offering a robust file explorer, a more intuitive user interface, support for interacting with other file types, and more.
Learn ArcGIS is a website containing timely and engaging guided lessons that are based on real-world problems, covering the entire ArcGIS platform. A new gallery experience is introduced, along with new lessons, new Learn paths, and Teach with GIS resources for educators.
Survey123 for ArcGIS is a simple and intuitive form-centric data gathering solution that makes creating, sharing, and analyzing surveys possible in just three easy steps. For this release the website and field app now support Webhooks, enabling workflow automation and application integration. Nested repeats are now supported in the field app, as well as geosearch and geocoding on geopoint questions. New group and file upload question types have been added to the web designer and the web app. Additionally, a new filtering option has been added to the website on the Data tab, and enhancements have been made to reports.
All the details
What’s New in ArcGIS Online (September 2018)
December 2018
Top pick
User types now replace member levels as a more flexible way to license ArcGIS Online capabilities and apps. Administrators can assign user types with associated privileges and apps to better align with your organization, and the needs of your members. For more information see Introducing user types, or view the ArcGIS User Type Video Tour.

Other picks
Esri Maps for Public Policy is a free resource for policy makers to actively engage in community decision making. Powered by the Living Atlas, communities now have access to pre-authored maps from curated datasets that can be used to learn more about social equity and health, economic opportunity, transportation and infrastructure, resilience and sustainability, environment and natural resources, and public safety.
ArcGIS Living Atlas of the World introduces Dark Multi-Directional Hillshade, a new server raster function that can be applied to the World Terrain layer. The renderer can be set via the Image Display properties of the layer. This dark gray hillshade supports bright colors and labels for your theme, enabling you to create compelling visualizations. Also introduced is the 8-meter resolution Reference Elevation Model of Antarctica (REMA) along with the REMA Explorer, and a 2- meter resolution Arctic DEM and the Arctic DEM Explorer.
Scene Viewer introduces a Slice tool that reveals hidden data in building interiors or underground. The tool lets you inspect features in a building, or display geologic or structural data beneath the surface.
Learn ArcGIS lessons are now available as a group gallery of items, so you can easily find them in ArcGIS Online and share them into your organization. This makes them even more valuable as resources to learn new techniques, workflows, and methods. See Share ArcGIS Learn lessons within your organization.
All the details
What’s New in ArcGIS Online (December 2018)
The year ahead
There are many incremental improvements, as well as new capabilities, that will be introduced throughout 2019. Keep the feedback coming at ArcGIS Ideas or the ArcGIS Online space on GeoNet. Stay tuned to the ArcGIS Online blog and GeoNet for announcements, and the latest information about upcoming releases.

Commenting is not enabled for this article.