In this tutorial, I’ll share some tricks for visualizing ocean depths in ArcGIS Pro. You’ll learn how to combine blend modes, hillshade and slope raster functions, and custom color schemes to customize a bathymetry DEM.
Here’s the short version of this tutorial:

And here’s the long version:
Find data
First, find a digital elevation model (DEM). One place where you can download DEMS of the ocean is NOAA’s Bathymetric data viewer. (Read the Learn ArcGIS lesson Find ocean bathymetry data for steps to download this data.)
I downloaded the following DEM: Eastern Canada 3 arc-second Bathymetric Digital Elevation Model. It is a netCDF file, so to add it to ArcGIS Pro, I used the Add Multidemensional Raster Layer option.
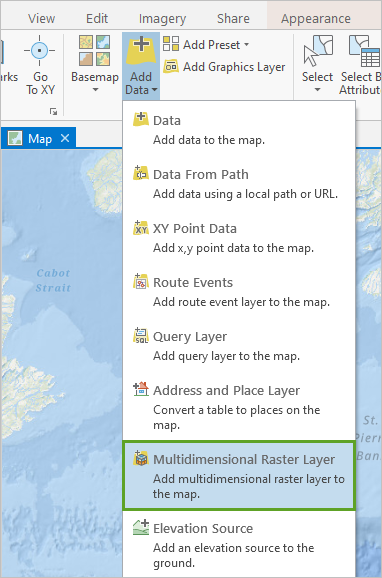
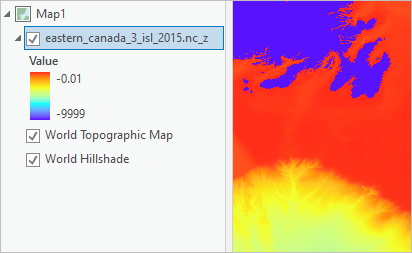
This file is quite large, so it might not appear on the map right away.
NetCDF files don’t have quite the same functionalities as other raster layers, so I converted it into a regular raster layer before doing anything fancy with it.
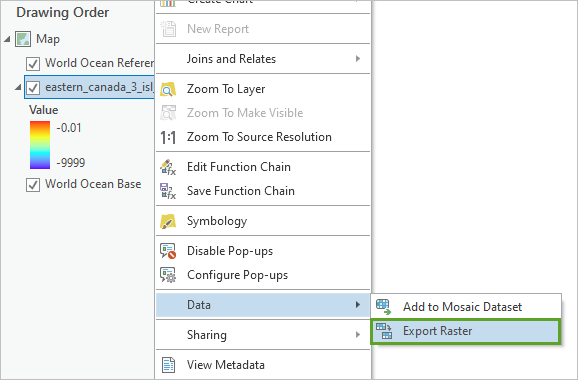
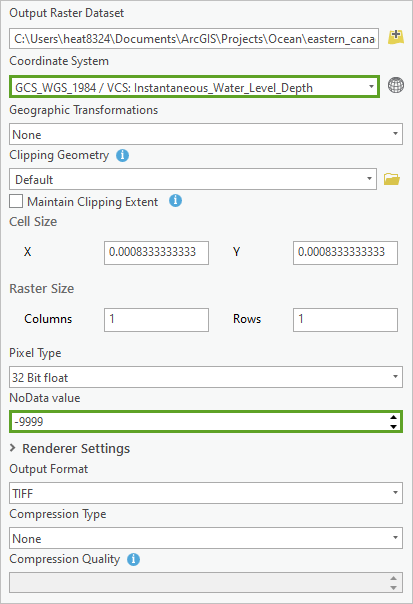
In the Export Raster pane, there’s a few things to take note of:
1. Take note of the Coordinate System. Mine said Unknown. If this happens to you, search for your data’s metadata to find the coordinate system. The metadata for my layer said that the Spatial Reference System was urn:ogc:def:crs:EPSG::4326urn:ogc:def:datum:EPSG::5831.
That long string looks intimidating, but the two EPSG numbers are all you need. These are unique identifier numbers for a geographic coordinate system and a vertical coordinate system.
Search for both EPSG numbers in the coordinate system picker.

2. Also take note of the NoData value. My data has all land areas classified as -9999. This will cause a problem later when I try to make a hillshade. The algorithm will think that land areas are actually extremely deep ocean areas.
To prevent this, in the Export Raster pane, for the NoData value parameter, I typed -9999.
After you run the Export Raster tool, a new .tif raster layer appears on your map.
Symbolize the data
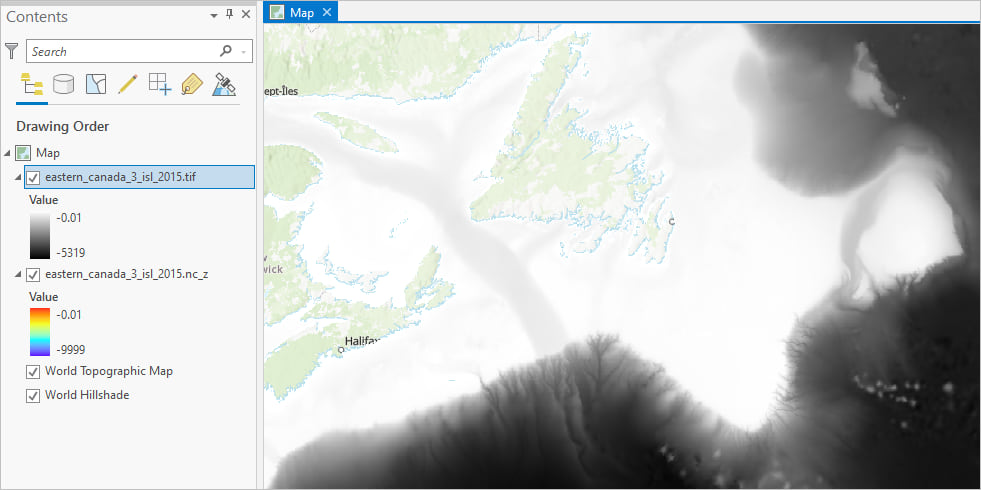
Turn off the .nc_z layer and change the color scheme of the new .tif layer so shallow waters are white and deep waters are black.
Open the Raster Functions pane.

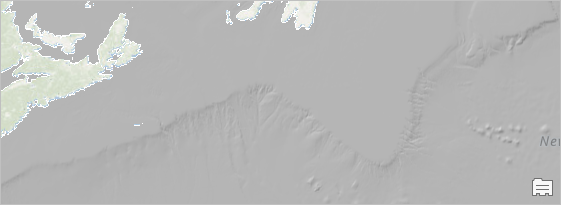
From the Surface group, open the Hillshade raster function.
For Raster, choose your new .tif file. Accept all the default parameters and click Create new layer.
Next, run the Slope raster function on the .tif elevation layer (not the hillshade layer). Accept all the default parameters and click Create new layer.
Choose the Cyan to Purple color scheme for the slope layer.
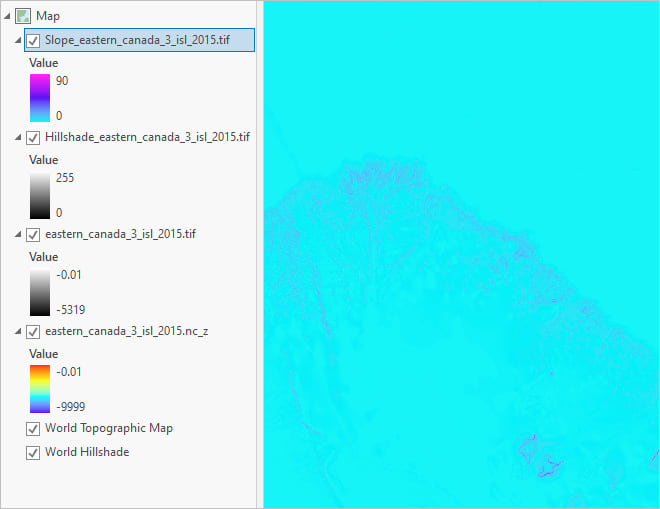
On the ribbon, on the Appearance tab, choose the Overlay blend mode for the slope layer and the hillshade layer. This allows you to see the DEM, hillshade, and slope information all at the same time, since they are all blended together.

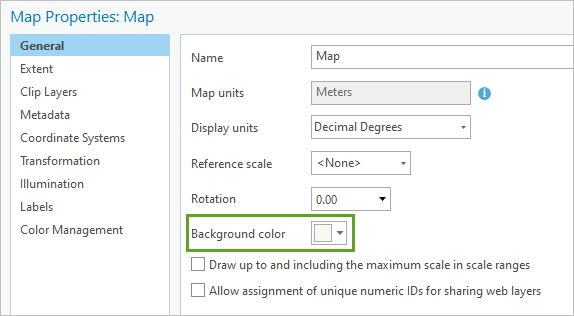
Next, you’ll symbolize the land. You don’t need to add a land layer to accomplish this. Turn off the basemap. In the Contents pane, double-click Map to open the Map Properties window. On the General tab, change the map’s Background color to a pale beige, for example #F9F9F1.
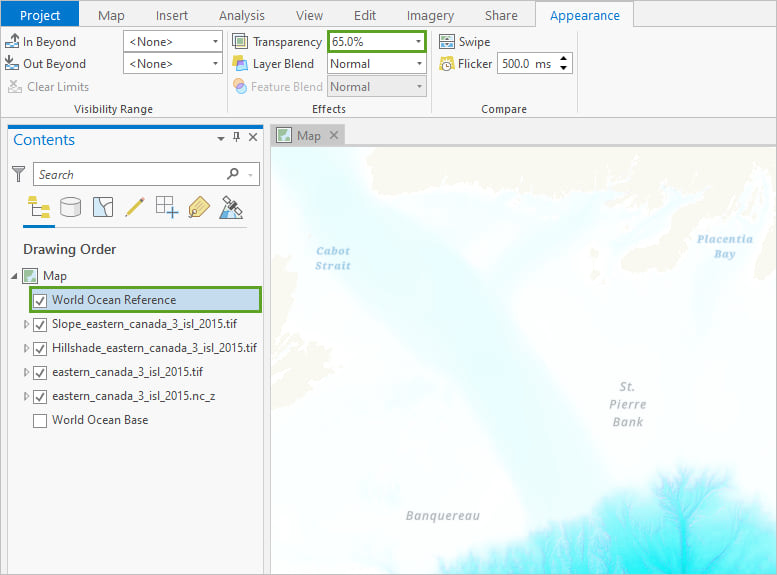
Next, you’ll add some layers. Change thebasemap to Oceans. Turn off the World Ocean Base layer. Make the World Ocean Reference layer semitransparent so it doesn’t overwhelm the map. I chose 65 percent transparency.
Tweak the symbology
After this, you can tweak things. A color scheme that looks good on one area won’t do justice to another. For this area, I felt that the color scheme wasn’t working yet. The cyan was overpowering the map and there wasn’t enough pink to highlight the steep areas. So I tweaked the color scheme of the slope layer until it looked like this:
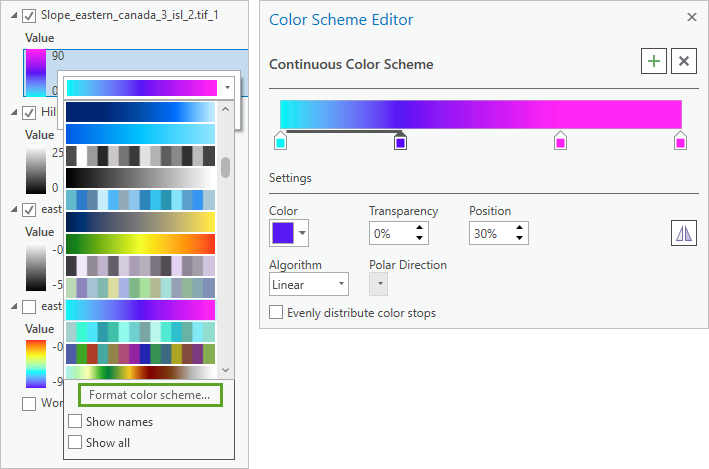
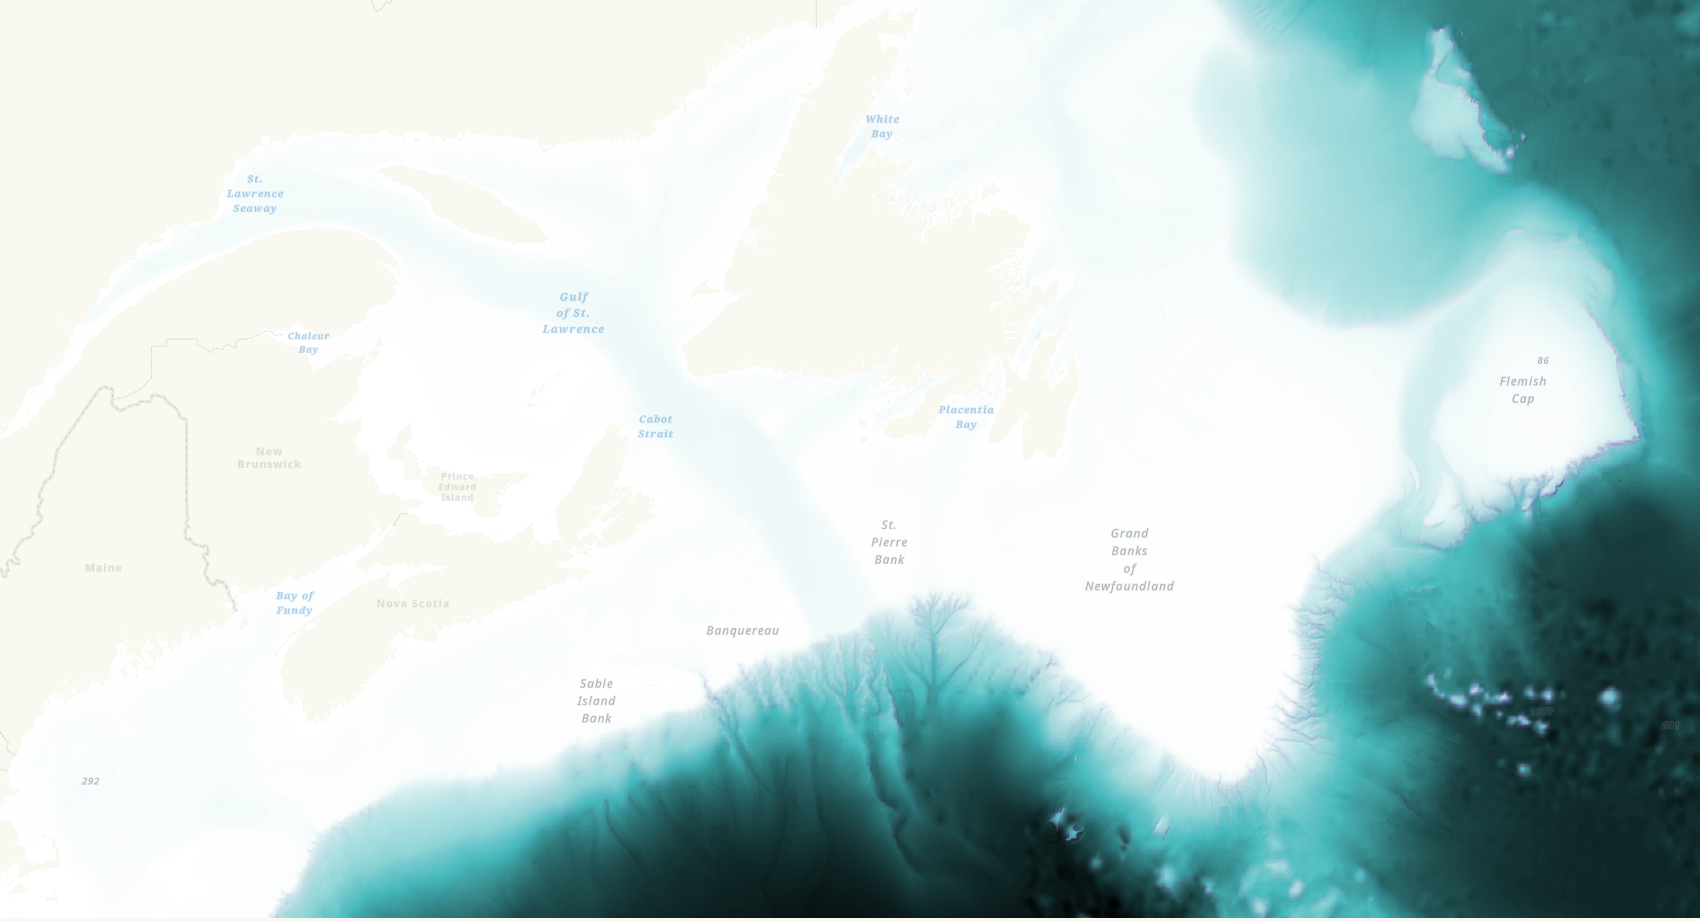
I also changed Transparency of the slope layer to 50 percent and the Layer Blend to Soft Light. This toned the colors down to make a more muted and less saturated map.
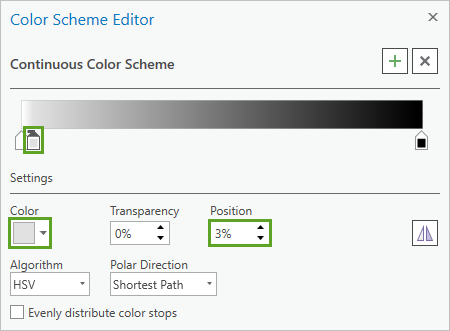
The map is almost done, but I wanted to see more detail in the shallow waters, especially around the coast of Newfoundland. To achieve this, I added a pale grey color stop to the color scheme of the elevation (.tif) layer:
The final map looks like this:
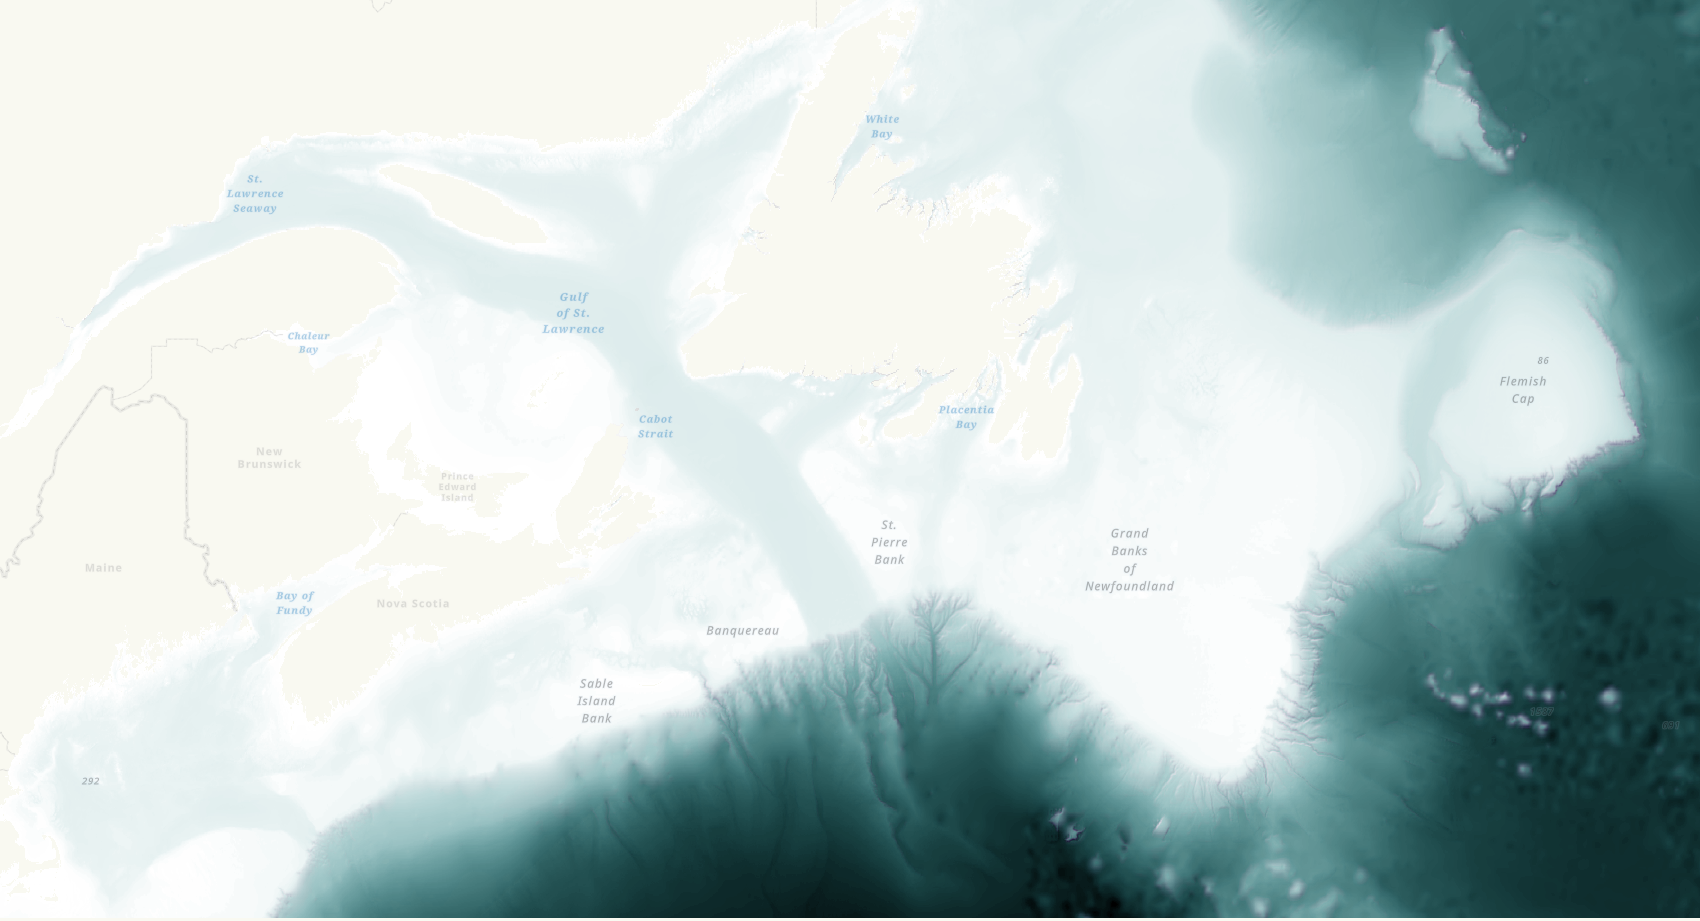
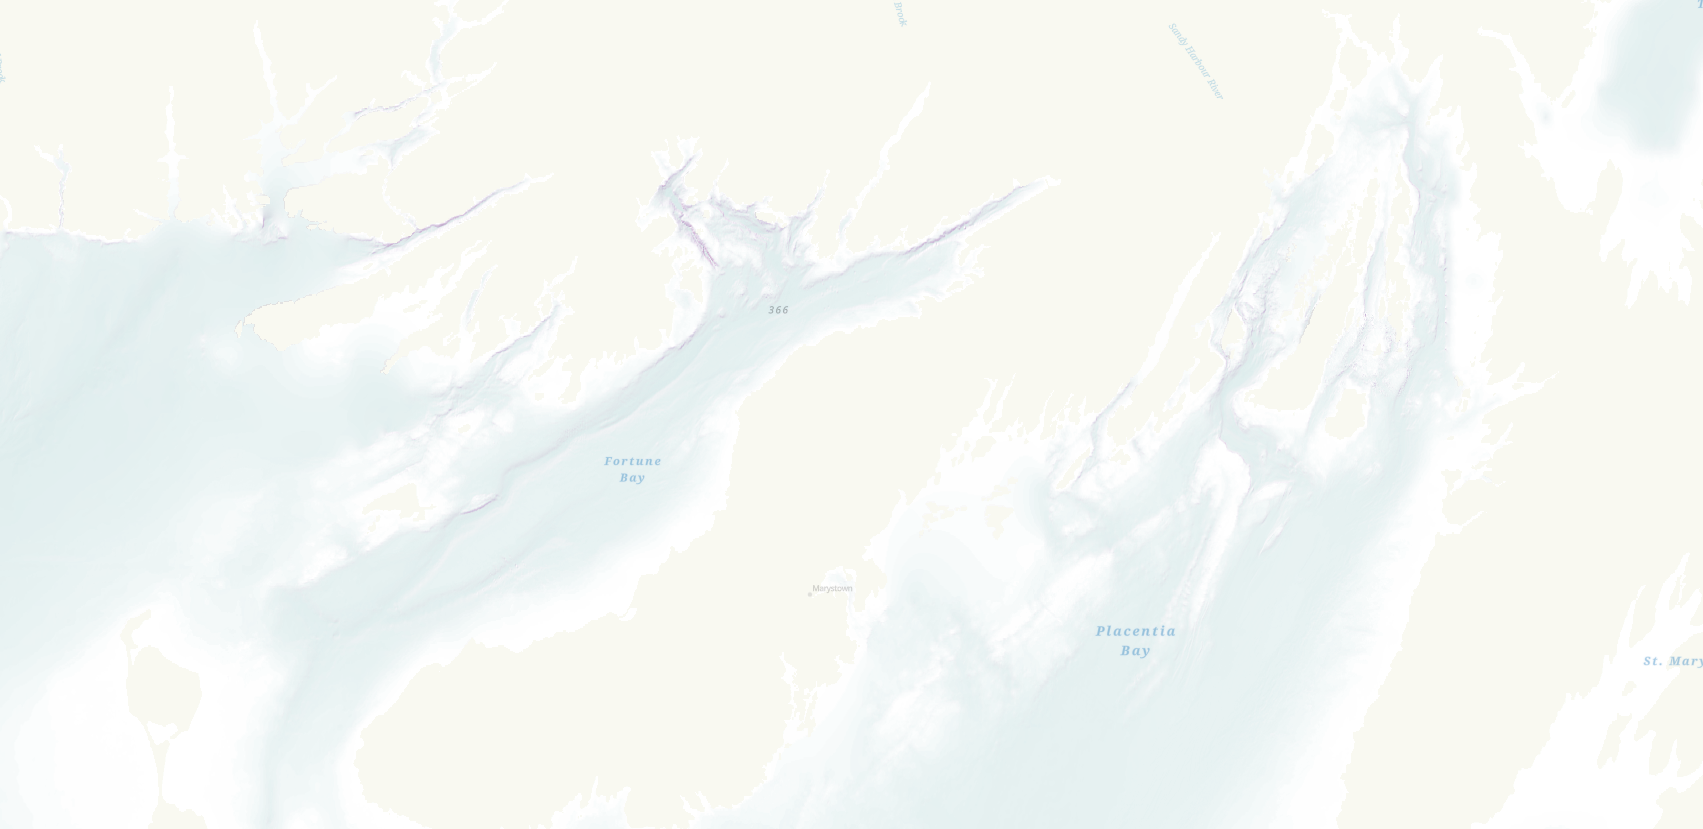
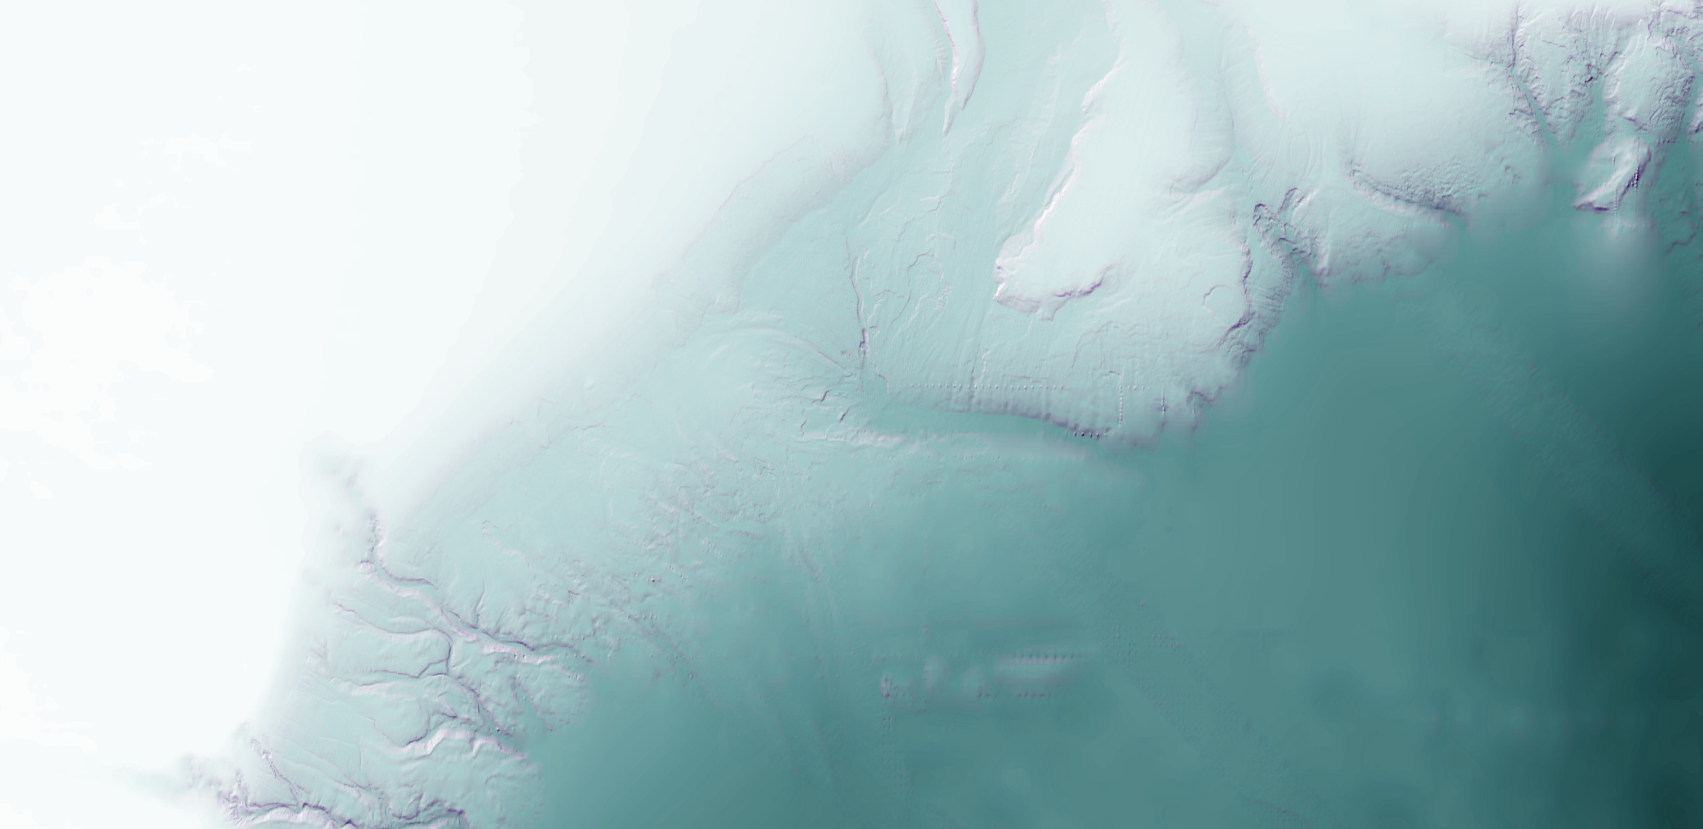
You can download this project package to view my map and explore its properties.
To learn more skills for visualizing ocean bathymetry, try the following tutorials:

Article Discussion: