This post was last updated on October 27th, 2022.
Perhaps you are a designer. Perhaps from time to time you need to design maps. Perhaps you don’t quite have the time right now to learn how to be a full-blown cartographer.
Never fear. All you need is ArcGIS Maps for Adobe Creative Cloud. This is a free extension for Adobe Illustrator or Photoshop that lets you pull geographic data into your design documents.
This product is most often used with vector data in Adobe Illustrator. But it works great for Photoshop, too.

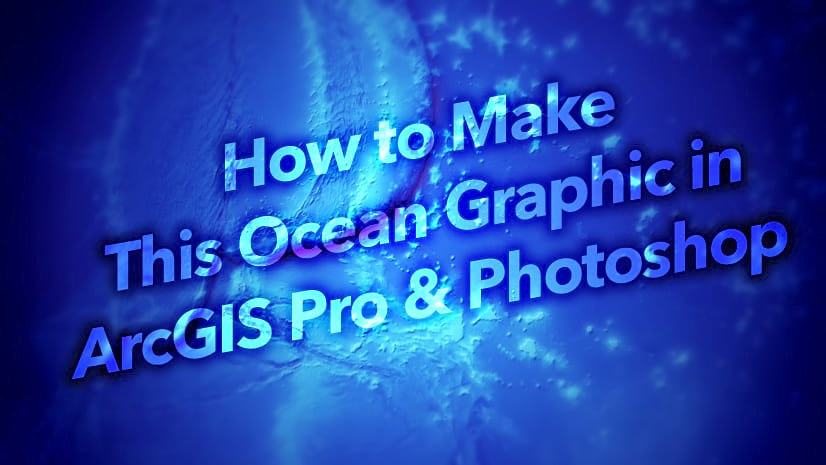
This blog will walk you through creating a map of the ocean’s deepest trenches (the hadopelagic zone) using ArcGIS map data in Adobe Photoshop.
Note: If you want to learn how to complete a similar workflow with this product in Illustrator, check out the lesson Get Started with ArcGIS Maps for Adobe Creative Cloud.
MAKE A MAP
First things first, you need to decide on your artboard size. And because this is a map, that means choosing two important map properties: scale and extent.
1. Download and install the extension.
2. Open Photoshop.
3. From the Window menu, point to Extensions and click ArcGIS Maps for Adobe Creative Cloud.

The Sign In window appears.
4. Sign in with either a Plus, ArcGIS Online, or ArcGIS Enterprise account.
If you don’t have an account, you can sign up for a free trial.
While you may be eager to start mapping, it’s important to first decide on your map’s extent. Here you are forced into making this smart choice up front, thus preventing much frustration and lost time later in your project.
Two windows appear: ArcGIS Maps: Compilation and ArcGIS Maps: Mapboards. One of the windows may be hiding the other.
5. Click the Mapboards window to activate it.
The Mapboards window has a handy yellow banner near the top. Watch this banner to receive hints on what you need to do next.

In this case you have two choices: import an extent from existing data or draw an extent. A map’s extent is the area on the ground that you want the map to cover.
6. Zoom and pan on the map to find your desired extent. I zoomed out to see the whole world.
7. In the Mapboards window, click the Draw button and drag it over the map to declare your mapping area.

The Mapboard Options window appears.
8. Choose Set Level of Detail, and for Preset, choose Continent – High Detail.

Not a cartographer? Level of detail is also called LOD, and in the mapping world it is closely tied to scale. Scale is the relationship between distances on the map and distances on the ground in the real world, and it is often expressed with a scale bar. Scale, extent and artboard size all affect one another. You can’t show twice as much land on the same size paper without also changing the scale. For this reason, the width and height of your artboard size will automatically adjust as you change the LOD. You can think of scale like resolution, but for geography.
The County LOD will give you more detailed data, since it is designed for mapping a smaller area, while the World LOD will give you less. Continent – High Detail will give you more detail than you need, but it’s better to start detailed and downgrade later if you need to.
9. Click OK.
Congratulations—you’ve defined the scale, extent, and artboard size of your map. Next you need to add data.
10. Click the Preview and add content button.
Tip: This button exists in three places. It doesn’t matter which one you click.

The Compilation window appears. This is where you add layers. If the Introducing mapping profiles window appears, click OK.
11. Click Add Content and click Add Layers.

12. In the Add Layers window, there are a few different repositories to choose from. Choose Living Atlas of the World.

13. In the search bar, type bathymetry.
14. Click the TopoBathy tile. A description appears. Click the Full Description link.

This launches the TopoBathy layer’s item page in ArcGIS Online. This layer combines topography (land elevation) with bathymetry (ocean depths).
Optionally, click Open in Map viewer to view and explore this layer on a map. This is a good way to decide if you want to use a layer in your project or not. Just remember that if you are zooming around in the Map Viewer you will see all the LODs (the map will appear more detailed as you zoom in), but only one LOD will be added to your mapboard.
15. Return to the Add Layers window in Photoshop.
16. Click the Add button on the TopoBathy tile and close the Add Layers window.
The Compilation window now shows two layers in the Contents list: WorldElevation/TopoBathy and Topographic, which is a basemap that you get by default. You can also see a preview of the map.
17. Zoom out on the preview map. It is a square.

Not a cartographer? This map is square because it uses the Web Mercator projection. Perhaps you’ve heard that this is a “bad” projection, specifically because it makes Greenland look larger than South America. In fact, it is a useful projection some purposes—just not all. Because the world is round and paper is flat, all projections must distort some aspect of the earth in order to draw it on a piece of paper (or a computer screen). Mercator is not a good choice for maps showing the entire world.
Next, you’ll pick a projection that displays areas equally and also provides largely uninterrupted views of the oceans.
18. Click the gear-shaped Current map settings button at the top.

19. Click the Projection tab. In the search bar, type goode.

20. Select World Goode Homolosine Ocean and click OK.
Now your preview map is shaped like an orange peel. This projection distorts shape to preserve area.

There is an error at the top: “Map layer(s) loaded with an error.” That’s OK. It’s referring to the fact that the basemap can’t be reprojected. You don’t need the basemap, so you can ignore the error.
21. At last, it’s time to create your map project. Click the Sync button.

22. Click OK on the Sync Map dialog box and wait for generation.
Note: If this takes too long, you can return to the Mapboards window, click Modify map and output properties, and choose a different LOD—for example, World – High Detail.
Now you have a Photoshop document named Mapboard.tif.
23. Collapse the ArcGIS Maps windows and open the Layers window. There are layers here for the Esri logo, copyright info, and background (the TopoBathy layer).
ADD MORE LAYERS
It is tempting to add many layers at once. But if you do, they will all be flattened into one. They need to be added one at a time.
1. Reopen the ArcGIS Maps: Compilation window.

2. Click Add Content and Add Layers. This time, in Living Atlas of the World, search for and add TopoBathy Hillshade.

3. Click Close. There are now two layers in the Contents list named WorldElevation/TopoBathy. The bottom one is the layer you’ve already added. It no longer has a download arrow icon next to it since it has already been synced. You can delete it if you like, but you don’t have to. Only layers with download arrow icons will be synced.

4. Click Sync and click OK.
5. Repeat steps 2 through 4 to add two more layers:
- Marine Deep Trenches
- World Continents
6. In the Photoshop Layers window, rename the layers so you can more easily tell which is which.

PHOTOSHOP TIME
I won’t go into too much detail in this section or pretend that I am a Photoshop expert. I’ll just share a few tips and suggestions.
1. Turn off visibility for the marine deep trenches layer and select the continents layer.
Currently, this layer is covering all the others, when you only want it to cover the continents.
2. From the Select menu, choose Color Range. Click somewhere in the white space of the map and change Fuzziness to 0.

3. Click OK, and on the keyboard, press Delete.
Now you have land without a background.
4. Press Ctrl + D (or Command + D) to deselect and then Ctrl + L (or Command + L) to open the Levels window.
5. Under Output Levels, change 0 to 255 and click OK.

Now the land is white instead of green.
6. Turn off the continents layer and turn on the marine deep trenches layer. Follow the same workflow to remove the white space on the marine deep trenches layer.

7. Press Ctrl + U to access the Hue/Saturation controls and change the color of the trenches.

But it is with the bathymetry layer where you can really have some fun.
Not a cartographer? The bathymetry layer is a kind of DEM, or digital elevation model. This is a raster that stores a different elevation value in every pixel. The brightest pixels are for the highest mountains, and the darkest are for the deepest ocean trenches.
8. Right-click the bathymetry layer and click Duplicate layer. Make a few copies to represent shallow, mid-range, and deep parts of the ocean.
9. Adjust the levels of each bathymetry layer differently.

10. Select one of the bathymetry layers. From the Layer menu, choose New Adjustment Layer > Gradient Map. Click OK.
11. In the Gradient Map Properties window, click the current white-to-black gradient to change and customize it.

You can give each of your bathymetry layers a different gradient. If you want part of a gradient map to be transparent—so a bottom layer shines through—make that part of the gradient black and apply the Screen blend mode to the layer.

12. Finally, add in the hillshade layer on top, with the Multiply blend mode, to give it all a classy texture.

13. Turn on the continents and trenches layers and make some labels. I found the names of the trenches on the Esri World Ocean Basemap and added them to my map manually.

14. Add some text to acknowledge your data sources. You can find this information in the Copyright layer.
You probably want to stop here: a classy-looking map of the ocean’s deepest trenches. But why not add a film grain texture? And while you’re at it, some sea monsters? All the best maps have sea monsters, right?

Okay, so I had a bit too much fun with this map. I was going for a sci-fi book cover theme.

But to keep things balanced between fact and fiction, I brought the map into Illustrator to create a textbook-inspired version as well.

Not a cartographer? Don’t let it stop you from making some fantastic maps.


Commenting is not enabled for this article.