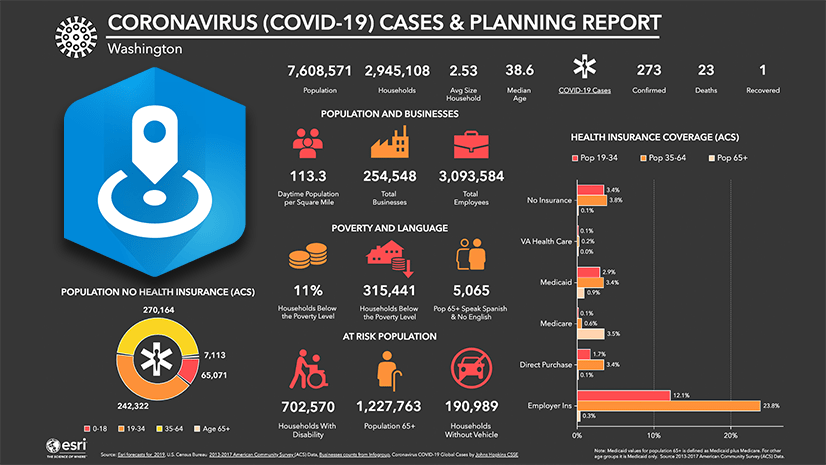
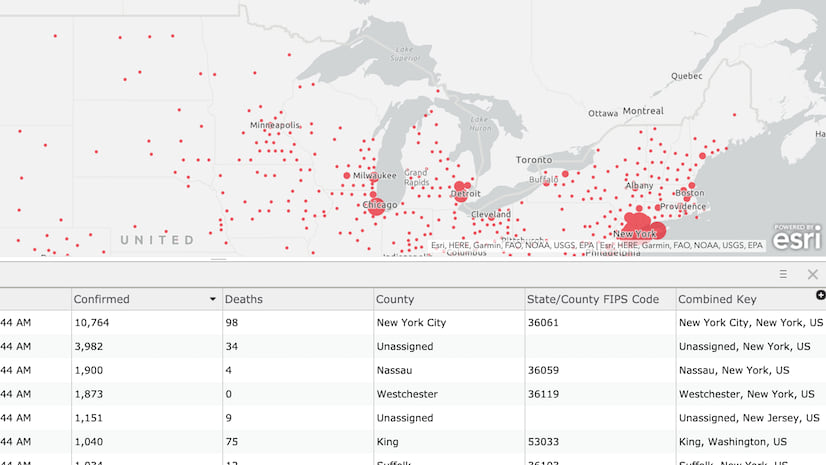
Johns Hopkins University CSSE’s USA county level coronavirus (COVID-19) hourly data is currently available through ArcGIS Online. These are point data representing center points within each county. I was asked the other day (a) how to bring this data into ArcGIS Pro to visualize them per county polygons and (b) how to keep it updated; and if necessary, do further analysis, reporting etc. using the vast capabilities we have in ArcGIS Pro. In response to that question, I decided to write this blog.
At a high level, the process is pretty straight forward:
- Add Johns Hopkins authored feature service into ArcGIS Pro.
- Join that to the US County dataset to retrieve coronavirus case data from the feature service for every map refresh.
- Improve the performance by downloading the data every hour using ArcGIS Pro 2.5 geoprocessing scheduler.
Let’s dive in.
Steps to bring coronavirus data to US county polygon layer:
- Insert a new map or open an existing one
- Add the feature service in a map in ArcGIS Pro
- Make a map or scene in your active view.
- On the Map tab, in the Layer group, in the Add Data menu, click Data From Path.
- Type the following URL.
https://services1.arcgis.com/0MSEUqKaxRlEPj5g/arcgis/rest/services/ncov_cases_US/FeatureServer/0 - Click Add.
- Rename the layer Coronavirus Cases.
- Add your county layer from your geodatabase
You can download it from here if you don’t have your own dataset, and store it in a file geodatabase.
Note: county polygons are in an equal area projection. - Rename it US Counties.
- Join Cases layer to the county layer
- Select US Counties layer from the Content pane.
- Under Feature Layer, on the Data tab, in the Relationship group, in the Join menu, click Add Join.
- Fill in the geoprocessing tool using the values from the table below:
Layer Name or Table View: US Counties
Input Join Field: FIPS
Join Table: Coronavirus Cases
Output Join Field: State/County FIPS Code - Click Run.
- Optional: You can remove the Coronavirus Cases layer
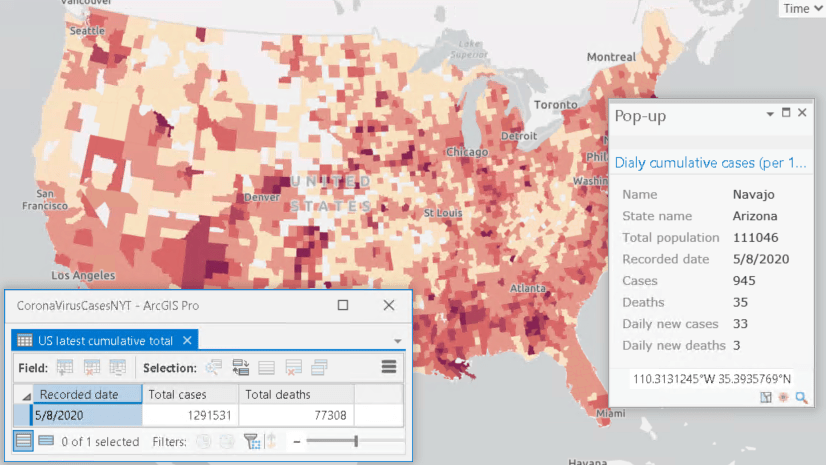
- Open US Counties layer’s attribute table window or click on a county to open its attributes in a popup window.
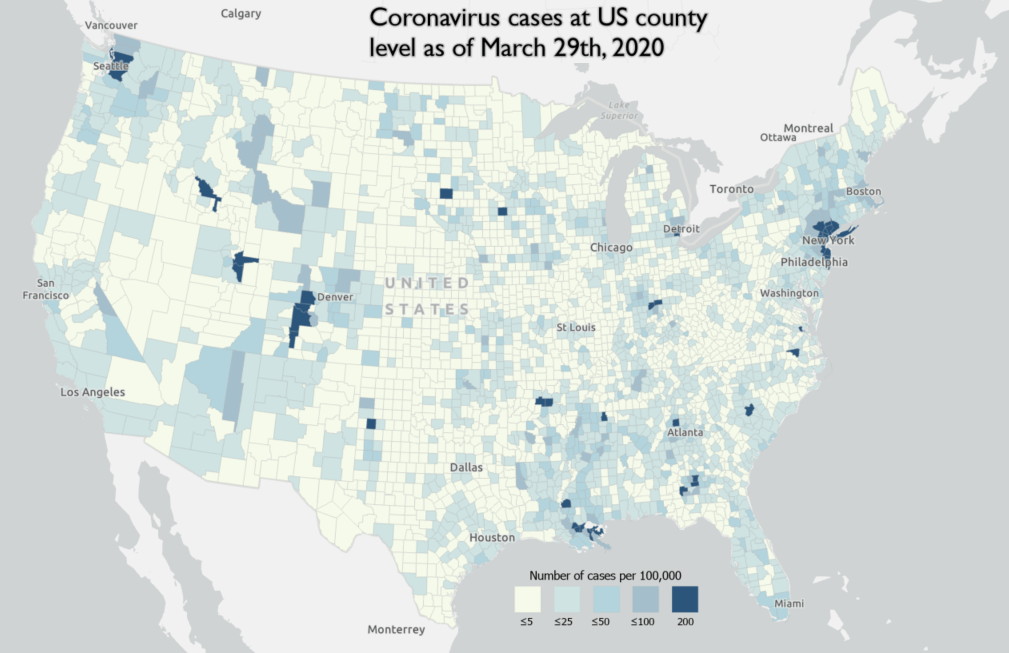
You will see county features are populated with coronavirus cases data such as Confirmed, Recovered, Deaths, Last Update etc. - Symbolize US Counties layer appropriately.
Note: see Ken Field’s blog post on how to map coronavirus responsibly. I used the color ramp he used in the blog. - Since the join is dynamic in nature, every time your map refreshes, it draws with the latest updates from the feature service.
Problems with this approach
There are basically three problems with this approach:
- Performance: Every time the layer redraws, it pulls data from the feature service. These additional calls made over the internet cause the map to draw slower than expected depending on your internet speed and loads on the server hosting the feature service.
- Unnecessary downloads: Since data gets updated every hour, it is unnecessary to make calls to retrieve the same data from an ArcGIS Online server in between.
- Reliability: In case you have internet outage or network issues, your map won’t draw anything.
Solution (part 1): download data to your local geodatabase
- Open Feature Class to Feature Class geoprocessing tool.
- Use Coronavirus Cases layer as Input Features.
- Set Output Location to the same database where you have your US County dataset.
- Click Run.
- Once it finishes successfully, follow steps from above to join this local version of coronavirus cases with your US county layer.
- Since both datasets are stored in the same geodatabase, join happens at the database level and performance is much better than joins occurring at application level.
Solution (part 2): keep it updated every hour
It is great that at this point, you got your data copied in your local geodatabase and you should see pretty fast drawing. But how do you keep your data updated? Luckily, ArcGIS Pro 2.5 allows geoprocessing tools to be scheduled to run at a later time or with recurrence.
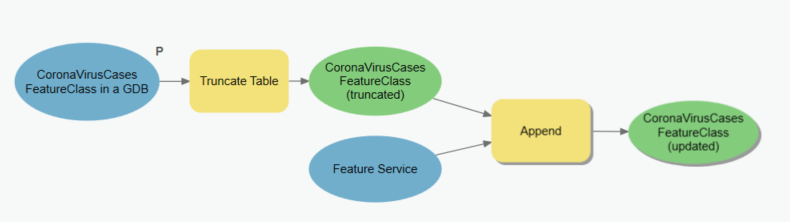
Since Feature Class to Feature Class or Copy Features geoprocessing tool overwrites existing (or creates new) feature class, running one of these tools in the scheduler will fail as existing feature class gets locked while being used. For this reason, instead of overwriting an existing feature class, we will delete all rows for coronavirus cases using Truncate Table tool, and populate new ones from the feature service using Append tool.
- Open Truncate Table tool
- Select the coronavirus case dataset/layer you downloaded in the previous section
Note: use the one that is stored in your machine (or within your network), not the one that points to the feature service - Instead of clicking on Run, click on the arrow button next to it to bring up a split menu and select Schedule to run it every hour.

- Open Append tool
- Copy/paste the feature service URL, from the very first section, in the Input Datasets.
- Select the coronavirus case dataset you downloaded in the previous section as the Target Dataset.
- Repeat step#3 to run this every hour, maybe a few seconds after Truncate Table tool runs.
Instead of running them separately, you can include both of these tools in a geoprocessing model to run them in sync, and schedule the model to run every hour.
You can download the model that I used from here.
https://www.arcgis.com/home/item.html?id=2d8173094b604f9b83c765ac6c98b3a4
I hope you have found this helpful in some way, and stay safe and healthy.
I’d like to thank James Portolese @ CBRE EA whose question led me write this blog.


Article Discussion: