ArcGIS Business Analyst helps you make smarter decisions for market planning, site selection, and customer segmentation. You can use ArcGIS Business Analyst Web App to help you identify under-performing markets, pinpoint the right growth sites, and find where your target audience is located through our web platform or mobile app.
In this article, we will cover the exciting new features and updates in the November 2022 release of ArcGIS Business Analyst Web App, ArcGIS Business Analyst Mobile App, and ArcGIS Community Analyst. You can start using these updates and enhancements today!
Don’t have ArcGIS Business Analyst Web App? No worries, just sign up for a 21-day free trial right now.
Here are the new features in the November 2022 release:
- Understand your community with a new infographic template
- New Demographic and Income Profile report
- New enhancements to infographics
- Five new 2022 Canadian infographic templates
- Data updates you’ve all been waiting for
Understand your community with our new infographic
Have you ever looked around you and wondered, I wish I knew more about this community? With the new “What’s in My Community” infographic, you can easily identify nearby places in your neighborhood that are grouped into civic themes such as lifestyle, enjoyment, access, recreation, community, and learning.

New Demographic and Income Profile report
ArcGIS Business Analyst reports are frequently improved to provide more context and better design. With a new interactive experience, our Demographic and Income Profile report will provide important information such as key indicators and trends in population, household income, and more. To interact with the report in a more effective way, select the Explore for more options. Once you’re done, export the report in a PDF, image, dynamic HTML, or Excel format.
Ready to use this report today? Start off by selecting the Reports tab > Build Reports > Build infographics > Add template > Browse gallery > Demographic and Income Profile (Esri 2022).

New enhancements to infographics
We made some exciting enhancements to our infographics. This includes the following:
Batch exporting of static maps
When batch exporting infographics to Dynamic HTML, sharing to ArcGIS Dashboards, or ArcGIS StoryMaps, you will have an option to create static maps (Images) for infographic templates that contain interactive map elements.
Previously this option was only available when running and exporting infographics to Dynamic HTML one at a time. Users requested the same capability for batch export so when a private or secured feature service layer was included in the map, viewers are not required to sign in when accessing the exported HTML.
Check the option in Preferences to export static maps when running infographics in the application and when batch exporting. Enabling the export maps as static maps also means that when exporting infographics in dashboards and story maps, the included map will be a static image.
Increase to the number of Nearby locations
Based on user feedback, we have increased the maximum number of Nearby locations to 5,000! You can set the maximum number up to 5,000 locations by opening the app preferences. Expand the Reports section, expand the Overall Settings section, and click Nearby Locations. You can then enter maximum number of Nearby locations to display in reports and infographics.
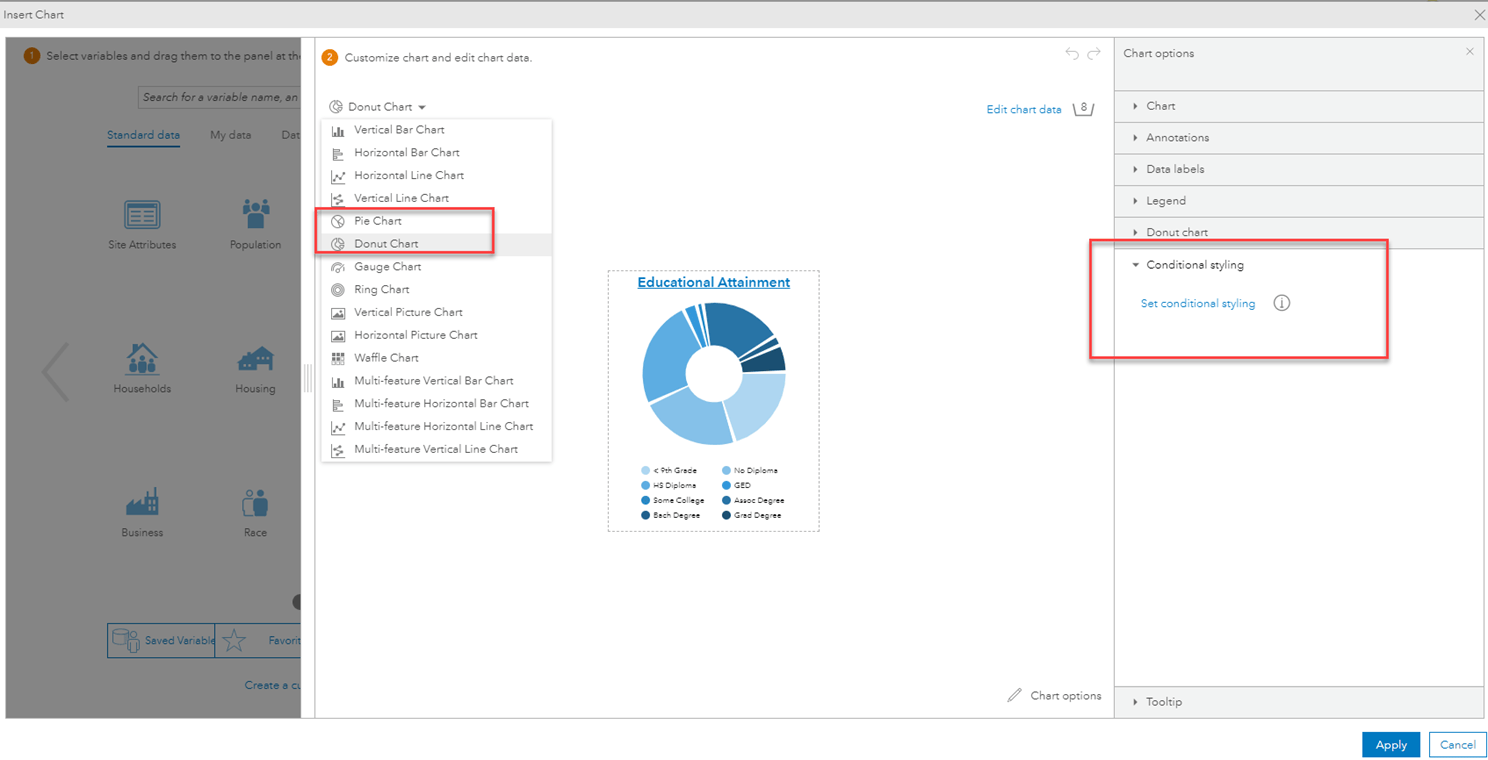
New conditional styling options
You can now apply conditional styling for pie and donut charts. This allows you to display different chart colors based on the values or ranges you set. When creating an infographic, select the variables and drag them to your desired pie or donut chart panel. To apply conditional styling, click on the bottom right corner Chart options button and select Conditional styling.
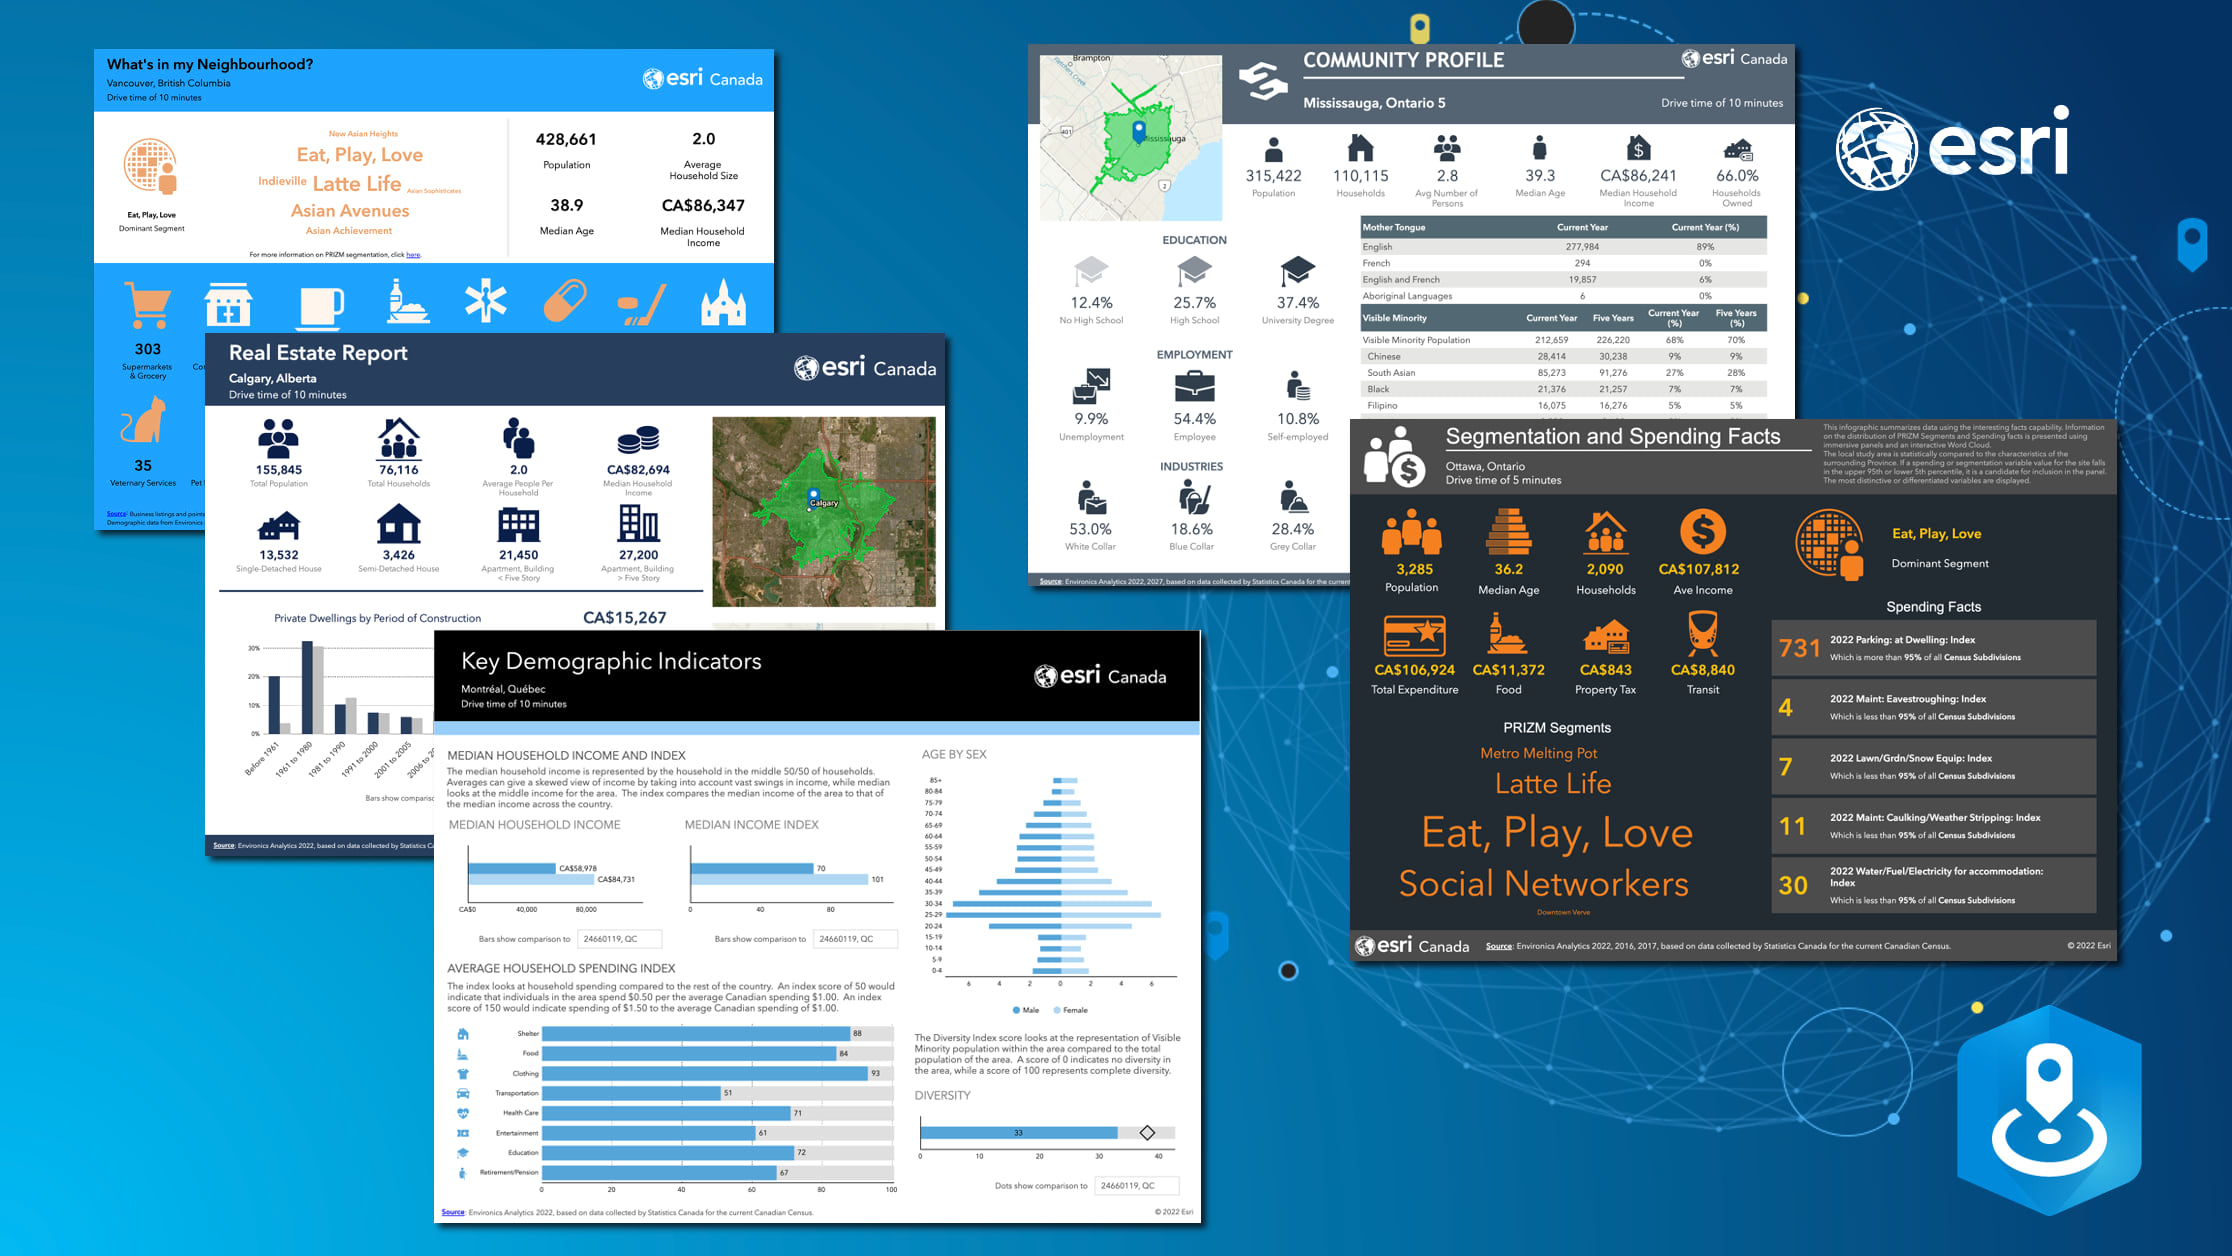
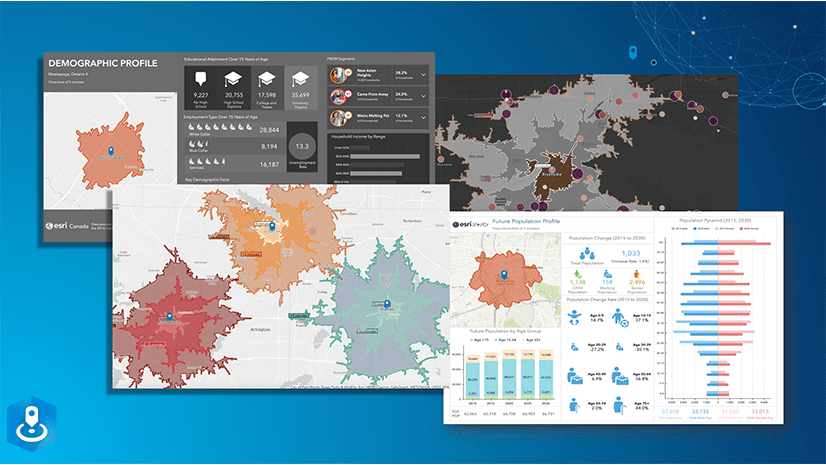
Five new 2022 Canadian infographic templates
We’ve added five new infographic templates for you to use when you analyze within Canada. Yes, you heard that right, five! These new infographics will help you gain insight about your community, demographic details, real estate, spending, and more! These new infographics are:
- Community Profile
- Key Demographic Indicators
- Real Estate
- Segmentation and Spending Facts
- What’s in My Neighborhood?
Data updates you’ve all been waiting for
The following data updates are available for ArcGIS Business Analyst Web App, ArcGIS Business Analyst Mobile App, ArcGIS Business Analyst Pro (via Online data), and ArcGIS Community Analyst. To learn more about the data updates, read our blog article that takes a deeper dive into each datasets.
2022 Canadian demographic data
(Data Partner: Environics Analytics)
The annual data update for Canadian Demographics is here! Demographic data captures the most accurate current-year estimate and five-year projections, helping you make smarter decisions. With this data update, you gain access to Canadian Demographic estimates and projections, CensusPlus, Daytime Population, Household Spending, Market Segmentation (PRIZM), and Demographic Trends.
Please note – the local 2022 Canada data for use with ArcGIS Business Analyst Pro will be available for download on My Esri shortly after the November 2022 online release.
Business location data for the U.S.
(Data Partner: Data Axle and SafeGraph)
This quarterly data update provides insight into over 5 million places and businesses across the U.S. With this data, gain information on name and location, franchise code, industrial classification code, number of employees, sales figures, and affiliated brands.
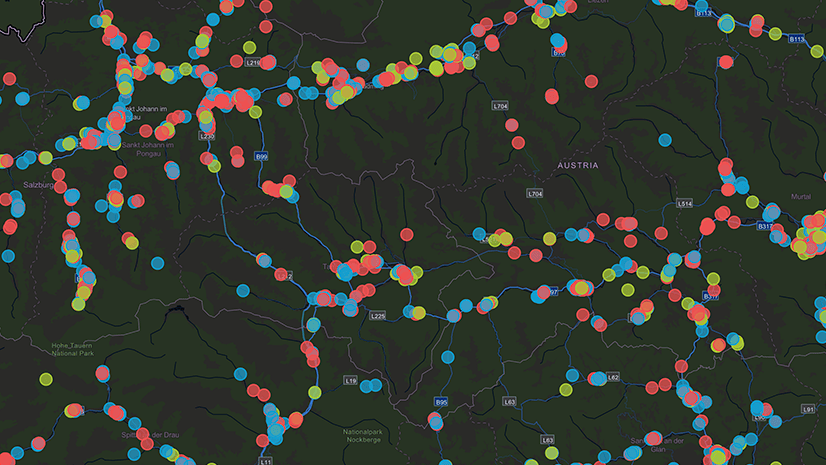
Traffic data points for the U.S.
(Data Partner: Kalibrate)
Leverage this data to see average daily traffic volume, cross street direction, peak and low traffic volume by the number of vehicles, and more across the U.S.! You can use this information for trade analysis, routing, and mathematical models.
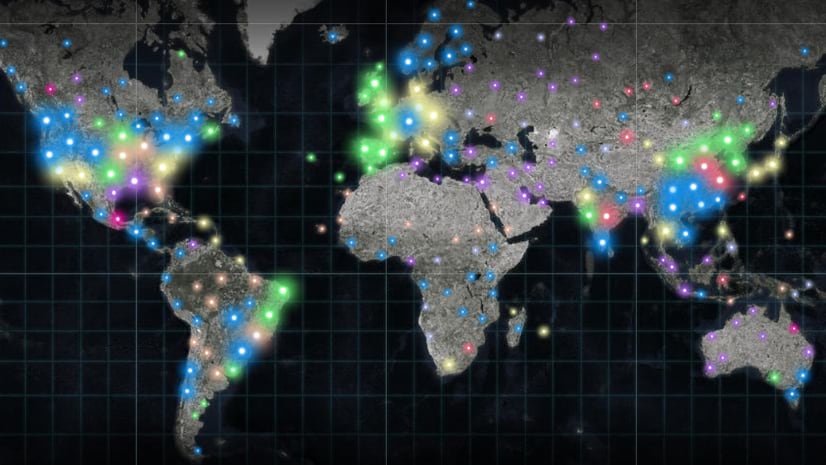
Global Points of Interest
(Data provider: Foursquare)
The official launch for Global Places/Points of Interest data is here! With points of interest (POI) data, you can identify business and community opportunities, plan for future expansion, identify market gaps, and perform competitive analysis. You can use this data to gain this insight for every country with demographic data available – that’s over 150 countries. To learn how to use this data, read our “ArcGIS Business Analyst now includes Points of Interest data from Foursquare” blog article.
Michael Bauer Research data updates for 62 countries and regions
This data update provides global coverage of detailed regional market data and boundaries to help you complete national and international analysis.
Additional Resources
We hope you enjoyed reading through this blog article. Below we’ve added resources to help you with your ArcGIS Business Analyst journey:
- Business Analyst product overview page
- Review pricing and purchase Business Analyst
- Join our LinkedIn Business Analyst User Group
- Join our Business Analyst Esri Community
- Read more Business Analyst blog articles on ArcGIS Blog
- Watch Business Analyst Web App videos
- Watch Business Analyst Mobile App videos
- Visit the Business Analyst Resources page


Article Discussion: