Infographics are presentation-ready data reports that feature interactive capabilities. ArcGIS Business Analyst Web App includes a collection of Standard and Gallery infographic templates. Both Standard and Gallery templates can be used as-is or modified to fit your organization’s custom needs.
In this blog article, we walk through how to modify the Key Facts infographic template for a nonprofit client. The Key Facts template presents key demographic and business data about a site. In this example, modifications include adding relevant fundraising data and changing the template’s theming to customize it specifically for our client.
Open the Key Facts template
First, open the Key Facts template. Click the Reports tab and select Build Infographics. On the Standard templates tab, hover over the Key Facts infographic and click Open.

Replace a preconfigured panel with another panel
Next, replace the preconfigured Business panel, since the comprehensive business data is not as relevant to our nonprofit customer. To replace the Business panel, hover over it and click Replace.

On the Add element menu, click Add panel from another template.

Click the Gallery tab. To filter the infographic templates, type nonprofit in the search field. Use the Non-Profit Community Profile (Esri 2023) template, since it presents crucial fundraising information. Hover over the Non-Profit Community Profile (Esri 2023) template and click Open.
Data regarding the distribution of different charities in the area is relevant to our nonprofit client. Hover over the Charitable Contribution Profile (Index) panel and click Add.
 template.")
The Charitable Contribution Profile (Index) panel is added to the custom Key Facts template.
Replace a preconfigured panel with a table
For the next modification, replace the Education panel with a table using variables related to fundraising potential. Our nonprofit client is interested in how much income people in the area spend on charitable causes.
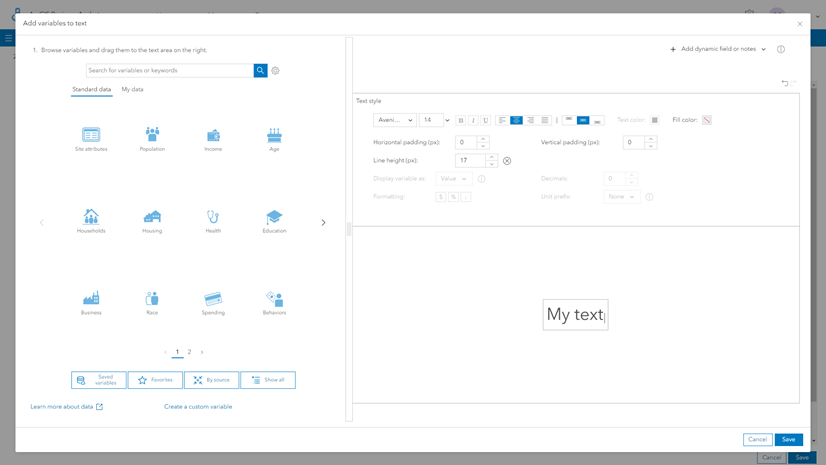
Hover over the Education panel and click Replace. On the Add element menu, click Table and select the Table with variables option. Type cash gifts in the data browser search field. Use the Refine results pane to filter the variables with the following parameters:
- For Year, click 2023 (only).
This shows only the variables with the most recent year’s data. - For Dataset, click Consumer Spending.
This shows only the variables from the Esri Consumer Spending dataset, which is based on the latest Consumer Expenditure Surveys (CEX) from the Bureau of Labor Statistics.
From the filtered results, select the following variables and click Apply:
- 2023 Other Cash Gifts
- 2023 Cash Gifts to Charities
- 2023 Cash Gifts to Educational Institutions
- 2023 Cash Gifts to Political Organizations
- 2023 Cash Gifts to Churches/Religious Organizations
- 2023 Gifts of Stocks/Bonds/Mutual Funds to Non-HH Members
- 2023 Support Payments/Cash Contributions/Gifts in Kind

The table is added to the Key Facts template. To modify the table properties, hover over the table and click Edit. Double-click the table title and modify it to something more meaningful, such as 2023 Charitable Contributions (Consumer Spending), and click Apply.

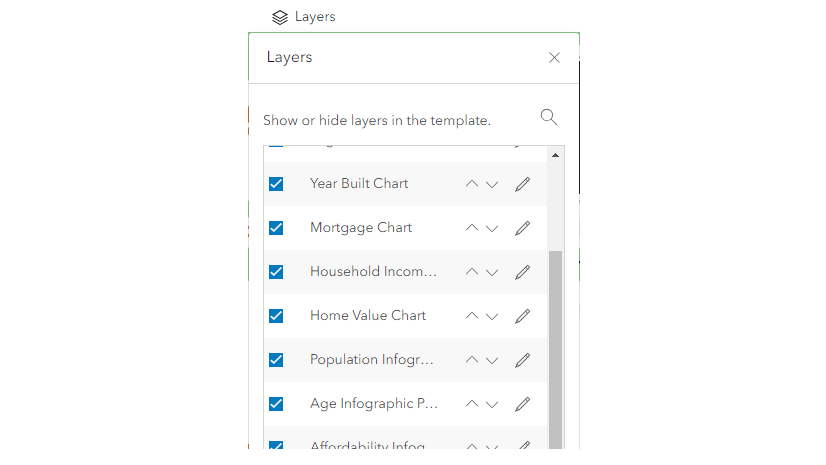
Reorganize the panels
Next, reorganize the panels for better narrative clarity. Hover over the Employment panel and click Move. Drag the Employment panel to the top row of the template. It automatically shifts the existing 2023 Charitable Contributions (Consumer Spending) Table panel down. Repeat this process to move the Income panel and the 2023 Households by income (Esri) panel into the second row.

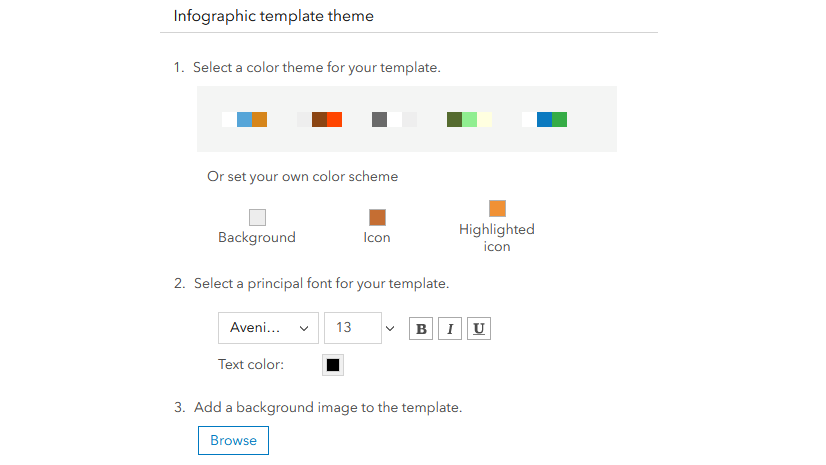
Customize the infographic’s theme
The visual design of the template can be customized to match our client’s theme and branding specifications. To customize the template theme, click Theme. Under Select a color theme for your template, individually set the colors for the background, icons, highlighted icons, and text. Change the background to dark blue, the icon to orange, and the highlighted icon to neon green. Since the background is now darker, change the text color to white for better readability.
Click Save theme and name the theme Nonprofit Organization to save this color scheme for reuse on future custom templates. To update the template, click Apply.

Save the customized infographic
Once you have finished modifying the template, click Save, rename the template to Nonprofit Key Facts, and click Save again. This template is saved under the My templates tab.

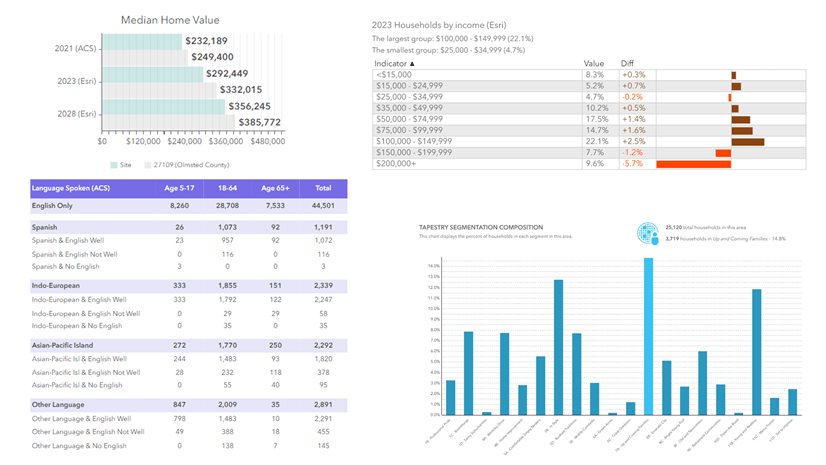
We can present the modified template to our nonprofit client. The modifications customized the template so that the data is more relevant to their analysis needs, providing necessary demographic context for their decision-making.
Learn more about infographics
This blog article has walked through a few ways to customize the Key Facts infographic for a nonprofit client. There are countless more ways to customize infographics from the Standard and Gallery template collections. For more information on infographic design best practices, check out these blog articles:


Article Discussion: