
Short Description: Overview of the Measure Cannibalization tool in the Business Analyst extension for ArcGIS Pro
This is the 3rd blog in an 8-part series that highlights new capabilities in the Business Analyst extension for the 2.5 release of ArcGIS Pro. Other blogs in this series can be viewed here.
In a market where you have multiple stores, understanding where cannibalization occurs is vital as each store is competing for the same customers and revenue.
The latest release of the Business Analyst extension for ArcGIS Pro contains the Measure Cannibalization geoprocessing tool. This tool identifies where trade area boundaries overlap to measure the impact of cannibalization in your market.
This 2-minute video provides a nice overview of this tool:
As the video illustrates, you can use this tool to create a layer of polygons representing trade area overlap. The overlapped areas could signal marketing inefficiencies or in some cases show a positive market saturation. To further assess this cannibalization, an optional report summarizes statistics that show the proportion of overlap between areas.
The images below provide a simple example of how cannibalization statistics are calculated. Two trade areas are displayed below as light green polygons.

The Measure Cannibalization layer is shown in darker green. This represents the area of overlap between the two trade areas.

The statistics are displayed below in the Output Feature Class Attribute Table.
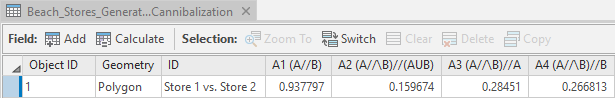
The field definitions are as follows:
- ID – Identifies the Trade Areas being Compared. In this example, Store 1 Trade Area represents ‘A’ and Store 2 Trade Area represents ‘B.’
- A1 – Compares total area of the Trade Areas being compared. In this case, Store 1 Trade Area is 93.7% as large as Store 2 Trade Area.
- A2 – The proportion of the two trade areas that overlap. In this case,15.9% of the Trade Areas’ union overlaps.
- A3 – The proportion of Store 1 Trade Area or ‘A’ that falls within Store 2 Trade Area or ‘B.’ In this example, 28.4% of Store 1 Trade Area lies within Store 2 Trade Area.
- A4 – The proportion of Store 2 Trade area or ‘B’ that fall within Store 1 Trade Area or ‘A.’ In this case, 26.6% of Store 2 Trade Area lies within Store 1 Trade Area.
The Measure Cannibalization report shown below presents these same statistics along with a map of each overlapped area.

Using the Measure Cannibalization Tool
Consider a scenario where you own five Southern California stores with trade areas defined by four-minute drive time polygons. You want to understand where cannibalization occurs, so that you can eliminate marketing redundancy in these areas.

Here is an example of how I used the Measure Cannibalization tool to examine the overlap between the 5-features in the “Drive Time Areas” layer:

The output for this tool captures the areas of overlap, shaded in green below. The associated statistics are displayed in the open Output Feature Class Attribute Table, below the map. The highlighted row compares proportions of area and overlap between Store 2 and Store 3 Trade Areas.
The corresponding areas of overlap are highlighted in the map as well.

The optional Measure Cannibalization report is displayed below.
The report contains a page for each comparison and in this case, the displayed information corresponds to the highlighted row in the table above.

The cannibalization areas in the output can be further analyzed with Business Analyst tools and workflows to model change and identify best course of action. For example, you can use the Enrich Layer tool to understand how many people live in the areas of overlap.
Additional information about these new tools can be found in the ArcGIS Pro documentation for Measure Cannibalization. We’re excited to share this new capability with you. Please reach out and let us know if you have any questions about these two new tools or any other capabilities in ArcGIS Business Analyst.
Email the team: businessanalyst@esri.com
Below you can find some links for Business Analyst that you may find useful.


Article Discussion: