A note from the ArcGIS Business Analyst team:
All of us, together in communities around the world, are doing our best to cope with the impacts of the novel coronavirus and the coronavirus disease 2019 (COVID-19) pandemic. We recognize that these impacts affect our customers and their families as well. Right now, ArcGIS Business Analyst and Esri Data and Location Services are being used to create infographics, web apps and more to share how COVID-19 has impacted every county in the United States and Puerto Rico, state-level COVID-19 cases and demographics, coronavirus planning for vulnerable populations, and countless other examples.
Now, more than ever, the ArcGIS Business Analyst team recognizes that we need to be there for our users, and that includes continuing to improve the product. We’ll be working diligently to deliver you ArcGIS Business Analyst so you can continue to do your work and continue to build infographics and apps that are truly helping communities around the world. We’re here for you if you have questions (businessanalyst@esri.com).
ArcGIS Business Analyst Web App Spring 2020 Release
The March 2020 release of ArcGIS Business Analyst Web App has arrived! This release includes improvements to help you learn how to use key workflows, run infographics for multiple areas, and much more. There are many new features in this release (link at the bottom of this blog), but I’m only going to focus on my three favorites alongside and the data updates.
Here are the Spring 2020 updates that will be highlighted in this blog:
- Guided Tours
- Run Comparison Infographics for Multiple Areas
- View Territory Layers Published in the Business Analyst extension for ArcGIS Pro
- Data Updates
Guided Tours

When we first introduced the ArcGIS Business Analyst Web App, six guided tours were presented to users after they logged in. Since then, we’ve heard from many customers that they were helpful in getting started, but they weren’t enough. You need more. You deserve more.
With this release, we’ve introduced twelve new guided tours for the most popular, requested, and useful workflows in the Business Analyst Web App. Compared to the existing guided tours, the new tours are more visual, contextual, and user-friendly. These tours are a great resource for administrators who are tasked with getting their teams up-to-speed as well as the brand new person that just launched their trial of the Business Analyst Web App. They provide a jumping-off point as well as a way to measure what there still is to learn. Complex or simple, the tours outline the steps needed to use the tools available and can be relaunched at any time.
Alongside these guided tours, we’ve built in an achievement system where you can gain points after completing the tours. These points add up so Business Analyst Web App users can progress from level 1, to level 2, and further to track individual growth. These levels open up a world of possibilities for us that we’re excited to explore in the future.
Run Comparison Infographics for Multiple Areas

I’m one of the people that receive your emails via the businessanalyst@esri.com email alias. Since launching this email, I’ve seen a version of the following question arrive in my email inbox many times:
Is there a way to create multiple infographics for numerous areas all at once?
You’ve created infographics for yourself, your teams, and your organizations. You expressed that you want to run them for multiple areas of interest. You asked. We answered.
With this release, you can now create and run infographics for up to ten sites or areas of interest. Simply run infographics, add your sites, and click the “Create for all sites” link.
View Territory Layers Published in ArcGIS Pro

I’ve heard from multiple users about their desire to access the territory layers they’ve created in the Business Analyst extension for ArcGIS Pro in the Business Analyst Web App. Others have expressed that they want to share those layers with their colleagues who are more comfortable using the Business Analyst Web App.
With this release, ArcGIS Business Analyst Web App users will now be able to open and use the territory layers and boundaries created in ArcGIS Pro.
Data Updates
With this release of ArcGIS Business Analyst Web App, we’ve made updates to the data available both for the United States and many countries around the world. The Spring 2020 release includes data updates for the following:
United States
- ACS for the United States and Puerto Rico (2014-2018)
- Crime (2019)
- Traffic (Q4 2019)
- Business locations and shopping centers (Q1 2020)
Netherlands
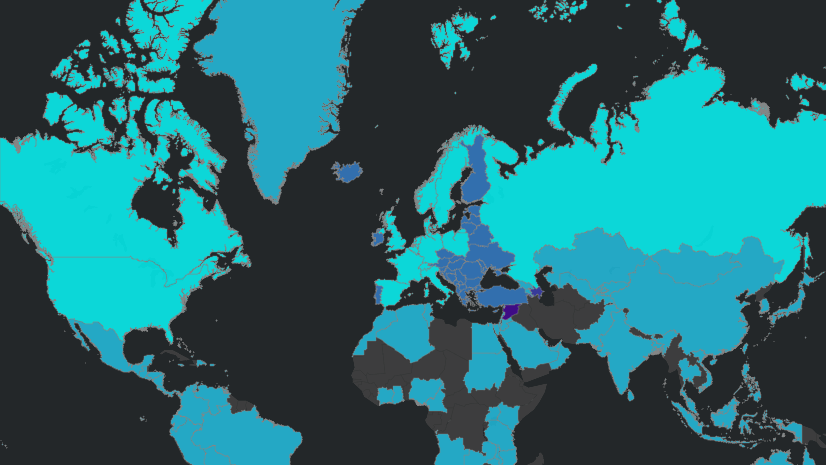
Additionally, there are updates to 21 countries in the Michael Bauer Research dataset. If you’d like to read more about these recent data updates, check out our What’s New in Esri Demographics blog.
Additional Resources
We’re so happy to share the Spring 2020 release of ArcGIS Business Analyst Web App with you. The full list of updates included in the Spring 2020 release of ArcGIS Business Analyst Web App can be found here, but I’ve included some additional links below that you may find useful.
COVID-19 Specific Resources:
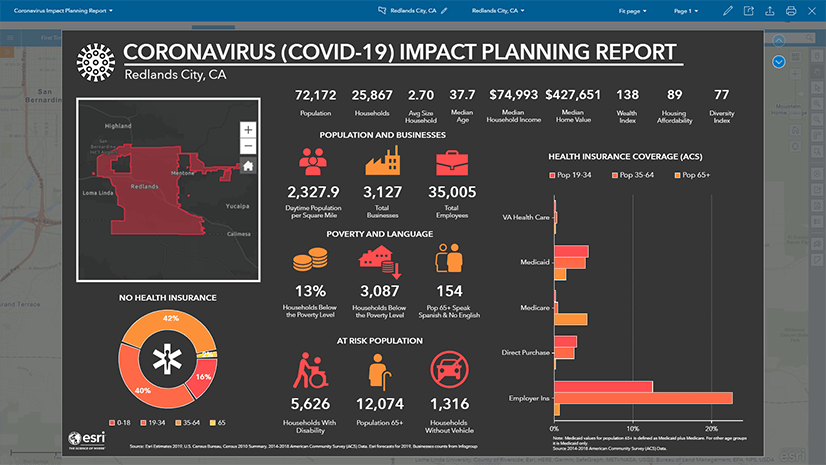
- Impact Planning for COVID-19 – Infographics for every county in the United States – Web App
- State-Level COVID-19 Cases & Demographics – Web App
- Coronavirus Planning for Vulnerable Populations – Web App
- Build Your Own Vulnerable Population Infographic – ArcGIS Blog
- Explore COVID-19 Impact Using Infographics – ArcGIS Blog
ArcGIS Business Analyst Specific Resources:
- Business Analyst product overview page
- Business Analyst resources page
- LinkedIn user group
- Business Analyst YouTube playlist
- GeoNet community
- Business Analyst Web App login page
- Business Analyst help and documentation pages
- What’s New in Business Analyst Web App documentation page
- Email the team: businessanalyst@esri.com


Article Discussion: