2025 was a banner year for ArcGIS Tapestry, Esri’s proprietary market segmentation system. The Tapestry dataset is created by grouping residential areas at the census block group level based on shared demographic, socioeconomic, and lifestyle characteristics. Areas with the most similar characteristics are grouped together, and those showing divergent characteristics are separated.
Not only was the dataset updated in 2025 with fresh, current-year data; the entire system was reconfigured to reflect a more modern approach to geodemographic segmentation. That’s right—a new name, new segments, new LifeMode groups, a snazzy new poster, and even a chic interactive segment dashboard! The full gamut of this historic refresh is outlined in June 2025’s What’s new in Tapestry, an excellent primer for the Tapestry-curious.

This article is the first in a series aimed at diving into the world of ArcGIS Tapestry using ArcGIS Business Analyst Pro, an extension to ArcGIS Pro. In some ways, Business Analyst software is the ideal exploratory tool for this dataset, due to its emphasis on data discovery through a number of unique tools and workflows. This first article presents the basics, including how to access the data, why to use it in Pro, and a simple workflow for getting comfortable with ArcGIS Tapestry in Pro.
How do I access ArcGIS Tapestry data in Business Analyst Pro?
Similar to software like ArcGIS Business Analyst Web App and ArcGIS Online, datasets are available in Business Analyst Pro through online or portal connections. To get up and running with online ArcGIS Tapestry data in Pro, you’ll set the Business Analyst data source to Esri 2025 using the Business Analysis menu. Keep in mind, the new dataset is uniquely available in Esri 2025, so don’t accidentally click Esri 2024!
 data source")
But wait, you might be asking, what about the “special sauce” of Business Analyst Pro—local datasets? For the uninitiated, local datasets are datasets that you purchase and download from Esri, and that are stored on your own machine. After connecting to the dataset, you can use Tapestry data in all the same ways as you would with an online data source, except you won’t be using credits and will see faster performance.
If you purchased and set up the local U.S. 2025 dataset, you’ve got access to ArcGIS Tapestry data and can be up and running with it as soon as you connect to the local data.

Are there differences in capabilities for Tapestry data in Pro versus Business Analyst Web App?
When it comes to Tapestry, there is one central difference in Business Analyst capabilities between Business Analyst Pro and Business Analyst Web App. The powerful target marketing workflow is only available in Business Analyst Pro with access to a U.S. local dataset (or a Canada local dataset with PRIZM data) and offers Esri’s most advanced Tapestry analysis. With Target Marketing, you can build a profile of your current customers using ArcGIS Tapestry segmentation, then compare it to a market area profile to identify your core target segments and map where similar households are concentrated, helping you pinpoint high-potential areas for customer growth!

This ability to use Tapestry for presenting a nuanced portrait of your customers means you can get a granular view of the market landscape. You can find pockets of new customers in your current market, or even apply your customer profile to a whole new market. This fascinating workflow will be the focus of a future article! For now, read on to use ArcGIS Tapestry data in Business Analyst Pro’s color-coded layer workflow to create a county-level map of Tapestry data.
How can I get started using ArcGIS Tapestry data in Business Analyst Pro?
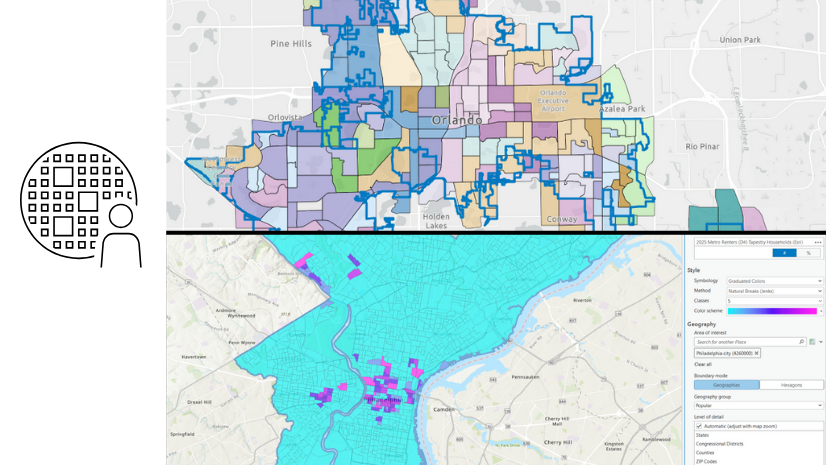
Creating a color-coded layer is one of the most approachable ways of working with ArcGIS Tapestry data in Business Analyst Pro. Color-coded layers can be used to visualize data across geographic areas, allowing you to quickly identify spatial patterns, compare locations, and support site selection or market analysis. By using Tapestry data, you can see who lives where and how neighborhoods differ across a region.
The first step is simply deciding where you want to look. This could be a city, a county, or a custom trade area you’ve created around a store or site using drive times or rings. When creating a color-coded layer, you can use the Area of interest parameter to specify the exact location (or locations) you want to visualize. This helps focus your analysis by showing a boundary around your study area while making it easier to view smaller-scale geographies that may not be visible when zoomed out.

Once you have an area of interest, you’re ready to start layering in Tapestry. Tapestry data is calculated at the block group level, meaning this is the smallest geographic level at which the data is available. This allows you to explore patterns at a neighborhood level. Like building blocks, the base level data is combined, or “aggregated up,” to form larger geographies, such as zip codes and counties.
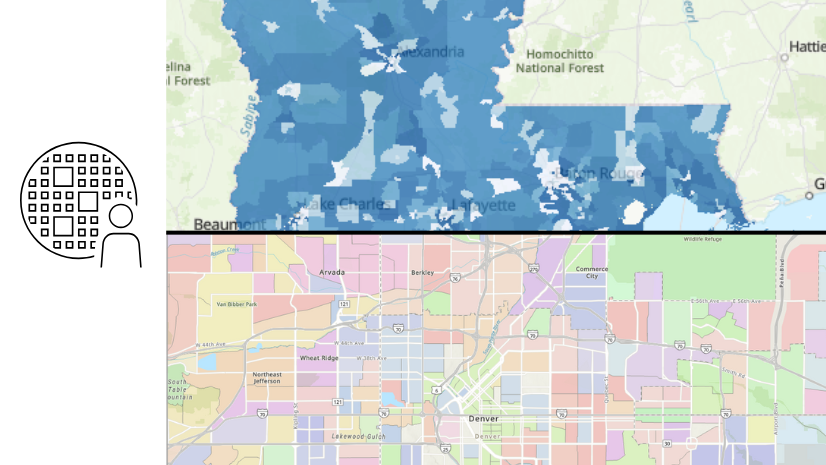
From here, you get to decide how you want to explore the data. You can map the dominant Tapestry segment to get a sense of the primary segment in each neighborhood, or you could focus on the percentage of a specific segment or LifeMode group if you’re targeting a particular audience.
Either way, Business Analyst Pro lets you apply color-coded symbology so patterns jump off the map: different colors for different segments, or darker shades to show higher concentrations.

Once everything is symbolized, you might start noticing clusters of similar neighborhoods, transitions between lifestyle types, and areas that closely match (or don’t match) your ideal customer profile. A few small tweaks, like adjusting the color ramp or classification, can make those patterns even more visible.
To learn more about the segments that make up ArcGIS Tapestry, you can explore the interactive infographic dashboard. You can also access the segment documentation directly from the map: in the Inquiry group, click Infographics, then click any block group (or other geographic unit for which the data is displayed). In the infographics pane, click the dropdown menu next to Templates and select Dominant Tapestry Profile or Tapestry Profile.
 and Tapestry Profile infographic (right).")
In the Dominant Tapestry Profile infographic, click Learn more… below the dominant segment name to view the segment documentation, including a description and key demographic, housing, employment, and lifestyle characteristics. In the Tapestry Profile infographic, click a segment name in the Tapestry panel. In the window that appears, click View segment profile to visit the documentation.
Creating a color-coded layer is a great entry point for getting started using Tapestry in Business Analyst Pro. It turns complex segmentation into something intuitive, visual, and easy to explore, making it a natural fit for site selection, market analysis, and customer profiling workflows.
In the next part of this series, we’ll dive into how you can use Tapestry data as the foundation for performing target marketing.
This article uses the local and online ArcGIS Tapestry dataset from Esri.
This article uses ArcGIS Business Analyst Pro 3.6.
Resources
We hope you’ll explore more capabilities in Business Analyst Pro. To continue your Business Analyst journey, visit the following resources:
- Business Analyst product overview page
- Review pricing and purchase Business Analyst
- Business Analyst resources page
- LinkedIn user group
- Business Analyst Web App video channel
- Business Analyst Pro video channel
- Business Analyst on Esri Community
- Business Analyst Web App login page
- Email the team: businessanalyst@esri.com


Article Discussion: