ArcGIS Hub has emerged as a critical resource for engagement and collaboration during this coronavirus disease 2019 (COVID-19) crisis. Building and running infographics is an important part of the ArcGIS Business Analyst product that helps you create visually compelling outputs of your analysis. Business Analyst users can contribute their curated infographics to hub sites as a way of providing fact-based information and new capabilities to their communities. Many hub sites feature infographics, including examples from ArcGIS Hub’s COVID-19 Sites gallery.
This article explains different ways to export infographics from Business Analyst Web App to ArcGIS Hub sites:
- Export infographics as HTML
- Share infographics via ArcGIS StoryMaps
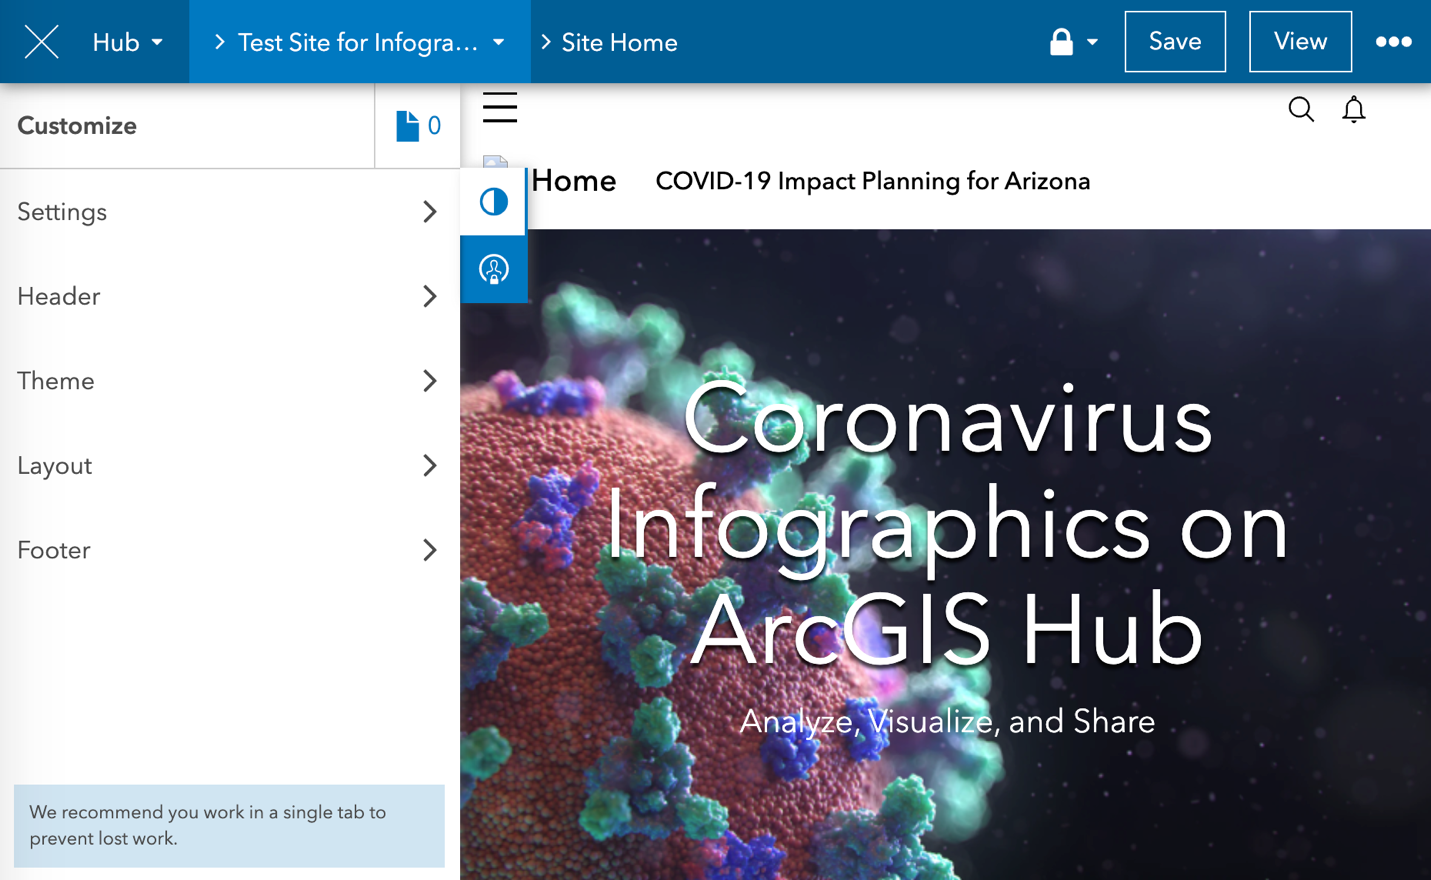
Option 1: Export county-level infographics as HTML
To facilitate exporting an infographic specifically for county-wide COVID-19 support, the Hub team created a widget to help you find your county’s Coronavirus Impact Planning infographic.
- Go to https://esridc.github.io/covid-report/.
- Type in the name of a county under the search input field, and click Start Search.
- Click Embed on top right.
- In the pop-up window, click Copy from the first option, “Copy and paste this URL into the Hub iFrame Card.”
- Go to the App Launcher and launch ArcGIS Hub.
- Create a new, or select an existing, hub site where you want to add the infographic’s URL.
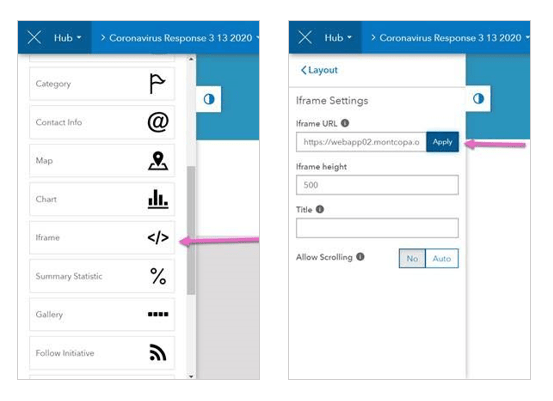
- Within ArcGIS Hub edit mode, go to Layout > Iframe > drag and drop the iframe card to a location where you want the infographic to appear on your site.
- Under the iframe settings dialog, paste in the URL of your county’s infographic in the iframe URL field.
- Click Apply. You should see the infographic appear where you placed the iframe card.
- Click Save on the main menu in the top right corner.
Option 2: Share infographics via ArcGIS StoryMaps
Using ArcGIS Business Analyst, you can add infographics within ArcGIS StoryMaps. In ArcGIS Hub, stories can be embedded into hub sites, linked in galleries and image cards, or used in site header links.
To add infographics to a site header link:
- In ArcGIS Business Analyst, create an infographic of your site. (You can follow the steps shown in this video to create an infographic.)
- Then use ArcGIS StoryMaps to create a story containing infographics you want to share on your hub site. (Detailed steps on adding infographics to stories are outlined in this blog article.)
- Go to your App Launcher to launch ArcGIS Hub.
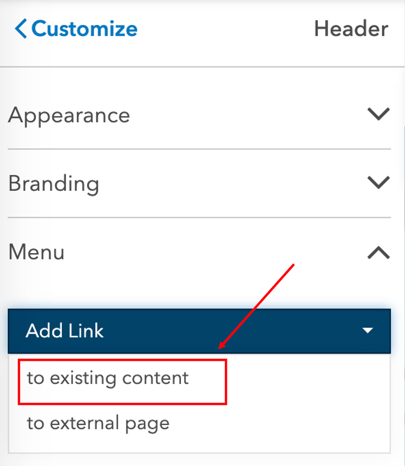
- In ArcGIS Hub edit mode, click Header > Menu > Add Link > to existing content.
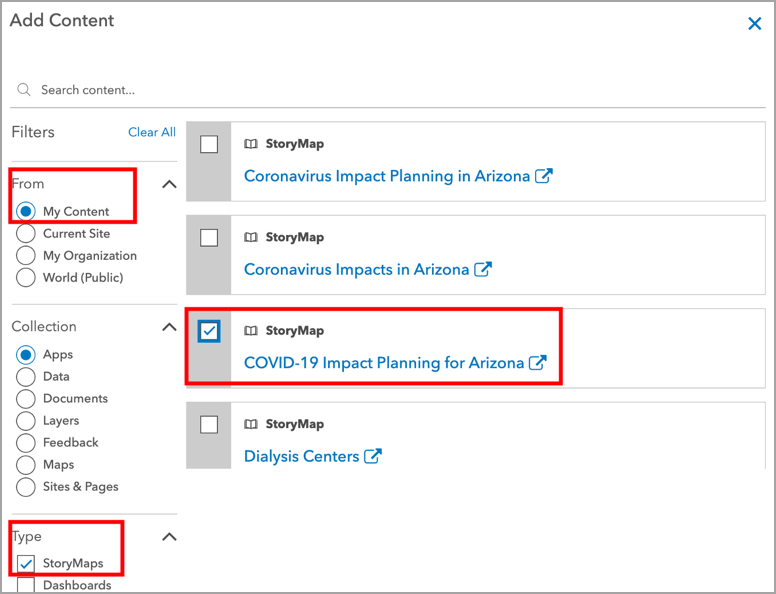
- Use the filter or search for the name of the story containing the infographics.
- Check the box next to the appropriate story and click Select at the bottom of the dialog.
- You should now see the new link in the header of your site. When clicked, the link will launch the story containing the infographic.
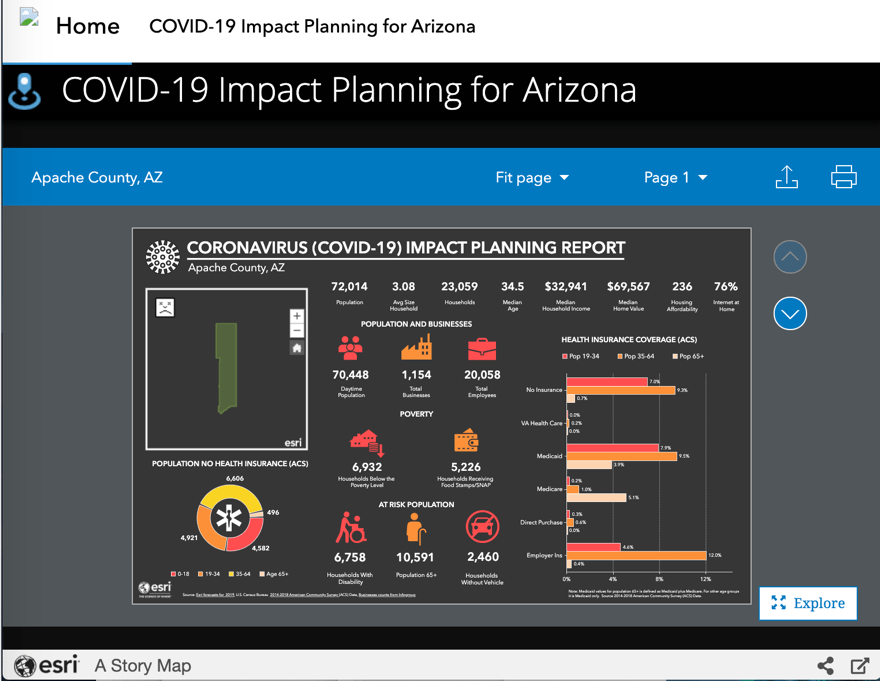
To embed infographics in a Hub site:
- Follow steps 1-3 above for creating infographics, a corresponding story, and opening ArcGIS Hub.
- Add a subtitle at the top of your story, instructing your readers to scroll down to view the infographics.
- In ArcGIS Hub edit mode, add an iframe card to your site. Paste the link to your story in Iframe URL. Toggle Allow Scrolling to Auto. Click Save.
We hope you found this content helpful in sharing your infographics and planning for your community. As always, please do not hesitate to contact the ArcGIS Business Analyst team at businessanalyst@esri.com or the ArcGIS Hub team on GeoNet.
ArcGIS Business Analyst-specific resources
- Business Analyst product overview page
- Business Analyst resources page
- LinkedIn user group
- Business Analyst YouTube playlist
- GeoNet community
- Business Analyst Web App login page
- Business Analyst help and documentation pages
- What’s New in Business Analyst Web App documentation page
- Email the team: businessanalyst@esri.com


Article Discussion: