Esri data is organized into groups of variables or statistical measurements connected by a common theme, such as spending behavior or demographic information. Understanding these different groups of data can help you locate what’s pertinent to your work and can lead you to discover data you didn’t even know you needed. This article is part of the blog series Got five minutes? Get to know… and outlines the most important details about Market Potential data.
- What is it?
- What’s in it?
- What can I do with it?
- Where does it come from?
- Does it change?
- How is it different from other data?
- Where is it?
What is Esri Market Potential data?
Esri Market Potential data provides insight into how people spend their time and money, what they value, and how these behaviors vary geographically. It is updated every year to capture the latest changes in the marketplace and ever-evolving consumer patterns.
What will I find in the Market Potential dataset?
Market Potential data includes two key consumer indicators:
The estimate: This tells us how many people in an area are expected to buy things, do things, or have certain opinions. The estimate answers questions such as “How many adults in my area buy groceries online?” or “How many adults in this area strongly agree that they struggle with health care costs?” It gives us an idea of expected consumer demand or attitudes in an area.
The index: This tells us how the estimate compares to the whole country. We call it the Market Potential Index, or MPI. The MPI can answer questions such as “Are people in my area more or less likely to shop for fashion online than the national average?”
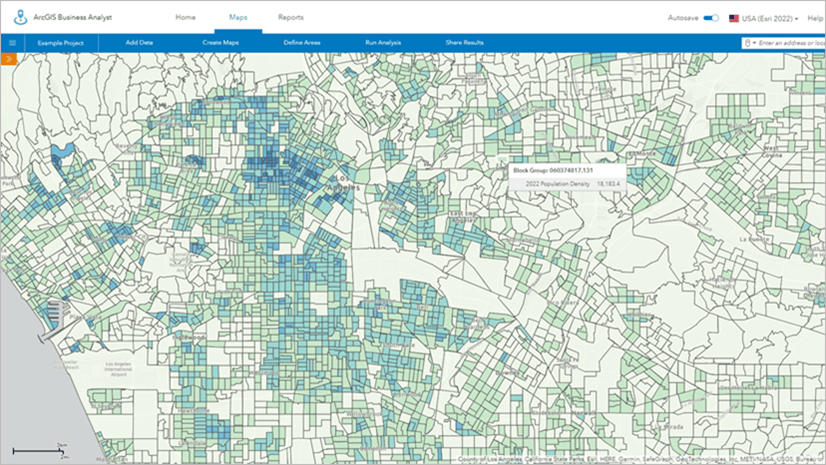
Business Analyst will also display Market Potential as a percentage of adults or households in your area of interest. An example from Business Analyst Web App showing percent of adults following charitable groups on social media can be seen below:

What can I do with Market Potential variables?
Market Potential data can be used by anyone seeking to better understand their audience or customers. For example, the data may be valuable to businesses that are strategizing ad placement or evaluating potential new locations. It can also be used to explore consumer attitudes about healthcare, civic involvement, environmental issues, finances, and much more.
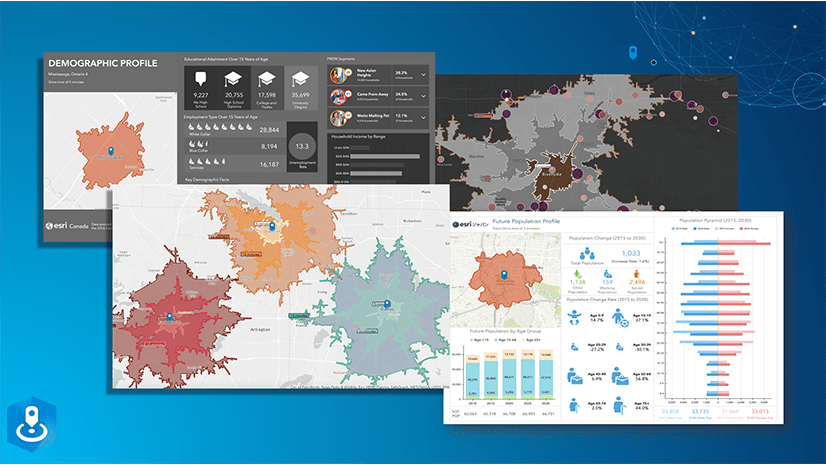
For an in-depth example of how Market Potential data can be used, take a look at the story How to use and interpret Esri’s U.S. Market Potential data. This story shows how someone could utilize Market Potential data in Business Analyst to find the best location for a new electric vehicle charging station.
Where does Market Potential data come from?
Market Potential data utilizes consumer survey information from MRI-Simmons, a recognized industry leader in consumer research and insights, and Esri Tapestry Segmentation.
To build the Market Potential dataset, Esri uses the MRI-Simmons USA Spring Doublebase survey, which integrates responses from 70,000+ adults over four continuous spring-fall sampling periods. This is combined with Esri Tapestry Segmentation information to create an estimate of consumer demand by Tapestry segment, and presented as Esri Market Potential data. See the Methodology Statement for more information.
Do the variables in Market Potential change from year to year?
Yes. This is especially true for categories like electronics and online activities. New products, such as smart home items or streaming services, are added to the underlying MRI-Simmons consumer surveys each year.
Items may also be removed from the underlying survey. This can happen if a product is discontinued or a company disappears from the marketplace.
Sometimes items don’t pass Esri’s statistical significance requirements and get dropped. This can happen, for instance, when behaviors become less common with the passage of time. An example would be cassette tape purchasing behavior; how many people do you know who are still buying cassette tapes?
How is this dataset different from Consumer Spending?
This is a common question, particularly because both sets of data contain spending-related variables. However, they are different in many ways. Market Potential estimates the total number of adults or households expected to purchase goods or services, while Consumer Spending provides estimates of the amount spent by households (in total or on average).
Also, variables related to spending are just one part of Market Potential data. Many items in the Market Potential dataset are focused on products consumers want or attitudes they have, and are not related to expenditures at all.
Both products do utilize survey information to build the data. However, the survey information is from completely different sources. Market Potential survey information comes from MRI-Simmons, a private company specializing in consumer studies and insights. Consumer Spending utilizes the latest Consumer Expenditure Surveys from the U.S. Bureau of Labor Statistics, a government agency.
Where do I find Market Potential variables?
Market Potential variables are available throughout ArcGIS products – in ArcGIS Business Analyst, through ArcGIS GeoEnrichment Service, and in ArcGIS Online as premium content. There are more ways to access the data, including buying Esri Reports online.
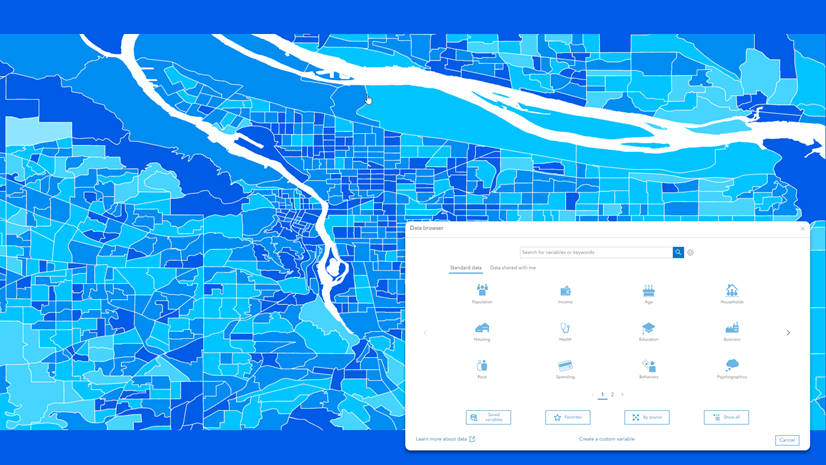
In the Business Analyst data browser, you can view Market Potential variables by clicking the Behaviors category (for behaviors) or the Psychographics category (for opinions and attitudes).

We encourage you to explore the Market Potential dataset — you’ll be amazed at the detail and granularity of this data! Keep an eye out for more data-related articles in the Got five minutes? Get to know… blog series.
Note:
This article was originally published on 7/6/2022 and was updated on 8/14/2025 to reflect the latest data source and interface.


Article Discussion: