Version 4.16 of the ArcGIS API for JavaScript (ArcGIS JS API) quietly added a couple of methods for generating default popup templates based on a layer’s renderer.
These reside in the esri/smartMapping/popup/ namespace.
All you have to do is provide a layer, and the method will respond with one or more suggested popup templates that pair nicely with the layer’s renderer.
Design popups with purpose
You should always configure popups with purpose. Keep the end user in mind. What do they want to know about the data? How do they want it presented to them? The getTemplates methods should not be used as a lazy way to create a popup template for the sake of saving time.
In most development scenarios you are unlikely to need these methods at all. It’s far more advisable to consider the end user and design a popup from scratch, so you have full control over the content.
Furthermore, you are more likely to be familiar with the attributes available in the layer. If you know the layer’s data, you can easily create a popup template referencing the attributes of most interest to your users. See the snippet and map below for an example of creating a popup with a bar chart that compares three attributes.
layer.popupTemplate = {
  title: "{COUNTY}, {STATE}",
  content: [{
    type: "media",
    mediaInfos: [
      {
        type: "column-chart",
        title: "Number of households with one, two, or three registered vehicles",
        value: {
          fields: [
            "ONE_VEHICLE",
            "TWO_VEHICLES",
            "THREE_VEHICLES"
          ]
        }
      }
    ]
  }]
};

Smart popup templates for data exploration
So why bother generating a default popup at all? The primary case is for data exploration apps. These apps may take an unfamiliar layer as input and generate a renderer based on parameters indicated by the user for the purpose of exploring the data.
That’s where the Smart Mapping APIs come into play. These APIs provide a series of helper functions that generate good default renderers based on field values (or expressions). These renderers use color schemes best suited for the map’s basemap and set break points at meaningful stops based on statistics returned from the layer.
The ArcGIS JS API documentation contains more than a dozen samples demonstrating how these Smart Mapping methods work. These methods also power the layer styling options in the ArcGIS Online map viewer.
The getTemplates methods can be used to generate popup templates that match the renderers generated in a Smart Mapping workflow.
Default popup templates
Alternatively, you could use the default popup template in data exploration apps.

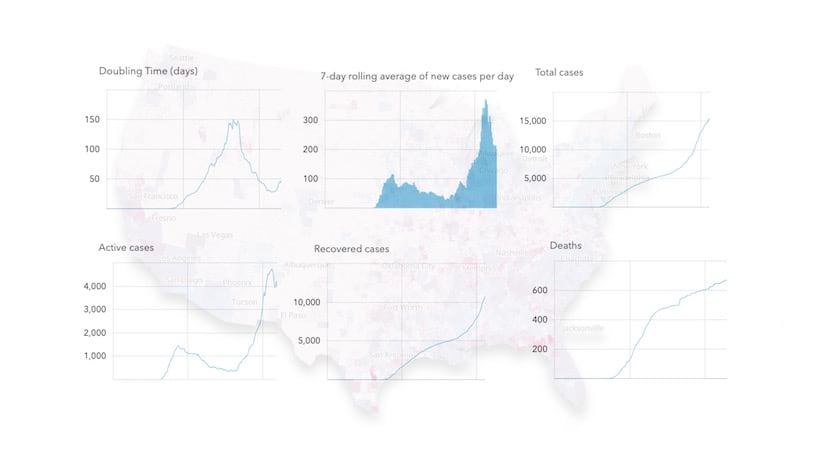
But this overwhelms the user and doesn’t clearly describe the information the user is exploring. The default popup template is intended for developers as they get to know data for use in an application. It shouldn’t be presented in a production app for conveying information to an end user.
Generate better popup templates
The Smart Mapping APIs enable end users to ask a question about their data.
- Where are features located?
- What do they represent?
- How much of an attribute is present?
- When did the phenomena occur?
The resulting renderer will show spatial patterns that answer the user’s question about the layer as a whole. The popup answers these questions for an individual feature much better than a renderer, even with the aid of a legend.
For example, the following map answers the question, What is the temperature in the United States?

The renderer, or style, of the layer helps us see overall patterns where it is warm or cold. However, no matter the renderer type, whether it’s class breaks, graduated symbols, or continuous color, it is nearly impossible to know the exact value of a numeric attribute in a feature even with the help of a legend.
Instead of overwhelming the user with a default popup that requires them to dig for the answer to their question, you can use the getTemplates method to generate a minimalist popup template that gets to the point. Just provide a layer and the method does the rest of the work.
// Sets a suggested popupTemplate on the layer based on its renderer
popupTemplateCreator.getTemplates({
  layer: featureLayer
}).then(function(popupTemplateResponse){
  if ( popupTemplateResponse.primaryTemplate ){
    featureLayer.popupTemplate = popupTemplateResponse.primaryTemplate.value;
  }
}).catch(function(error){
  console.error(error);
});

The resulting popup provides the exact value of a feature based on the renderer. Nothing more. Nothing less. That may be all your user needs in their data exploration workflow.
Multivariate styles
More complicated multivariate renderers may contain information from two or more fields or expressions. This is the case for renderers that have more than one visual variable, predominance renderer, dot density renderer, and relationship renderer.
The following sample from the ArcGIS JS API documentation uses the suggested default popup template for the predominance renderer as determined by the getTemplates method.

The template for predominance renderer provides a lot more information about each feature because the renderer requires more fields to answer the question, What is the most common decade in which homes were built in this area?
In fact, the getTemplates method returns multiple secondary popup templates for predominance renderer. The example below shows one with a pie chart.

// Sets a suggested popupTemplate on the layer based on its renderer
popupTemplateCreator.getTemplates({
  layer: featureLayer
}).then(function(popupTemplateResponse){

  // If available, applies a secondary template with a pie chart
  // The number of secondary templates depends on the input renderer
  // Sometimes none are returned
  featureLayer.popupTemplate = popupTemplateResponse.secondaryTemplates[5].value;

}).catch(function(error){
  console.error(error);
});
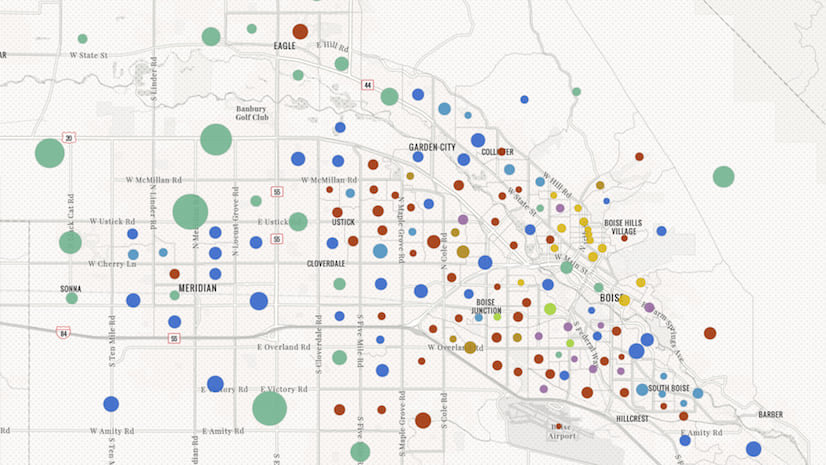
Generate popup templates for point clusters
You can define popup templates for clustered layers using the featureReduction.popupTemplate. This template allows you to present summary information about features in the cluster based on fields used in the layer’s renderer.
Just like the layer’s popup template, you can create this popup template from scratch with a limited set of aggregate fields determined by the layer’s renderer. Read the FeatureReductionCluster.popupTemplate documentation for more information about aggregate fields.
The esri/smartMapping/popup/clusters module, however, allows you to generate a good default template for any layer style where clustering is (or will be) enabled on a layer. Just generate the template and set the resulting template in layer.featureReduction.popupTemplate.
clusterPopupTemplateCreator.getTemplates({
  layer: featureLayer
}).then(function(popupTemplateResponse){
  const featureReduction = featureLayer.featureReduction.clone();
  featureReduction.popupTemplate = popupTemplateResponse.primaryTemplate.value;
  featureLayer.featureReduction = featureReduction;
}).catch(function(error){
  console.error(error);
});

Check out the Point clustering – generate suggested configuration sample in the ArcGIS JS API documentation to learn more about this workflow.
Final thoughts
As stated earlier, you should be considerate when defining your own popup content, just as you should make deliberate choices about styling the layer’s renderer. The popup template generators are only intended to either be a starting point to get to know the data in an unknown layer, or for generating popups for data exploration applications.
In most cases, you should allow the map author to create popups in the ArcGIS Online map viewer, or directly in the web app using JavaScript. If you need some inspiration, I suggest you browse the maps and layers from the Living Atlas. This site contains curated content with many examples of scenario-specific and informative popups.


Article Discussion: