In a previous blog entry, we provided a bird’s eye view upon the large ecosystem of developer-centric tools within ArcGIS for working with Imagery. Building upon that framework, we will further the notion of Imagery as an important medium for Developers. But, where do we start? What form would a potential workflow take? With so many different ways to consume and analyze imagery-based data is one environment better than the other (Desktop, Web, or Enterprise)? How do we get from A to Z? Let’s work through it.
The wider technology community has been moving toward a cloud-native holistic web approach. Within this model client applications connect to data and leverage cloud platforms for data processing, creation, and presentation. We want to essentially decouple the code, compute, storage, and analytics. Here, I outline a potential Esri framework for creating analysis pipelines represented through a series of environments and tools at the developers disposal.
Starting the Process
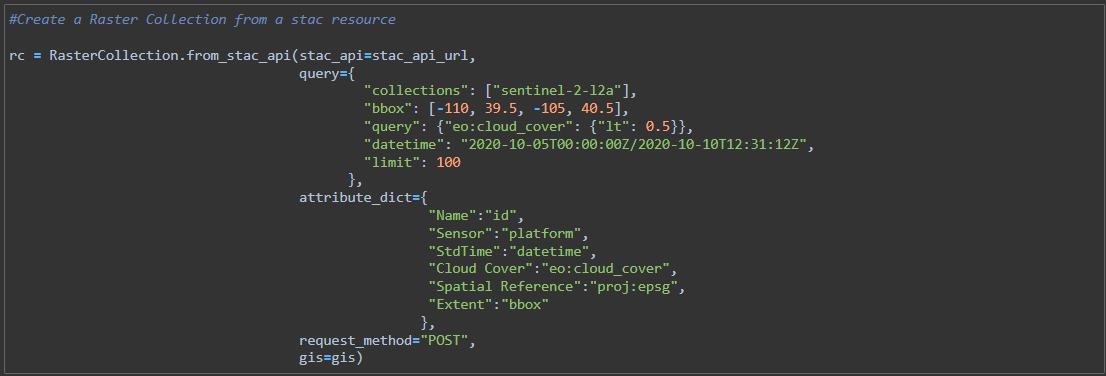
Imagine an environment where you open a web browser and have the entire ArcGIS Imagery stack at your disposal. You could visualize imagery from a comprehensive catalog such as the living atlas or a 3rd party API driven one through stac (spatio-temporal asset catalog). The focus is adaptable, ranging from analyzing global scale data with Landsat or regionally utilizing NAIP or Sentinel. You also might determine that a need to search and submit a tasking order to a data provider is needed. This can all be achieved directly within ArcGIS. If we rewind a bit, workflows of this nature traditionally follow a pattern: Search –> Analyze –> Create –> Visualize. Let’s begin by searching for data from a variety of locations.
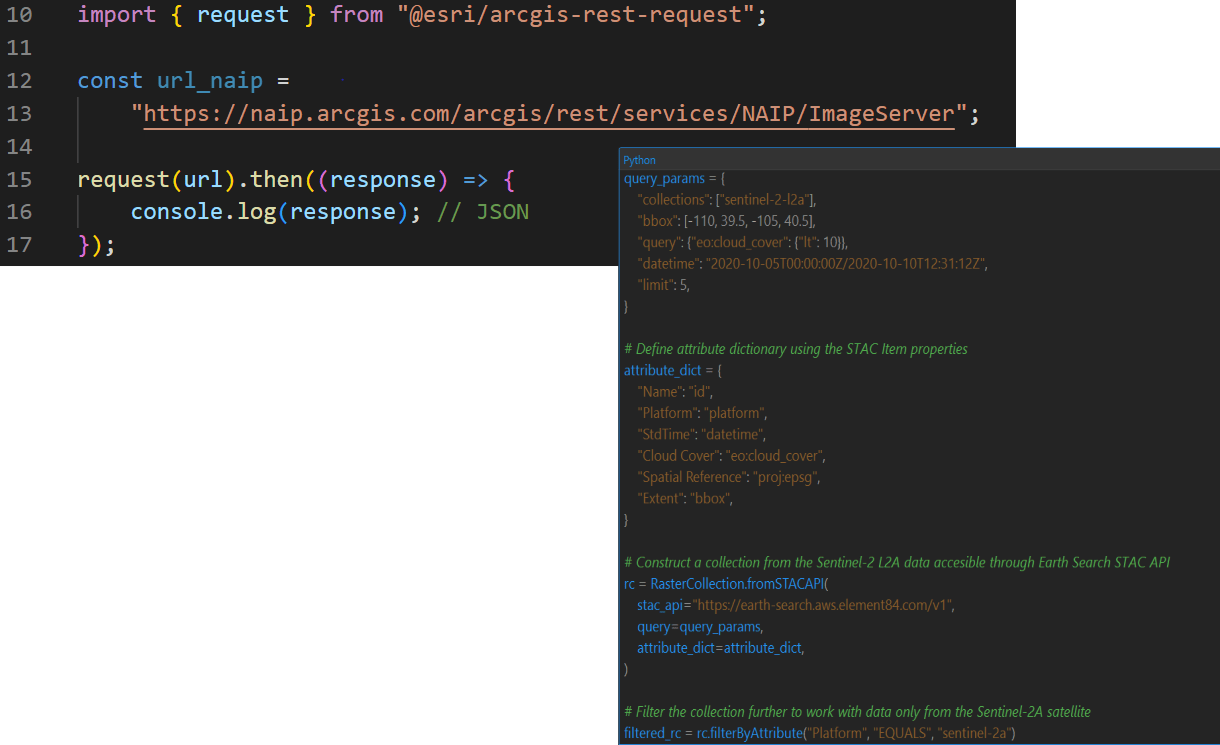
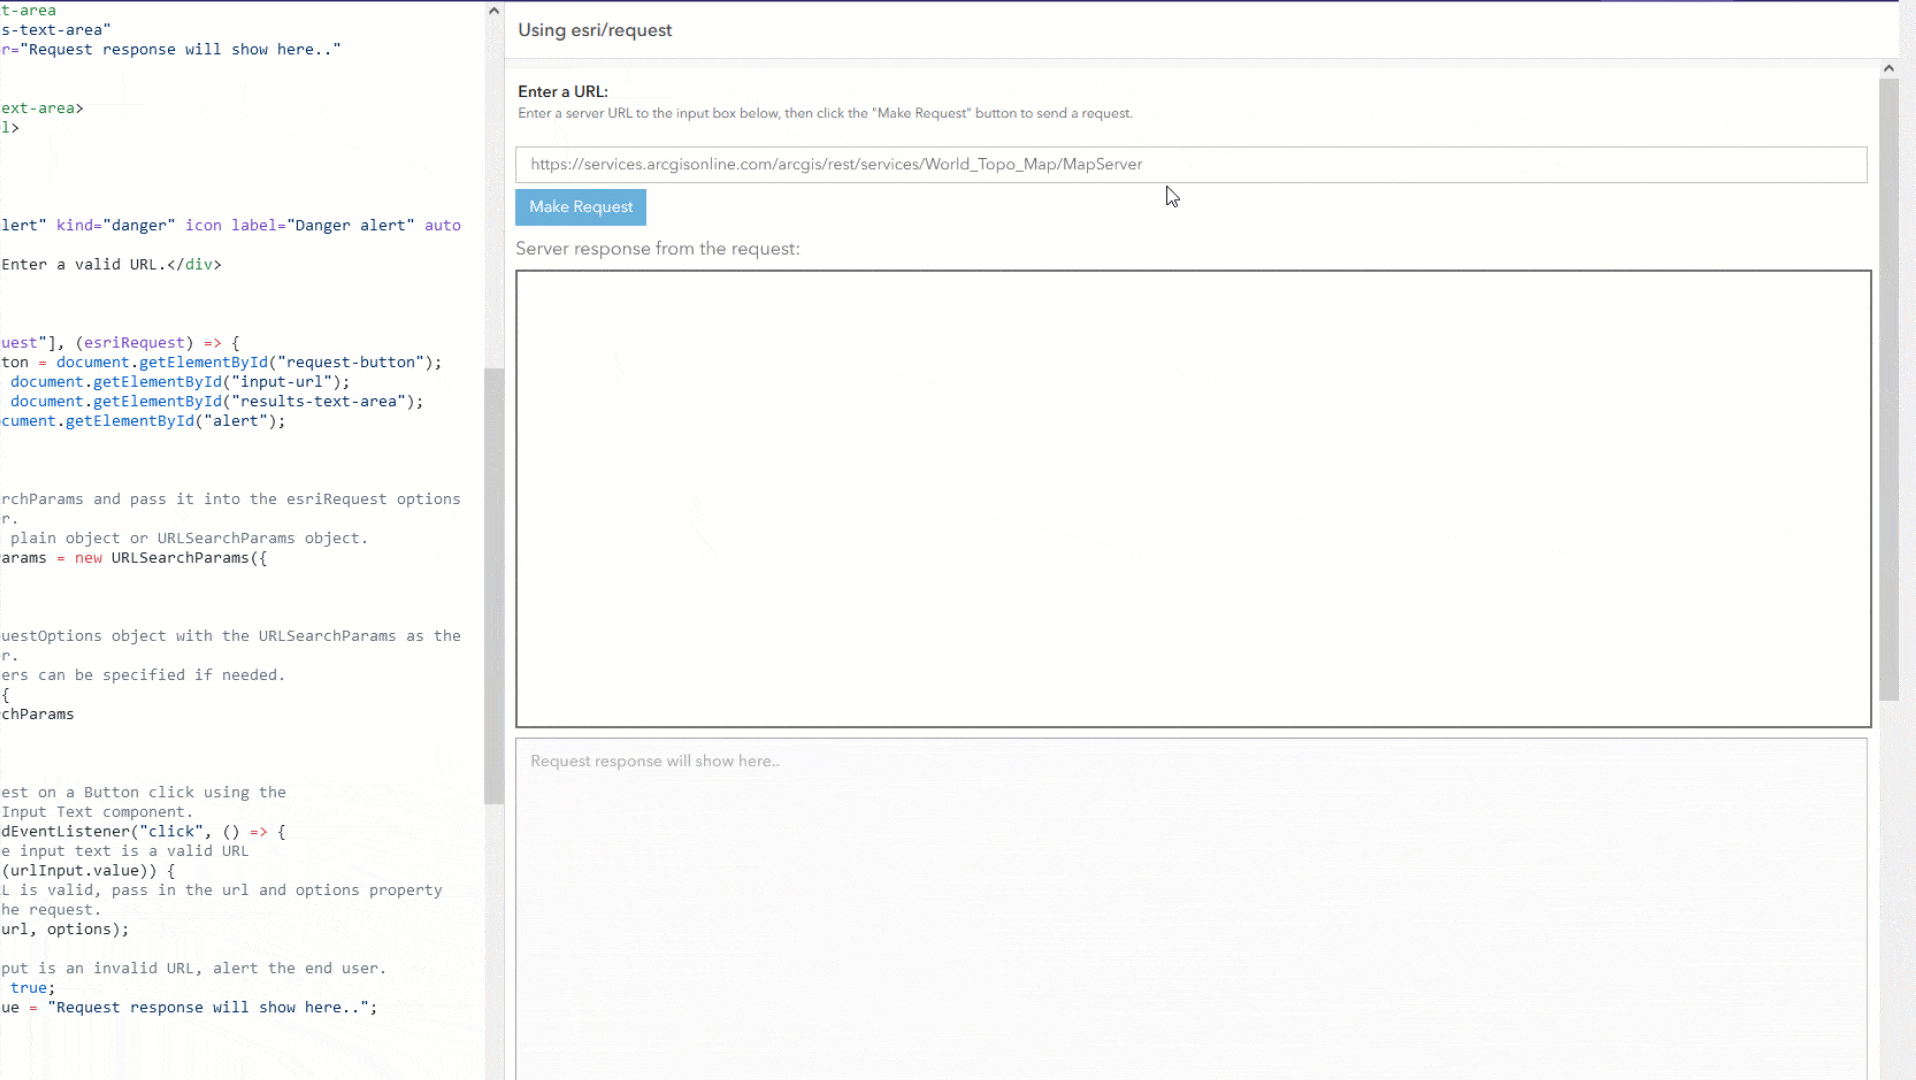
In a traditional desktop or web client, tools can be used to search or discover data that adheres to specific requirements. Think about only viewing images with less than 10% cloud cover, from a specific sensor platform, that were collected on a specific date in time. Accessing data with a code-first approach allows us to define a query that ensures the returned data meets these conditions. This can also be extended to the confines of an area of interest. All with a few lines of code!
Analyze and Create
Once you have accessed this data via a services first approach, dozens of raster functions can be applied in-memory to quickly understand band information, carry out band math, or run vegetation indices. This I/O can all be done on-the-fly without installing software based upon your need and use case. Not only can you quickly study and visualize imagery-based data, but you can also pair that with compute resources in Esri’s cloud. This allows you to run dozens of processes against that imagery data while leveraging Raster Analytics. Some compelling methods available via this path are:
- Map Algebra
- Local and Zonal Statistics
- Surface Predictions
- Deep Learning
- Regression
- Cost Analysis
- Segmentation and Classification
Both the ArcGIS API for Python and ArcPy can be utilized within ArcGIS Notebooks or through standalone code as well. ArcGIS Notebooks provide a Jupyter notebook experience across ArcGIS. In addition, many tools are exposed through the ArcGIS REST APIs providing a powerful experience for working with Image Services. The geospatial developer can leverage these environments in creative ways to create analytical products through unique combinations of tools. This really provides interactive environments for testing and quickly analyzing data in a connected environment through ArcGIS Pro, ArcGIS Online, or ArcGIS Enterprise. What makes this approach unique is that it can be performed at the Desktop client or within a browser!
In conclusion:
We oftentimes view developer technology as only important on the automation, extensibility, and custom solution creation side of GIS. However, creativity and data exploration are important from an Imagery standpoint. Esri supports developers by showing the relevance of what they do through an imagery lens enabling them to create output products in an environment familiar to them. In the next blog post in this series, we will discuss avenues for publishing data and sharing it into the ArcGIS System.


Article Discussion: