Earth observation (EO) data collected by satellites is being revisited by owners of modern business systems due to recent integrations with geospatial platforms and enhancements with artificial intelligence (AI). Often, satellite imagery for business decision-making faces skepticism based on limitations in detail and gaps in repeated coverage. However, business leaders today are discovering that there are scenarios and opportunities where incorporating satellite resources into their business analysis can enhance overall return on investment (ROI). Below are some reasons why business leaders should consider including EO data for decision-making.
Key Takeaways
- Earth observation data collected by satellites can help monitor assets, risk, and performance across large geographic areas.
- ArcGIS converts imagery into business context by combining it with operational data.
- AI enables business users—not just analysts—to ask questions and get decision-ready insights.
- EO data is now accessible, scalable, and practical for industries like insurance, retail, and real estate.
Using Satellite Data to Monitor Assets at Scale
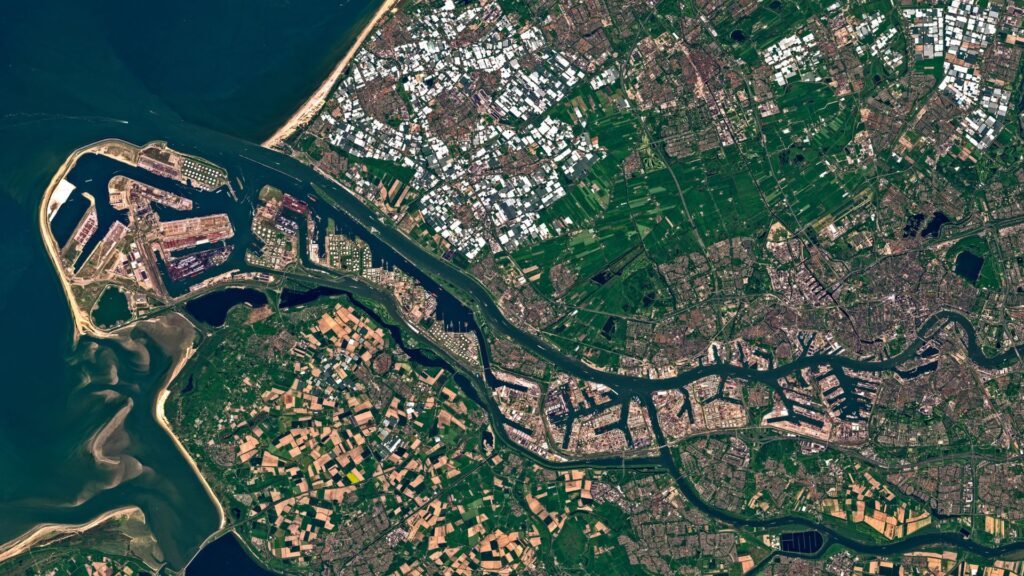
If your business includes holdings distributed across large spatial areas, or in remote or inaccessible areas, satellite data can be an invaluable “first look.” In fact, unless your business assets are indoors or localized, most industries have an opportunity to apply this technology, often from freely provided government sources.
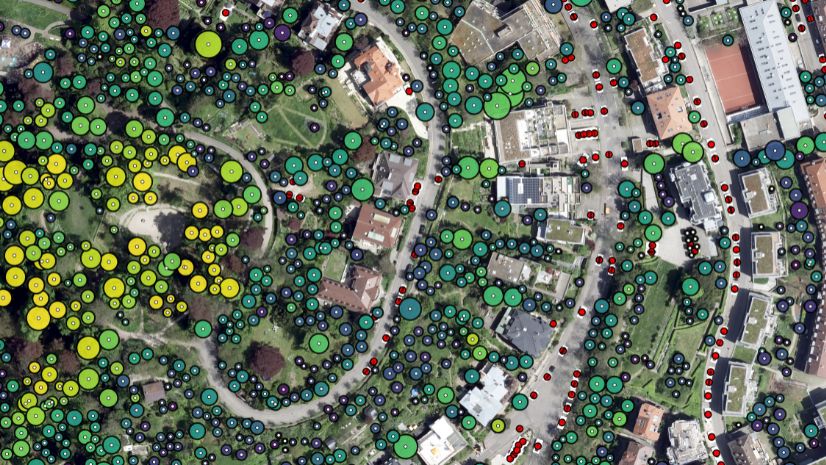
Without a clear definition of assets, however, EO detections remain an input for analysis with no real business meaning. An asset is any physical, geographically located object or system of value whose condition, performance, or risk can be observed or managed using geospatial data. Most often, we understand infrastructure or facilities as business assets. However, assets can also be natural resource elements (agriculture fields, forest stands, coastlines) or networks (electric grids or telecom infrastructure). In EO applications, an asset isn’t just an object the satellite can detect—it’s what an organization values that can be mapped and acted on.
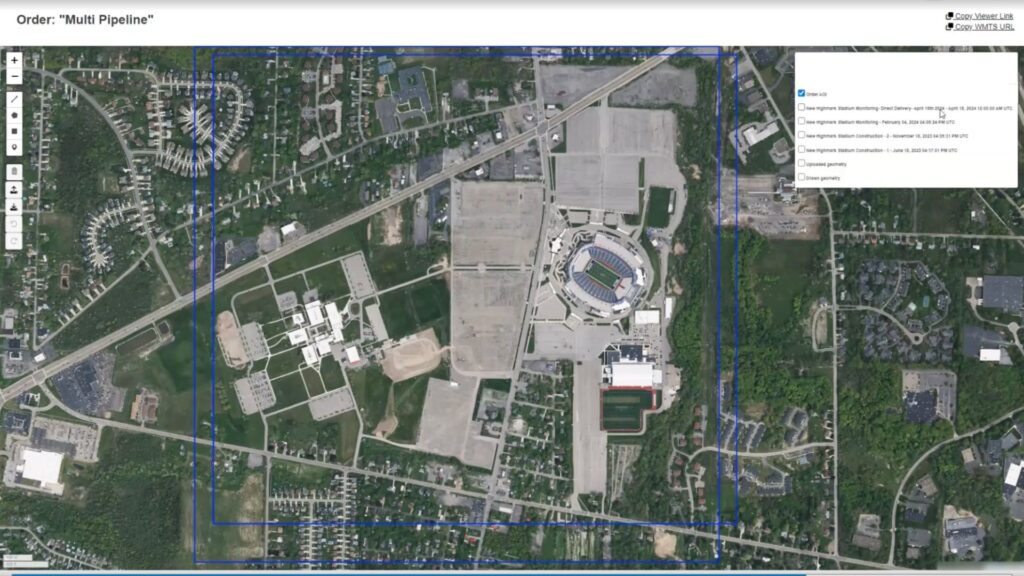
With the surge in satellite data availability coming from both government and commercial providers, asset monitoring is now making its way into decision-making processes for commercial businesses. Satellite imagery for business decision-making enables organizations seeking to monitor their assets with situational awareness, consistent information at scale, and fuel for AI applications (more details below). However, to capture these benefits, the imagery data needs to be integrated within a larger enterprise platform. A sophisticated geospatial platform, like ArcGIS, empowers these benefits as it connects spatial and temporal data, aligns different data types and resolutions, and maintains a common decision space for this type of business intelligence.
Using Geospatial Intelligence to Understand Risk and Opportunity
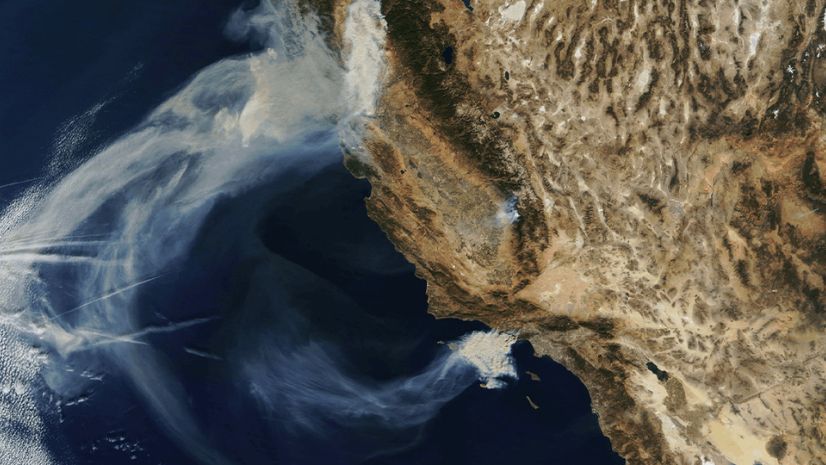
Going one level deeper, in today’s business environment, organizations are not just monitoring things—they’re monitoring systems. For example, monitoring systems means evaluating patterns, changes, and risks across multiple geographic locations and times. Sometimes an asset is defined by its risk profile, such as flood-prone properties, wildfire exposure zones, or coastal infrastructure threatened by hurricanes. EO data may be used in this case to monitor both the assets and the surrounding environment. Today, progressive companies are using this approach with satellite data to understand risk and opportunity for their business.
Risk Example: Satellite Imagery for Claims Assessment
A common satellite application you may have seen lives within the insurance industry. After disasters, insurers use aerial and satellite imagery processed in their GIS to detect damage. Their business relies on damage assessment to thousands of properties, rapid processing of claims, and an estimation of their financial exposure. The first phase of this process is to collect large-scale imagery of affected regions to identify damaged roofs, destroyed structures, and flood-affected areas. At this stage, the assessment is image-based; pixels directly indicate detected damage.
Additional insight comes when those detections are then linked to insured properties and business portfolios that include linked property parcel data, policyholder records, and building footprints. Now, “damaged pixels,” together with these other files, are the context needed for analysts to understand insured assets at risk. Algorithms using these observations are combined with business metrics to estimate losses, prioritize claims, and respond faster to customers.
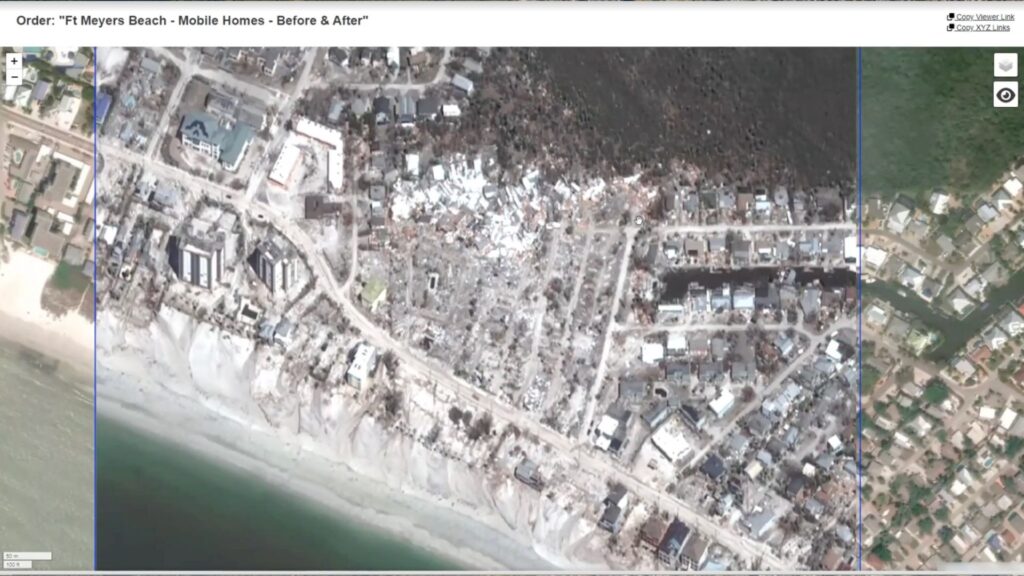
In this example, the business value comes when environmental observations are connected to asset inventories, networks, and existing workflows. This is where geographic information system (GIS) technology like ArcGIS plays a critical role. Satellite pixels alone are just detections; GIS turns those Earth observations into meaningful context.
Opportunity: Location Analytics for Retail Performance
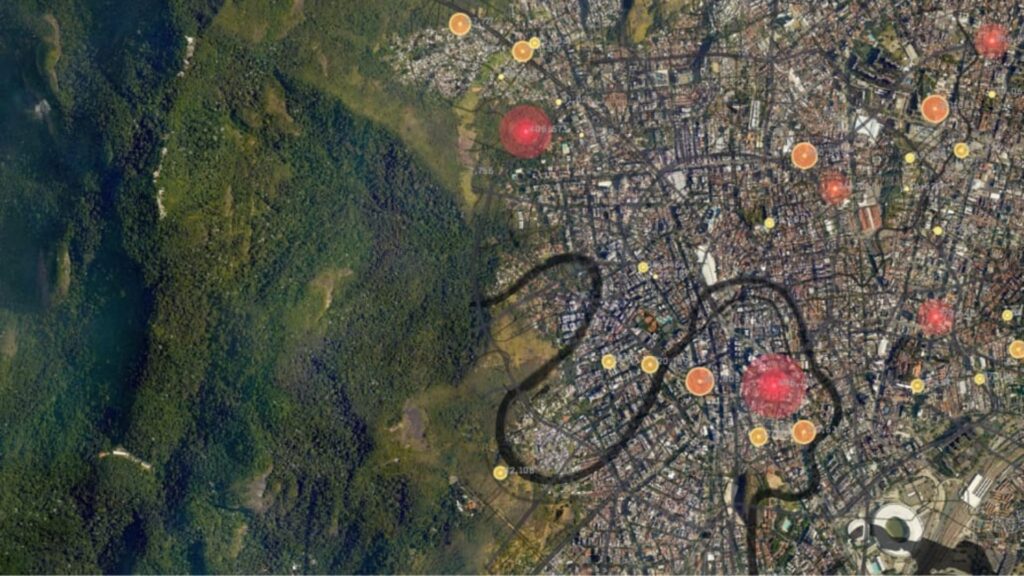
Although invaluable during a crisis, the imagery combined with GIS approach is not just about responsive mapping. ArcGIS makes business metrics materially more accurate, timely, and decision ready, by adding the missing “why” through EO context. After an environmental crisis, business leaders may perform post-disaster analysis to better understand secondary factors that impact sales following a crisis and improve their response in the future.
For example, existing business metrics for a commercial business may include static measures such as revenue by store or territory, sales growth by ZIP code, or same-store sales performance over time. With imagery data, business leaders can now answer EO-enhanced questions, such as, “Are declining sales tied to post-disaster disruption, flooding, wildfire, road closures, or site access issues visible in EO data? Are fast-growing sales areas aligned with new construction, new housing development, or urban expansion seen in satellite imagery?” These questions lead to better metric outcomes with visual data to validate the numbers. Instead of “our sales are down 12 percent in Region A,” you can now say, “Sales are down 12 percent in Region A, and EO shows prolonged flood disruption, reduced accessibility, and visible site damage in this area.” The connection of these three powerful analysis systems in ArcGIS: imagery, demographic features, and business trends, improves confidence in decision-making that just isn’t possible with each system individually.
The Future: AI-Powered Geospatial Analytics for Business
What is making the biggest impact today with EO data are the large language models (LLMs) being developed to streamline these business workflows. The technology stack integrated with ArcGIS, combined with the latest AI assistants, transforms complicated geospatial intelligence into something any business leader can understand. Today, analysts work with business data in spreadsheets and dashboards. However, they struggle to understand what happened on the ground, why metrics changed, and what they should do next. By interacting with AI assistants in ArcGIS, users can ask questions, get explanations, and receive recommendations from these information sources customized for their needs.
Assisted reasoning based on real Earth observations with the ability to predict and model future scenarios is the key to improving future business practices. We are rapidly moving from questions such as “What happened here and why?” to “Which assets should I prioritize to minimize my losses?” Knowing what lies ahead helps you prepare for disruption and change, reducing business risk as you address potential problems before they occur. For example, you can automate the processing of periodic imagery collections to assess your infrastructure and predictive analytics to alert your operations team when it’s time to upgrade, ideally months before your structure could fail.
Predictive AI techniques use algorithms to search for patterns in historical data and then use those patterns to make predictions about future outcomes. These types of models are already being used by data scientists with respect to business problems based on tabular, point, and text data. But EO data from satellites is also a rich resource for this type of analysis, with government programs such as Landsat providing satellite imagery data to the public since the early 1970s. Common predictive tools for imagery, such as regression, decision trees, neural networks, and clustering, are well-understood and stable. Predictive analysis workflows are also easily automated, with incoming data compared to model predictions and subsequent adjustments of model parameters to improve results.
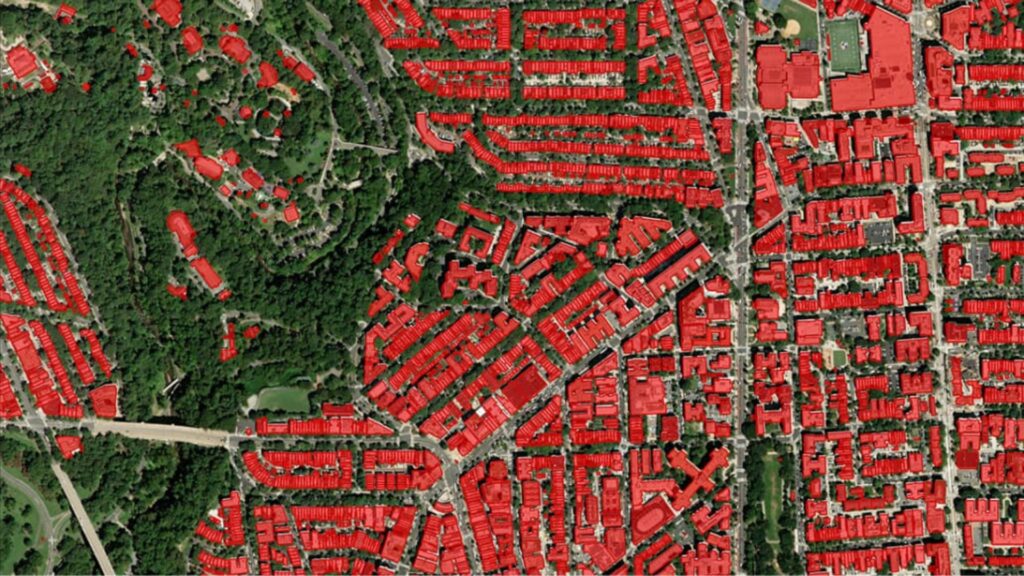
ArcGIS demonstrates a range of AI-driven workflows. These include deep learning models that detect damage or vegetation encroachment in imagery, from change-detection algorithms that monitor how conditions evolve over time to spatial modeling that predicts risk and exposure. I am most excited to know that as the algorithms mature, we can revisit the years and years of EO data that has already been collected. This becomes a way to give new purpose and value to these datasets within the context of modern-day decision-making.
How to Get Started with Earth Observation and GIS
EO data from satellites deserves another look. When this data is combined with rigorous spatial analysis in the same platform, it’s critical to business context and has the potential to transform traditional business metrics. With imagery and GIS, business leaders can now aggregate observations of entire portfolios of assets to better understand trends and ask meaningful questions.
In addition, open-source satellite programs are continuing to expand as NASA and ESA continue to make their data more accessible to nonscientific users. The dataset I would recommend starting with is the Harmonized Landsat and Sentinel-2 (HLS) dataset that can be accessed in ArcGIS via the SpatioTemporal Asset Catalog (STAC) pane in ArcGIS Pro.
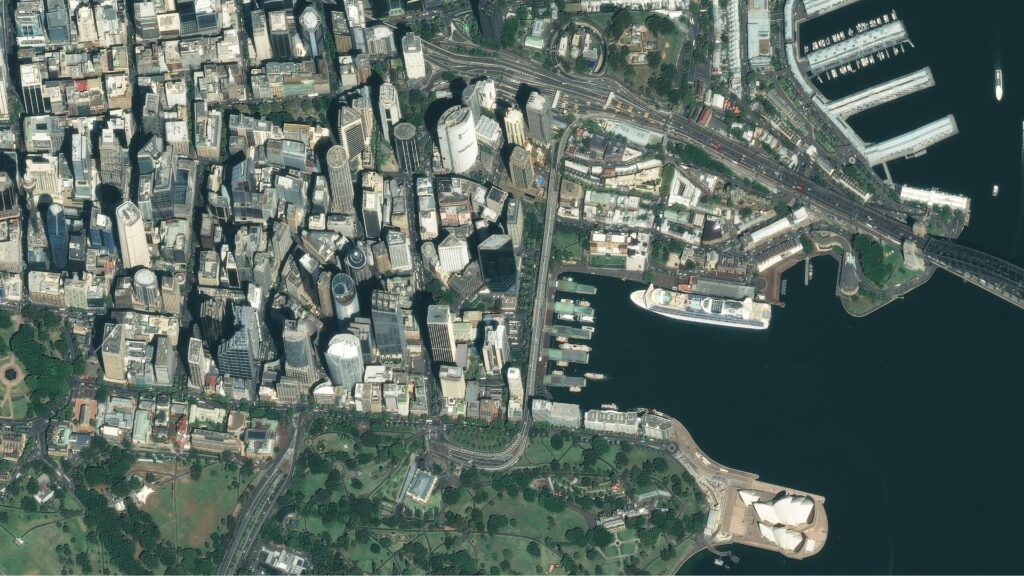
There are so many other options available, including derived imagery layers for you to consider. For current Esri users, ArcGIS Living Atlas is the easiest way to start, with the most common datasets available within ArcGIS without having to find, process, and manage the data yourself.
To learn more about how you and your team can get started using satellite imagery for business decision-making, visit our imagery and remote sensing capabilities page.