June 23, 2020 |
Ben Conklin | GIS for Good
As countries around the world continue to reel from coronavirus disease 2019 (COVID-19), a new level of communication through shared context is helping people across organizations and governments work together to curtail the pandemic.
One source of truth, the Johns Hopkins COVID-19 Dashboard, uses cloud-native geographic information system (GIS) technology to show the global status of the spread of the virus. This location intelligence, based on a Web GIS, connects and informs people who are taking on COVID-19 challenges.
Government officials use GIS for a deeper understanding, analyzing the vulnerability of people, and monitoring the effectiveness of policies designed to slow the spread. Business leaders rely on GIS to analyze facilities, supply chains, and customer activity to know when and where to reduce or ramp up activity to weather the economic storm. Staff at global nonprofits perform spatial analysis with GIS to guide the much-needed delivery of aid.
These efforts are all supported by Web GIS, which delivers a combination of location-aware apps, dashboards that display critical dimensions, spatial analytics to visualize what’s happening across space and time, and maps to guide actions. This geospatial toolset strings together workflows with visibility for all. Web GIS has been put through its paces to tackle many compelling missions, because this era calls for unprecedented collaboration. The technology pattern has matured at the right moment with enhanced capabilities—including app-based workflows, artificial intelligence (AI), real-time analysis of Internet of Things (IoT) feeds, and deep learning—that make it easy to link data and combine efforts.
The US Army Corps of Engineers deployed its first shared enterprise application across all 52 districts to connect workflows and share progress against the goal of adding hospital beds. The corps usually responds to much more localized disasters. The scale of the COVID-19 crisis forced a new level of focus, with each district using the same tool to assess facilities that could house hospital beds.
A shared national mission, on a tight timeline, married two key cloud-native geospatial capabilities. To prioritize relief efforts, corps leadership needed real-time information and spatial analytics—forecasts and projections of disease spread and hot spots. Crews fanned out using field mapping to audit and assess potential locations for additional beds, such as hospitals, college dormitories, and arenas.
Crews gathered details, powered by location-aware apps, to amass expertise from multiple specialists for each site audit. The app gathered input from structural and civil engineers, environmental specialists, and other experts. This information was aggregated and analyzed alongside site specifics such as proximity to public transportation and other hospitals, as well as distance from distribution sites. All the data fed into the GIS for spatial analysis to give each site a score. Then, as sites were selected, the same GIS tools could track construction progress. To forecast future needs and guide planning, analysts applied ArcGIS Insights, a cloud-native analytics engine that aggregates inputs from multiple models to guide priorities.
In short order, the alternate care facility operation resulted in more than 600 assessments, 38 construction projects, and an addition of more than 15,000 beds. The US Army Corps of Engineers had recently upgraded to apply ArcGIS technology across its enterprise when the pandemic hit. This advanced level of geospatial capability provided a proving ground and a path forward for further digital transformation.
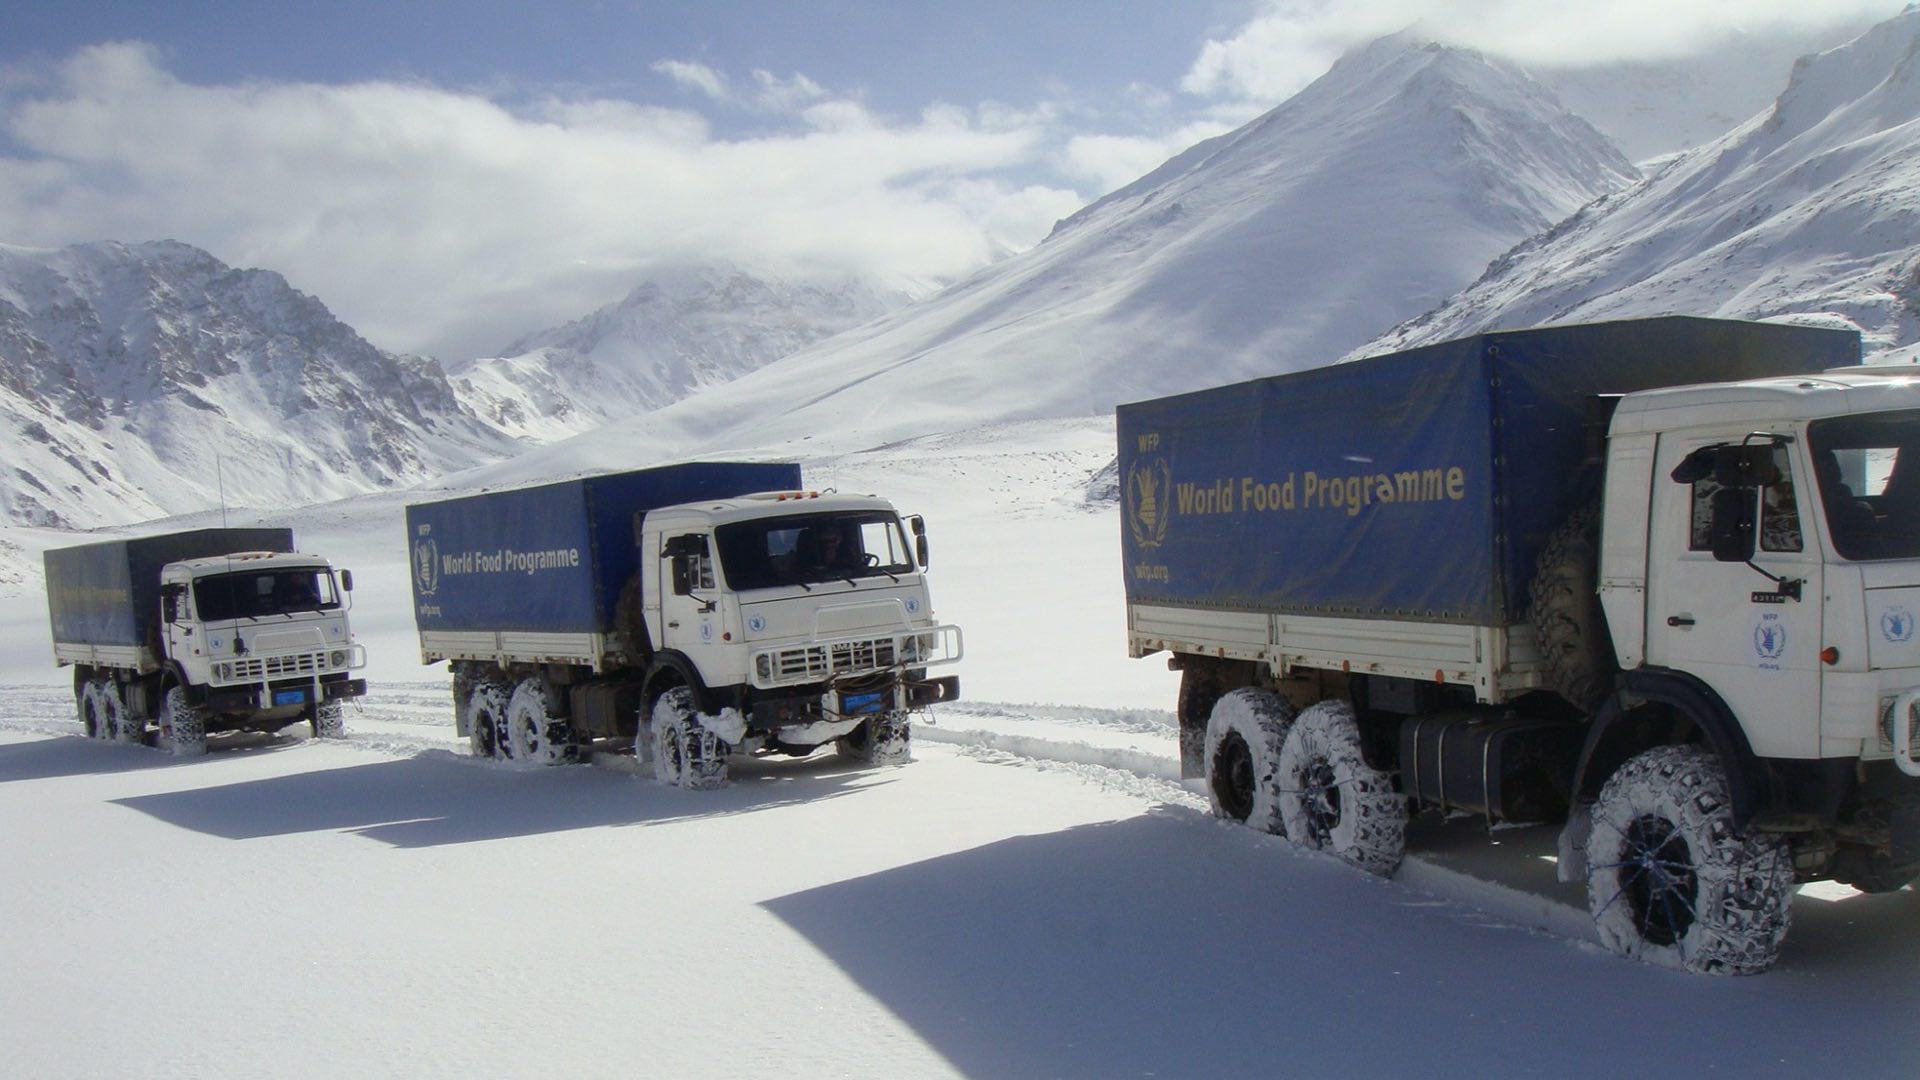
This year, the World Food Programme (WFP) won the Nobel Peace Prize for its efforts to combat hunger, its contribution to bettering conditions for peace in conflict-affected areas, and for acting as a driving force in preventing the use of hunger as a weapon of war and conflict.
As COVID-19 exacerbated the need for supplies worldwide, WFP extended its use of ArcGIS to bring aid to extremely dangerous and hard-to-access communities.
In one poignant example, the WFP’s Afghanistan operations pose significant challenges. The country’s protracted conflict, rugged terrain, rough road network, and snow and floods make it difficult for aid workers to deliver food to remote areas—often places with the greatest needs.

Easy-to-use location-aware apps have provided a new level of awareness for people working on these difficult operations. Warehouse workers aggregate input from drivers about road conditions and enter it in a system that displays security threat, weather, and program details. The shared understanding has helped WFP staff forge greater alliances with locals in areas they once struggled to reach.
WFP leaders make heavy use of GIS technology to plan operations, map vulnerabilities, and meet the demands of the populations they serve. The tilt toward online tools enhances existing data collection, analysis, and mapmaking efforts by adding shared context. This understanding gives all stakeholders an awareness of the challenging dimensions of WFP’s mission as the technology supports collaboration and iteration of solutions to achieve results.
Volunteer organization GISCorps uses Web GIS to harness the skills of the professional GIS community to aid those in need. Operations include capacity building in developing countries. Recently, volunteers have been empowering a distributed network of professionals to apply local aid to communities in crisis. The work involves developing maps and applications for nonprofit partners as well as creating maps of crowdsourced photos for emergency managers during and after natural disasters.
The network of volunteers rallied early in the pandemic to collect and map details on US COVID-19 testing sites. The network created an online form that providers and government agencies could use to add their own testing sites. The resultant interactive map, which continues to improve in terms of accuracy and completeness, filled an information gap at a crucial time.

For the GISCorps testing sites dashboard, a web services approach connected disparate data with linkages that can appear on multiple maps. The famous Johns Hopkins map takes the same approach—showing people around the world what is happening where. This new level of data fluidity is key in modern dashboards that compile authoritative resources into one pane of glass. More than ever, people are relying on and seeing the value of a shared understanding in a crisis.
A signature of Web GIS is its ability to connect disparate groups, enabling them to act together from remote locations. This flexibility supported staff across businesses, nonprofits, and government organizations who had to quickly pivot to working from home without losing productivity. The same connection drives the GISCorps testing sites map, bringing together local GIS users who gather data from authorities or drive by a location to make certain it’s in operation and then add this knowledge to the map.
The global pandemic is accelerating the evolution of location intelligence as GIS technology quickly becomes more collaborative, insightful, timely, and impactful. All manners of urgency—including testing, protective equipment, food, disaster response, and vaccine distribution—are benefiting from higher levels of connectivity.
In pace with the changing needs of people and organizations around the world, Web GIS continues to evolve, adding capabilities at ever greater speeds and scales. The connection capability clearly shone in this latest crisis. The latest GIS advancements include the combination of drone data capture, realistic modeling, and immersive augmented reality within a digital twin. GIS users can expect a more immersive contextual experience that improves communication and collaboration for solving complex problems.
Access humanitarian and public health data, live feeds, technology, and resources through Esri’s Disaster Response Program.