
June 24, 2025 |
Multiple Authors | Infrastructure
November 17, 2026
On her first day at Kampala Capital City Authority (KCCA) in 2012, Flavia Zabali Musisi—now head of GIS at KCCA—walked into the office with a laptop. A senior planner looked her over and asked, “Oh, young girl, are you here to draw beautiful maps?” She replied, “Yes, I’m here to draw beautiful maps, but also to change how the city uses data.”
KCCA has made good on that promise. The authority’s planners and GIS specialists think of the city holistically, collecting more data with geographic information system (GIS) technology to support development and delivery of services for all residents.
GIS in Kampala then meant stand-alone ArcMap installs on separate machines. If Musisi updated the roads layer—a new road, a new stretch paved—she copied the shapefile to a flash drive and carried it to a colleague. Two people running the same analysis off unsynced data got two different answers.
Musisi pushed for a bigger GIS budget, after attending Esri user conferences, watching what other cities could do with their data. The result was a foundation of shared maps, layers, and operational systems everyone at KCCA could draw on in real time. Then came the vision for a living digital twin of Kampala that integrates those systems, so the city can know what has changed and manage with situational awareness.
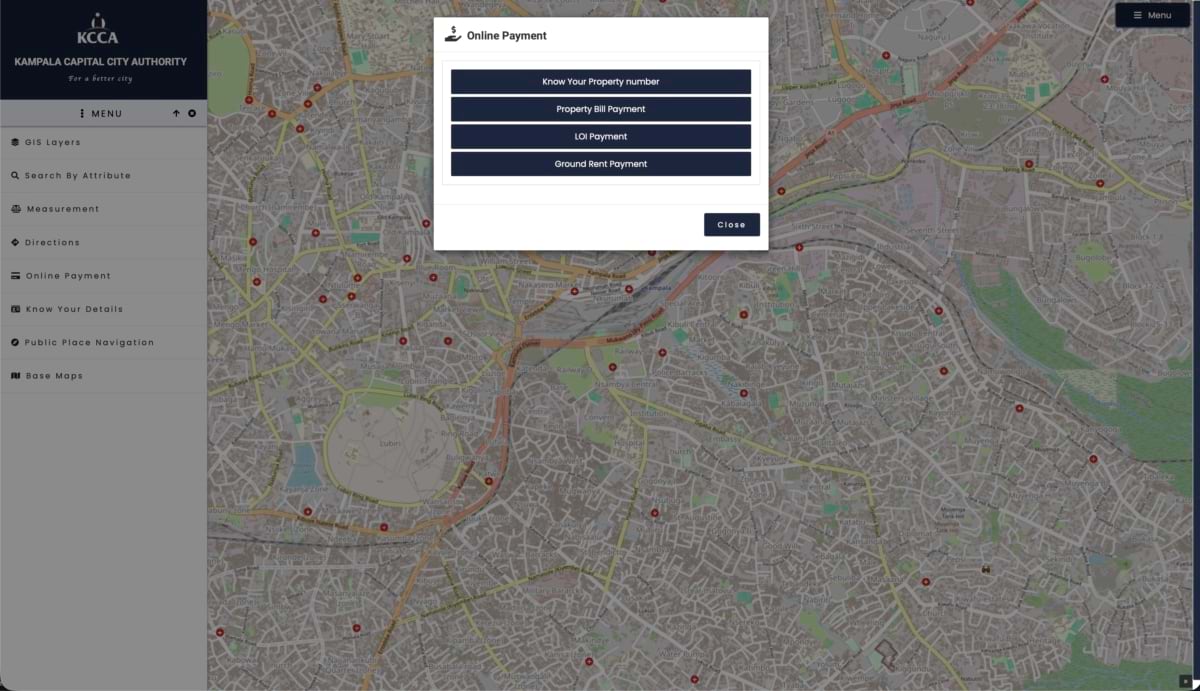
Property taxes are Kampala’s largest source of city-generated revenue. The problem was collection. Revenue officers worked from a valuation roll with no addresses, no way to locate a property and confirm it existed or to catch a new building when it went up. Taxes owed went uncollected because collectors didn’t have tools to track what was owed.
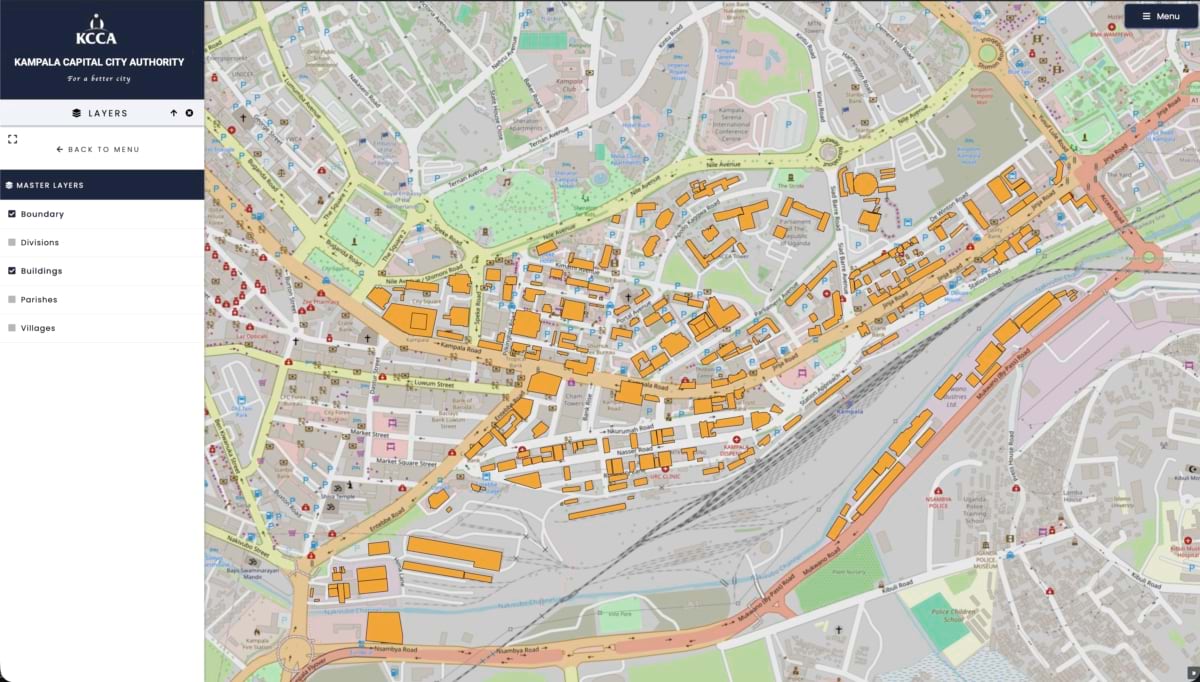
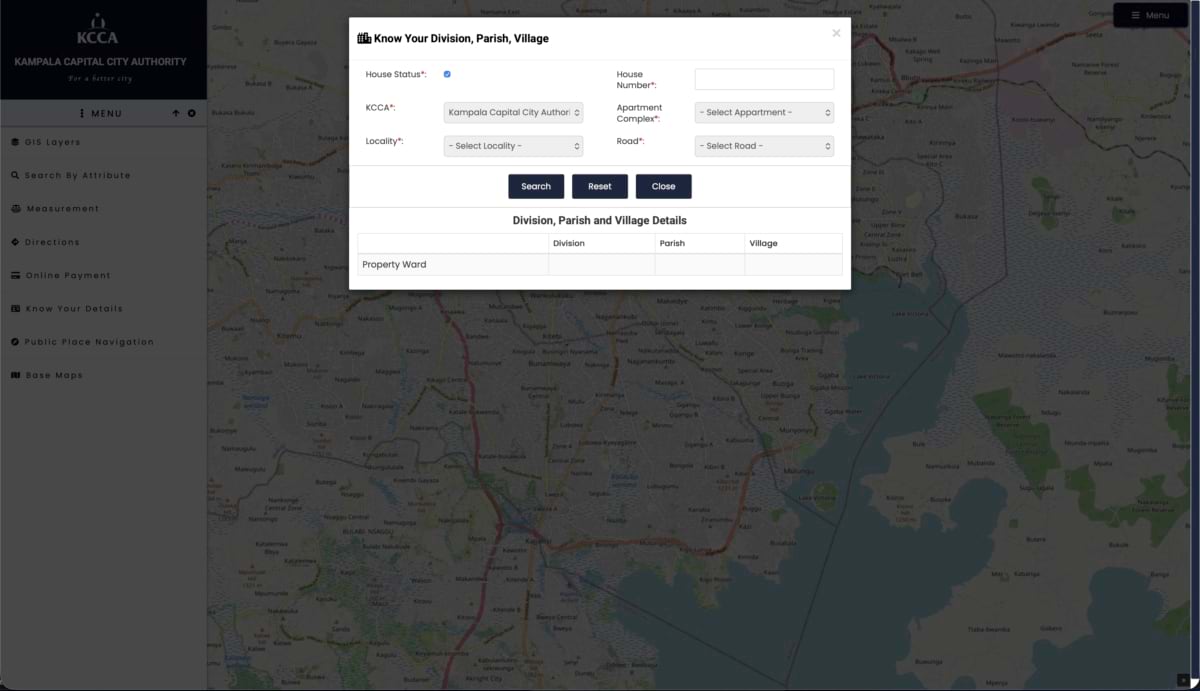
KCCA’s GIS team fixed that by geocoding the valuation roll in ArcGIS, attaching a real address to every building. Once properties had locations, hundreds of thousands of previously invisible buildings surfaced, each carrying its own tax bill. Revenue from property taxes climbed from 17 billion Ugandan shillings to 75 billion over 10 years.
The paper trail it replaced carried its own cost. “Valuation data is something you always have to revisit,” Musisi said. “Someone complains that their rate is high, and you have to run back to what you collected to show them why.” With a digital record tied to a mapped location, that lookup took seconds instead of a trip to the file room.
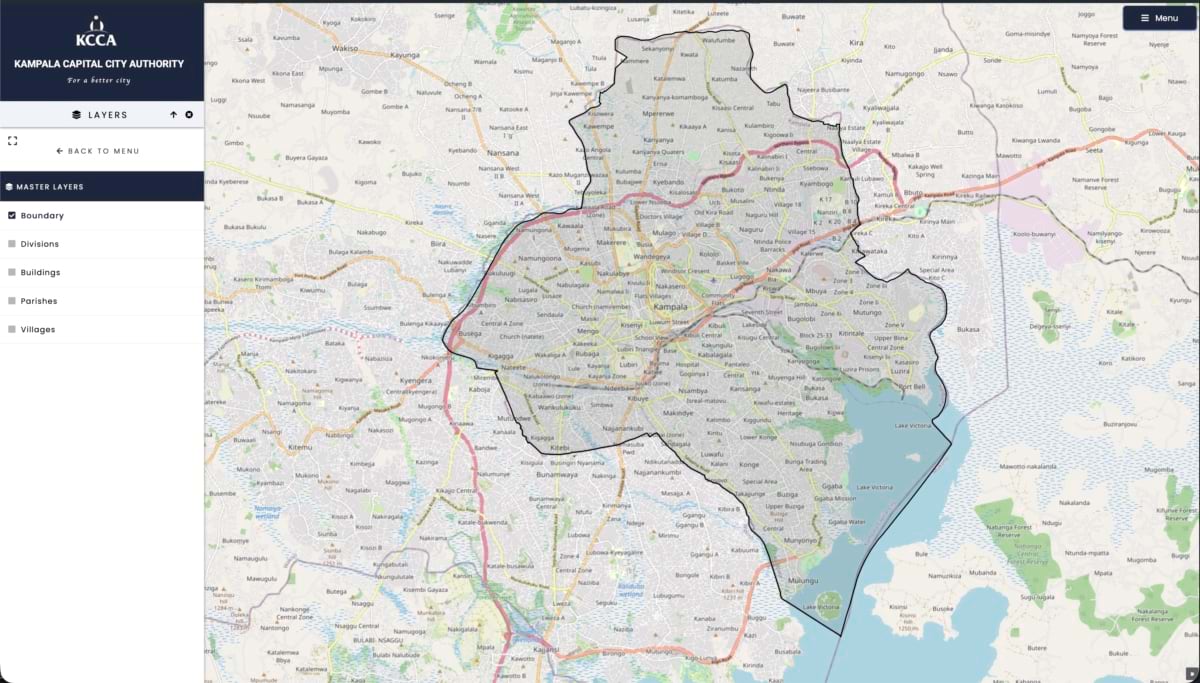
Increasing tax revenue led to visible improvements to justify the collection, as the law requires the city to put the funds back into roads, street lighting, and waste management. The revenue also helped KCCA expand its GIS capacity by adding ArcGIS Online, then ArcGIS Enterprise to extend the GIS user base and spread digital transformation to more departments.
The revenue case also exposed a harder problem. A building can clear development permission, a building permit, and an occupation certificate through two separate city systems, and nothing yet tells the revenue office when a new structure is ready to be assessed. Closing that loop is the step from foundation to digital twin. KCCA is working toward an integrated platform where a permit in one system triggers a valuation in another, instead of someone from revenue walking the ground to notice a building went up.
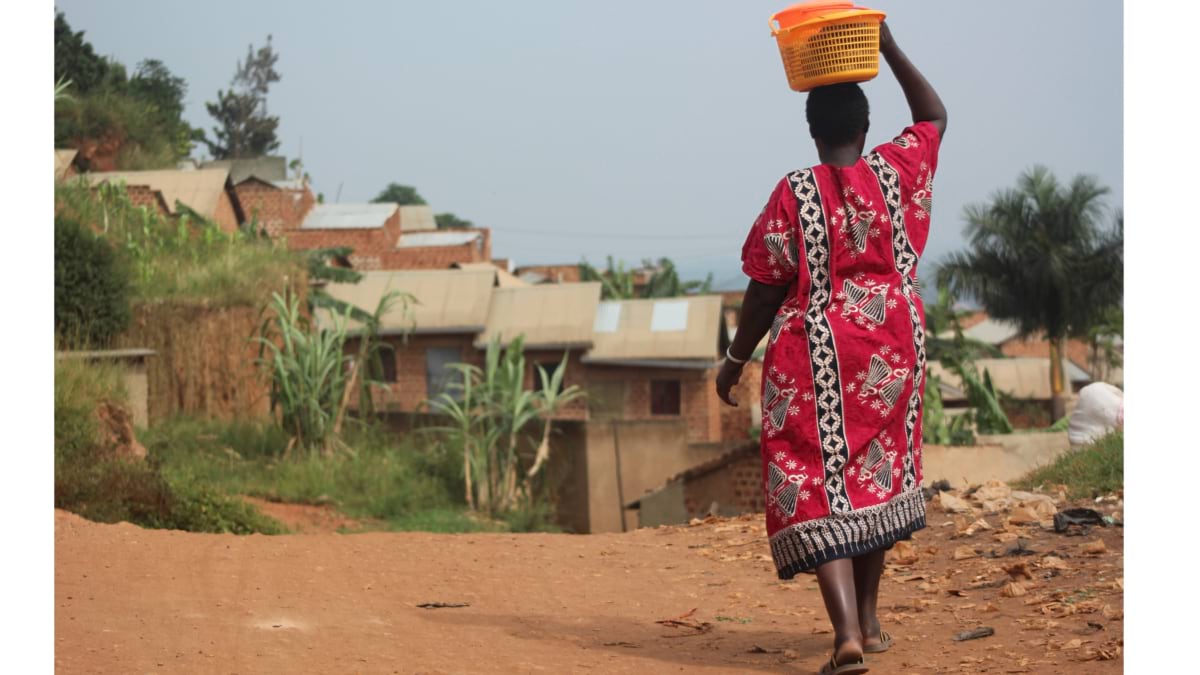
The next challenge KCCA took on was a public health one, and it started with mapping. About 94 percent of Kampala’s households aren’t connected to a sewer network, and most rely on pit latrines and cesspools. Many are unlined, which makes them difficult to empty safely, and during heavy rains some overflow is released deliberately, sending waste directly into the surrounding community.
With funding from the Gates Foundation and the UK Department for International Development (DFID), KCCA set out to build the first complete picture of Kampala’s sanitation reality. Field teams surveyed toilets across the city’s informal settlements, recording location and type: formal or informal, lined or unlined. The finished map showed, for the first time, exactly where the risk was concentrated and where new and improved sanitation infrastructure would do the most good. It gave the city an evidence base for citywide sanitation investment, rather than the guesswork that had come before.
That same map became the operational backbone of Weyonje, “clean yourself,” a dispatch system that routes licensed emptiers to service calls, then logs location, volume, and payment for each visit. The system cut the time between a full latrine and someone showing up to empty it, closing the gap where overflow and cholera outbreaks start. KCCA credits the mapping and dispatch system together with a sharp drop in outbreaks. The program has since won multiple national and international awards.
When an outbreak does surface, KCCA’s GIS team builds a hot spot map that traces a diagnosed patient’s household, flagging neighboring homes by their sanitation status, and getting response teams into the area before the disease spreads further.
Kampala’s data and mapping discipline soon became a model beyond its own borders. Uganda wanted to start tracking traffic crashes, a first for the country and still rare across much of Africa. Rather than commission a custom data collection platform, KCCA’s GIS team built one by connecting ArcGIS Survey123 forms to ArcGIS Dashboards.
The resulting crash map surfaced hot spots across the city that traffic engineers should address. The system identified pedestrians as the group most at risk, evidence to guide where road safety improvements are most needed.
That kind of outside call for solutions has become routine for KCCA’s small GIS team. The Greater Kampala Metropolitan Area’s 10 local governments mostly run without GIS units of their own, turning to KCCA for solutions. When the local governments began asking for their own desktop GIS licenses, KCCA presented the case for an enterprise GIS approach, one that could speak across departments instead of sitting inside them.
The Ministry of Kampala has since procured the software KCCA recommended, and KCCA is now lobbying for funding to build the digital twin. Mbarara City has adopted Kampala’s addressing model. Jinja City and Kasese now run their own ArcGIS platforms, as part of a partnership with UN Global Pulse Uganda (see sidebar) aimed at strengthening data-driven governance.
Ten years of GIS work has built something Kampala can point to: a foundation of shared maps, addresses, and operational systems that started with a flash drive and now spans property tax, public health, crash safety, and sanitation across a city of more than three million people. Each works well on its own. The next step is making them work as one.
The next frontier is integration and scale. Kampala and the surrounding metropolitan area have an estimated 2.1 million buildings. The valuation roll covers about 165,000 of them, because no field team has reached all of them yet. Closing that gap means finishing what the address project started: making every building visible to the system.
Partnering with the International Growth Centre, a UK-funded research initiative, KCCA’s GIS Department trained a machine-learning model on the buildings already assessed. The model estimates values for the rest, giving KCCA a tool to expand the tax base and improve equity. It can also help target infrastructure investment, identify low-value informal settlements, and monitor urban change over time.
The model learns what a valued building in Kampala tends to look like, both up close and from its surroundings: footprint and height, distance to a paved road, brightness at night, the density of the block around it. Then it estimates a value for every one of the other 1.9 million buildings.
That kind of reach, a citywide property value surface at the level of individual buildings, would be a first for Kampala. It would also be useful for other cities following Kampala’s model.
Musisi has been pushing data-driven governance with GIS for more than a decade. KCCA’s GIS started with data collection and turned into a city that knows parcels and addresses, collects what it is owed, and improves the lives of everyone within its boundaries. That foundation is what a digital twin will build on: one integrated view where permits, revenue, sanitation, and roads update each other as the city changes.
Learn more about how local governments apply GIS to modernize operations, gain new perspective on the balance between natural and built environments, and create equitable and inclusive policies.