Q&A: Open Data Gives Los Angeles a Boost in Community Collaboration
By Nick O'Day
The City of Los Angeles has long been an open data pioneer, including being the first to launch a site dedicated to exploring, visualizing, and downloading location-based open data via a GeoHub.
A recent Open Data Day event provided the impetus to catch up and learn about new areas of focus from Eva Pereira, LA’s chief data officer. There are many new initiatives aimed at Equity and Social Justice. And geospatial analysis plays a large role in addressing city challenges.
This interview has been edited and condensed.
Q: Los Angeles is well recognized as a leading data-driven city. What role does the yearly Open Data Day play?
A: We try to do something new every Open Data Day. This year, on March 5, we hosted a citywide competition to improve the quantity and quality of our open data. We had city departments look at their open data and improve their descriptions, improve their metadata, and in some cases publish new datasets.
Last year, we focused the event on the pressing issue of food insecurity in Los Angeles, which was heightened by the pandemic. We partnered with researchers from the University of Southern California’s Keck School of Medicine, the L.A. Food Policy Council, and from L.A. County to talk about the topic. Then we had a hackathon where we shared the data and participants developed solutions.
Q: How do you leverage open data to engage with community stakeholders?
A: I try to get partners involved that are mission aligned. There are problems that the city is trying to tackle, and we have our data, but there are community-based organizations, research institutions, nonprofits, advocacy groups that all are trying to solve the same problems.
Whenever possible, we bring partners to the table by sharing data and showing our interest in their data. There’s a lot of value to be gained by working together with organizations that are tackling similar problems.
Chief Data Officer, City of Los Angeles
Eva Pereira
Q: What are some issues the city addresses using a geographic approach?
A: For everything from land use planning to transportation and broadband access, we use geographic data to pinpoint areas of need. This Open Data Day, we gave the Department of City Planning the Department Data Champion award for updating the data they share publicly through the GeoHub. They share a lot of interesting map-based data, around issues such as enhanced bicycle networks. The department has a huge repository of data and maps that they keep fresh, related to zoning, pedestrians, vehicles, and transit.
If we maintain our open data, then we’re able to dive into these issue-specific problems and tackle them effectively. It starts first and foremost with departments maintaining what they’ve posted, publishing new data, and continuing the commitment to open data. Future initiatives are built upon open data.
Q: What are you doing in the area of examining equity?
A: We’re currently working on an equity site that explores the history of racial injustice in Los Angeles and connects residents to information and resources related to city services. We’ve divided it by issue area, such as housing and built environment, economic opportunity, education access and attainment, justice and policing, and health and well-being. It’s going to be a great information tool to understand our history and how we got to where we are today. I’m hopeful that residents will use it to connect with resources and get involved.
For another project on health equity, we’ve used CalEnviroScreen 4.0 data to visualize pollution and health impacts for L.A. neighborhoods. The city is a partner on a NASA air quality grant. Just yesterday we mapped the location of all the sensors maintained by the Bureau of Streetlights and were looking to identify where we need to place more sensors to capture more accurate air quality data.
We’re very committed to environmental justice, and that’s a problem that data can help solve.
Q: We’ve seen a great increase in the use of dashboards to track progress. Has that been a trend for you too?
A: Dashboards are particularly helpful when you want to provide an information tool to policy leaders. We produce a lot of operational dashboards to let them know how a particular issue is trending. We need to understand the baseline and build data collection strategies to see whether we’re on or off track. Dashboards help us keep an eye on things and see whether we’re hitting the goals that we’ve set for ourselves.
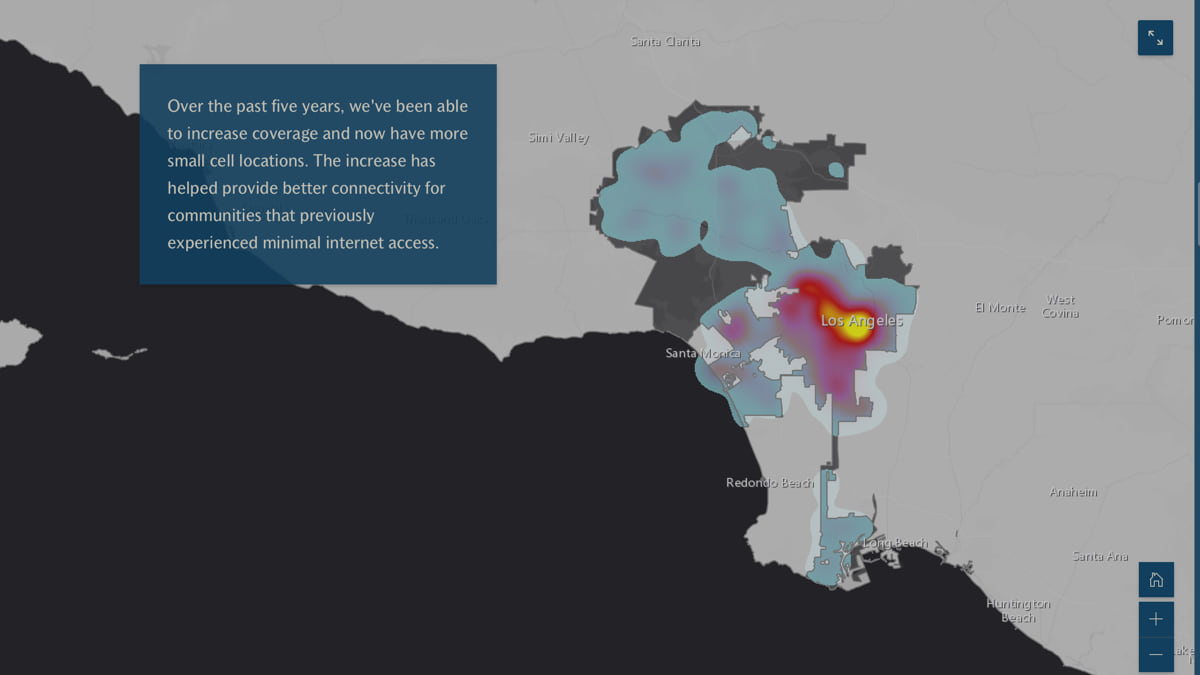
This map in the "Improving Digital Equity in Los Angeles" story shows how cell coverage has increased across the city.
LA has increased loans and launched small business programs guided by "Mapping Black-Owned Businesses and Loans in Los Angeles".
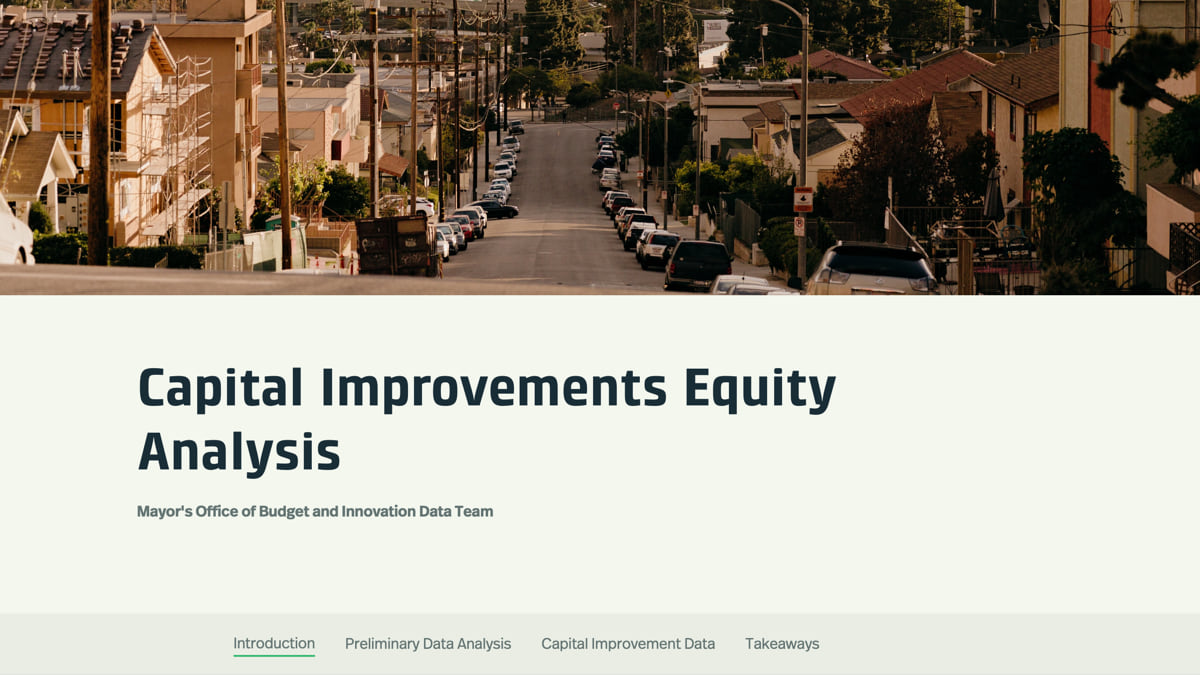
The Los Angeles Mayor's Office of Budget and Innovation Data Team mapped the city's infrastructure assets, and compared investments to the communities that were served.
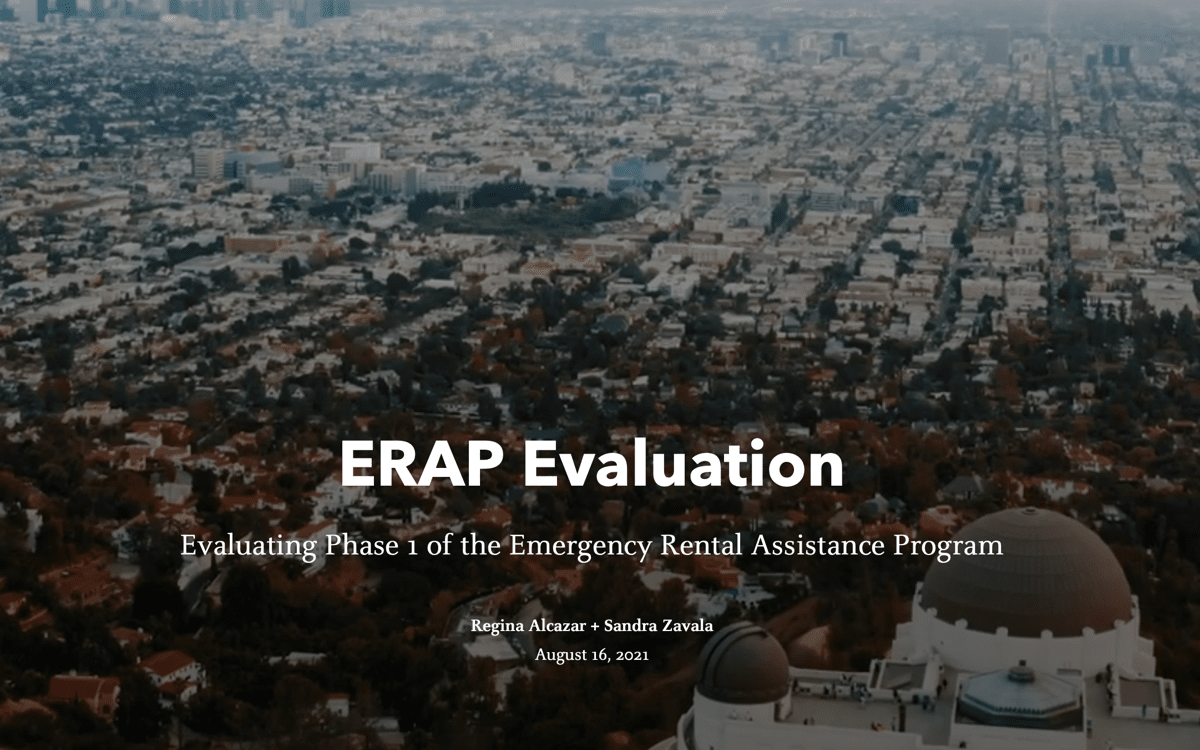
An interactive site helped City of Los Angeles staff examine the delivery of its Emergency Rental Assistance Program to keep residents housed during the pandemic.
Q: How would you describe the role of data and maps for decision making?
A: Data can help us improve city programs, services, and operations, and inform policy change. We always start by defining the problem. A problem well-defined is a problem half-solved. And from there, we explore the available data sets, and the outcomes we hope to accomplish by visualizing and diving into the data.
A lot of our problems can be solved by mapping to pinpoint the areas of the greatest need and then connecting those areas with resources. Our data projects typically fall into three buckets: resource allocation projects, gap analysis, and equity analysis projects.
The city is changing all the time, which is why it’s important to have access to quality information and current mapping data. There are a lot of different problems that mapping can help solve.
Nick O’Day is a senior consultant on Esri’s Professional Services team. He focuses on helping municipal customers with community engagement and organizational collaboration tools. He enjoys building cool stuff with really smart people using the best GIS tools on the planet. Before joining Esri, he worked as a Chief Data Officer where he used ArcGIS to squeeze locally-grown data into a delicious juice for citizens and staff each day. When he’s not GIS'ing, he’s usually cooking, eating, and learning about sunny LA.