
September 25, 2018 |
Chris Chiappinelli |
With commercial space travel an out-of-reach dream for most, there’s an alternative for those wishing to look at the earth from space. With a click and a zoom, one can hover over any part of the planet and see it in detail, thanks to technological advances that show us powerful up-to-date global images via satellite imagery.
Soon, we may be able to see global changes taking place on a weekly or daily basis.
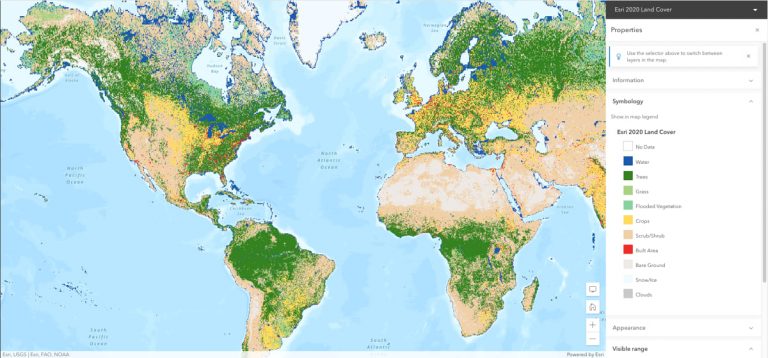
In early July, partners Esri, Impact Observatory, and Microsoft released to the public a high-resolution map of the entire world as it was in 2020. With help from deep learning artificial intelligence (AI) technology, the map will soon make it possible to closely monitor in near real-time the impacts of climate change and humanity’s footprint.
To reach this goal, Impact Observatory used images collected by the European Union’s (EU) Sentinel-2 satellites, made available through the Microsoft Planetary Computer, and trained its artificial intelligence programs to build the global high-resolution land-cover map for Esri that’s now free to the public.
Each pixel in the Esri 2020 Land Cover map represents a 10-meter-by-10-meter block—a significantly higher-resolution than the 30-meter standard—bringing the slightest detail into view in a much shorter amount of time. Ten distinct categories of land cover, the physical type of land, show just what’s where—such as trees, grass, crops, built areas, wetlands, scrub/shrub, and snow/ice.
After being fed a heap of data and 400,000 images of earth, Impact Observatory’s AI technology quickly determined what was on the planet’s surface. The data and images, previously categorized by humans, were used to train it for the task.
The result: A global view of land use and land cover for 2020—produced in a matter of days, instead of months. The capability should lead to answers to pressing questions about climate change and environmental crises for years to come. Everything from conservation planning to food security to hydrologic modeling can be observed.
While the opportunity to view the planet from the outer reaches of our atmosphere has offered affordable yet grounded explorations, land-cover and land-use maps have been a necessary tool for scientists and governments since the inception of geographic information system (GIS) technology. At the start, geographers in Canada invented the first GIS to inventory land for purposes of development, particularly for agriculture.
More recently, the objective has gone beyond collecting inventories to documenting climate-related changes and impactful human activity, including deforestation and reforestation, to balance land use for the better health of our planet. Consider for example the time-lapse feature offered by the World Imagery Wayback app provides more than 40 years of previous satellite imagery to show land feature changes over time.
Population changes, infrastructure development, and water usage, for example—which can create environmental pressure—can be paired with land-cover conditions to facilitate understanding of environmental threats and lead to the proposal of better alternatives, wrote K. Bruce Jones of the US Geological Survey (USGS) in a paper titled the “Importance of Land Cover and Biophysical Data in Landscape-Based Environmental Assessments.”
Land-cover analysis also has been used to help establish a population’s risk to wildfire, flooding, tsunamis, and earthquakes and even to assess vulnerability to contracting Lyme disease, proneness to pollutants, or the likelihood of famine. It can be used to predict crop yields and place priorities on areas to preserve.
The US Environmental Protection Agency Regional Vulnerability Assessment Program, the National Park Service’s Watershed Condition Assessment Program, and the US Forest Service’s Forests on the Edge Assessment are among those using land-cover data on GIS maps, paired with other information, to make aid decision-making.
Land cover can be a basis for scientific modeling, looking at anything from habitat suitability to environmental justice issues. A higher-resolution view and quicker turnaround time will be even more valuable to decision-makers observing ever-increasing environmental changes.
Take efforts to reforest areas of Burkina Faso or the $8-billion continent-wide initiative to build a Great Green Wall of trees stretching across Africa. Progress could soon be observed at any time, from anywhere, with the latest technology that produced the Esri 2020 Land Cover map, because of its level of detail and timeliness. The same could be possible for areas such as the Chesapeake Bay watershed that spans 206 counties across six US states.
In this same way, environmental leaders have relied heavily on high-resolution land-cover maps as they’ve monitored pollution levels for more than a decade.
When asked recently for examples of technology that have the potential to curb harmful environmental practices in their tracks, Esri chief scientist Dawn Wright pointed to the technological advancements behind the new land-cover map.
“We’re providing the world with a trusted, accessible, and high-resolution source for global land cover at a 10-meter resolution and making this land cover on demand so we can catch things in the act, such as if there’s clear-cutting going on or forced migration or illegal dumping or just for monitoring change in conservation areas,” she said.
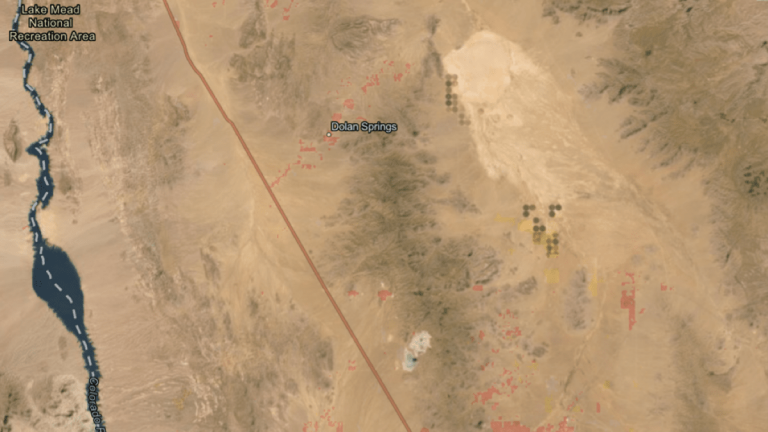
Seeing where humans have spread across the landscape, in sometimes surprising locations, is perhaps the easiest impact to pinpoint, as the map comes equipped with a stark red color attached to anything built on the land.
A tiny, unfinished housing development near an Arizona ghost town outside Las Vegas may have gone unnoticed, for example, if it weren’t for a handful of tiny red dots indicating structures built in the vast, untouched desert. There the small development sits, less than an hour’s drive south of the Hoover Dam—a landmark that has increasingly manifested extreme climate changes by lower and lower waterlines that leave “bathtub” rings where water level had once reached. Zoomed in, looking at a basemap imagery layer beneath the land-cover data, the smallest individual house can be seen. Otherwise, it’d be hard to tell that anything was there but scrub.
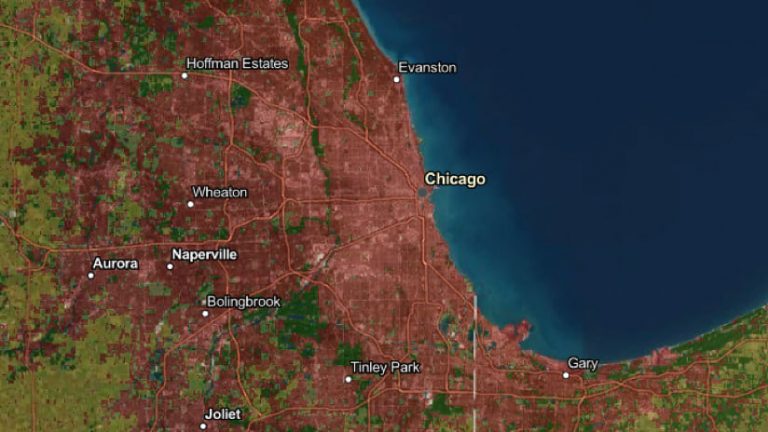
In and around Chicago, Illinois, one can see nearly all 10 land-cover categories. Difficult to miss are the built-up areas of the metropolis that crowd the shore of Lake Michigan. The scene, recently highlighted by the New York Times in a story headlined “A Battle Between a Great City and a Great Lake,” illustrates the city’s vulnerabilities to climate change.
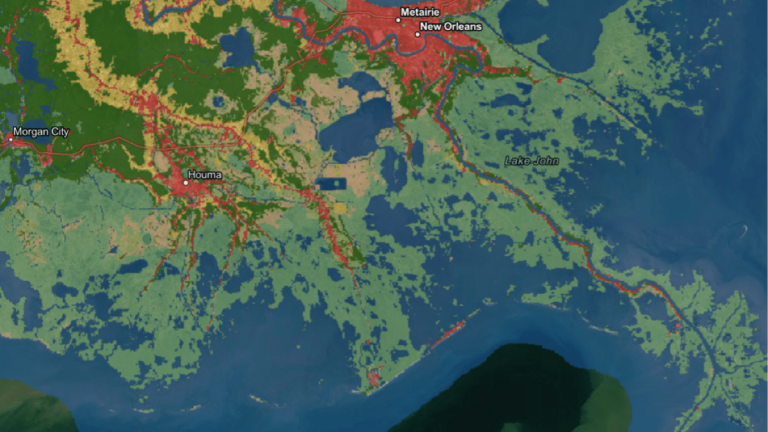
Louisiana’s coastal deltas, whose stark changes prompted the National Aeronautics and Space Administration (NASA) to launch the Delta-X program, can be observed, including a shrunken Terrebonne Basin with the growing Atchafalaya Basin to its left. The increasing rate of change may become even more apparent as updates to the map are made on a more frequent basis.
The views are all part of a visual story that may have normally taken years to piece together if a team of humans had instead combed through images to identify features on the earth’s surface. The work took Impact Observatory’s machines less than a week to complete.
Until July 23, 1972, there had been no way to view the entirety of the planet’s terrain with the exception of photos of the earth taken from space missions that captured only glimpses. That’s when NASA, prompted seven years earlier by then US Geological Survey director William Pecora, launched the first of a series of satellites to collect images of the planet. The move gave scientists a bigger, better picture of the earth’s surface from above.
The first Landsat satellite (originally called the Earth Resources Technology Satellite) was equipped with remote sensors and could capture previously unseen images while orbiting the planet. It was the brainchild of Virginia Tower Norwood, an MIT alumnus who, while at Hughes Aircraft, invented the multispectral scanner that was integral to capturing the images for NASA and USGS. Data collected by her scanner was sent to ground stations, where it was decoded into images at a resolution that was surprisingly sharp given the technology available at the time.
The eighth and most recent Landsat satellite to launch was sent to space in 2013. The ninth incarnation is expected to make its way into orbit in September 2021.The satellites circle the globe, constantly collecting images, and taking 16 days to collect information about the entire planet.
Collected Landsat images have been freely available to the public since 2009. The same spirit of openness has governed images captured by the EU’s Sentinel-2 satellites, part of the European Commission’s 20-year-old Copernicus program to explore the earth’s surface, oceans, and atmosphere. The Sentinel-2 satellites take just five days to collect imagery covering the entire globe.
The dramatically reduced time to produce a detailed, up-to-date land-cover map of the planet—between the time imagery is collected to when AI machines use that data to categorize the land—is what carries the biggest potential for observations of the earth.
Jack Dangermond, founder and president of Esri, recently reminded the worldwide community of GIS users of the need to act quickly on climate change.
“Move rapidly and urgently, because our world really needs it, because we need to create sustainable solutions,” he said during opening remarks at the Esri User Conference in July. “It’s late in the day, but it’s not dark yet.”
With AI and deep learning, we can quickly create global data to meet the urgency of the moment. The brightest minds can turn to land-cover maps to observe environmental statuses and trends, conduct impact analysis, assess vulnerability and risk, and run planning scenarios that focus on improving human and planetary health. Scientists and policy makers can now focus on problems and solutions rather than the process of classifying and categorizing.