
August 28, 2017 |
February 25, 2021
As the locus of most economic activity and greenhouse gas emissions, cities around the world face the escalating challenge of understanding and managing climate change. Cities are home to half the world’s population, and as urbanization increases so too will climate risk. This makes urban strategies to curb emissions all the more critical. Many of these strategies are being built around location-specific insight from data-driven maps and spatial analysis, using a geographic information system (GIS).
While cities stand out as primary contributors to climate issues, they are also the biggest victims of climate change. Most lie near coastlines or inland waters, putting them in immediate danger from rising sea levels and extreme weather events.
Taking a more granular view, climate vulnerability across cities is unevenly distributed. Low-income communities suffer more than others, often for deeply rooted historical reasons. As the crisis intensifies, these urban climate inequities will too.
Leaders in many major US cities are approaching climate risk and social equity issues by rethinking public parks, guided by GIS maps. To that end, the Trust for Public Land (TPL)—a San Francisco-based nonprofit that advocates for the creation of parks and preservation of greenspaces—has partnered with governments in Boston, Los Angeles, New York, Denver, and other US cities. Ten years ago, TPL launched its Climate-Smart Cities program which addresses unique climate-related problems in urban areas.
“Parks promote health and improve well-being, build social cohesion when communities come together outdoors, and make cities more resilient to climate change,” said Lara Miller, TPL’s senior GIS project manager.
TPL staff use GIS maps to, for instance, identify which communities are underserved by parks or identify how many people within a city are able to reach a park within a 10-minute walk.
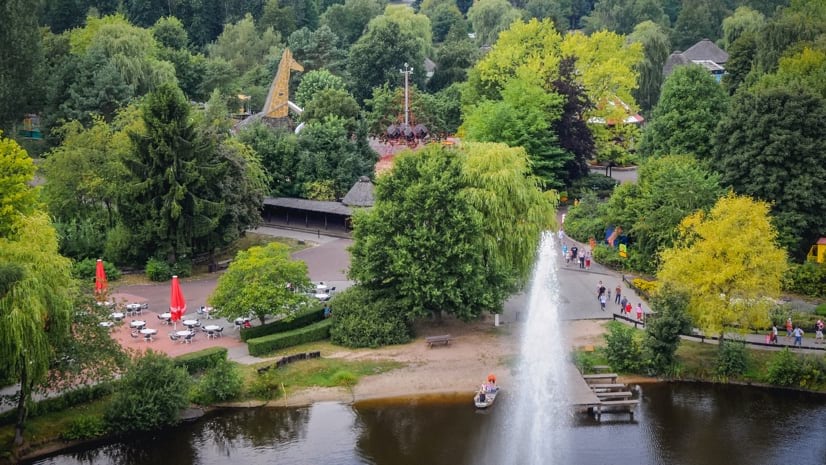
Through collaborative work with local governments, TPL helps cities build green infrastructure with an emphasis on climate change resilience. Projects might include new trails and transit lines, tree canopy to increase shade and reduce heat islands, parkland and playgrounds that double as flood-reducers, and shoreline parks that protect coastal cities from sea level rise.
Just a few years into recovery from Hurricane Katrina, New Orleans became one of the first TPL Climate Smart Cities partnerships. Causing more than 1,800 deaths and $125 billion in damage, Katrina was a harbinger of the disruptive weather events that would increase with climate change.
As the city prioritized improving climate resilience, TPL facilitated the creation of “green schoolyards,” replacing concrete surfaces prone to flooding with gardens of native plants that absorb rainfall and runoff. Several other interventions, including wetlands restoration and stormwater catchment basins, also addressed flood concerns while increasing open space access for neighborhoods that did not previously have it.

The New Orleans collaboration set a Climate Smart precedent for encouraging data-driven solutions. TPL developed Climate Smart Cities New Orleans, a GIS-based tool to plan and implement projects. Climate Smart Cities New Orleans stores and integrates location-specific datasets, and projects them as layers on a smart map. For New Orleans, this included flood data, public health and household income information, and a map layer of green space access across the city.
“We tailor our work based on a city’s biggest challenges and goals,” said Taj Schottland, The Trust for Public Land’s senior climate program manager. “For a city like New Orleans, it’s no surprise that the emphasis would be on flooding and absorbing runoff. In other cities, sometimes it’s transportation or urban heat islands that emerge as the major priority.”
These tools help communities to understand risks, but also guide local action. In New Orleans, “whenever someone proposes a green infrastructure project, the City requires the applicants to use our decision-support tool to justify why they want to do it in a given location,” Schottland explained.
Intense media coverage of Hurricane Katrina highlighted the equity component of natural disasters—who is impacted more than others, and how those affected are treated in the disaster’s aftermath.
New Orleans’ Black residents, faced with disproportionate poverty rates, were less likely to have a means of escaping the city. In the most symbolically stark example, evacuees were prevented by police from walking over the Mississippi River bridge that connects New Orleans with the much whiter town of Gretna.
In the ensuing years, environmental justice—the equal treatment and involvement of all people in environmental decision making—has become more mainstream.
TPL’s Climate Smart tool has been one way for cities to highlight environmental justice. In a recent collaboration, TPL staff helped Los Angeles planners identify areas of extreme heat within the city to prioritize heat reduction efforts.
“We were able to show the city the census blocks, and the data relating to the census blocks, overlaid with heat islands,” Schottland said. “Low-income residents who live in hotter neighborhoods with less tree canopy are less likely to have the resources to pay for air conditioning—or they may be more likely to work outside instead of having an air-conditioned office job. So we want to direct city investments to these neighborhoods and protect those who are experiencing extreme heat.”
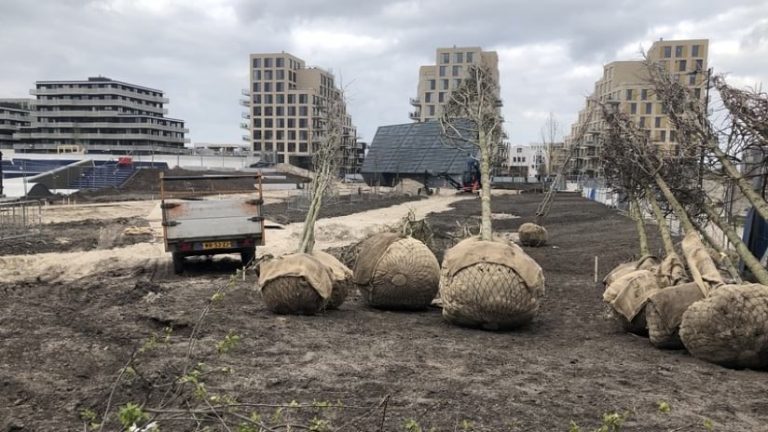
As our society has come to understand the need to tackle social inequity and the climate crisis, TPL staff have refined their approach. As TPL builds new GIS-based tools and creates new parks, the staff help cities guard against unintended consequences of neighborhood improvement. New green infrastructure like parks, gardens, and playgrounds can make a neighborhood more desirable, a process researchers call “environmental gentrification.”
“There are examples of green space being created in a neighborhood and people being displaced,” Miller said. “During planning and project implementation, it is critical we engage community partners to understand gentrification or displacement concerns and bring those concerns into our park development process.”
The Climate-Smart Cities tool provides a way, in effect, to knit together TPL’s three pillars of parkland value—health, equity, and climate—into a more expansive view of the modern city.
“The program has always had an equity lens, but our thinking about what equity itself means has evolved and continues to evolve,” Miller said. “When it began, we were thinking more in terms of physical access, like who is without air conditioning or those who can’t walk to a park within 10-minutes of where they live. Now we can also examine other issues related to equity, like access to information and decision making.”
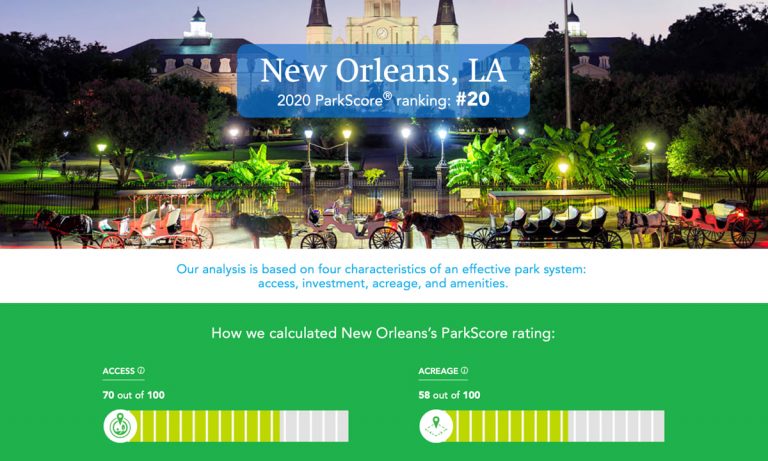
This evolution continues in another national tool developed by TPL, the ParkScore Index. This index quantifies how well the 100 largest US cities are providing communities with park resources. Cities are awarded points based on analysis of four important characteristics of an effective park system: acreage, investment, amenities, and access. This year ParkScore will add a fifth characteristic, equity, to better assess how park systems are providing equitable access to the health, climate, and community-building benefits of parks and greenspace.
TPL developers also designed ParkServe, another GIS tool that quantifies how well the cities are meeting community needs for greenspace. Using ParkServe, city leaders and park advocates can access TPL’s comprehensive database of local parks in nearly 14,000 cities, towns, and communities to guide improvement efforts. This data underpins TPL’s engagement with cities.

August 28, 2017 |
February 1, 2019 |
October 13, 2020 | Multiple Authors |